

Population Dynamics of Ammodytes personatus (Girard, 1856) in Shandong, China: Does this Resource Needs Management?


Population Dynamics of Ammodytes personatus (Girard, 1856) in Shandong, China: Does this Resource Needs Management?
Muhammad Mohsin1, Zhang Luyao2*, Zhu Ting3, Yin Hengbin3 and Qian Chong3
1Fisheries Management, College of International Finance and Trade, Zhejiang Yue Xiu University of Foreign Languages, Shaoxing, 312000, China
2Strategic Management, School of Business, Hanyang University, Seoul, 04763, Korea
3Marine Resource Management, School of Finance and Trade, Wenzhou Business College, Wenzhou, 325035, China
ABSTRACT
China is the biggest fish producing country in the world. Its marine waters are frequently declared as over-harvested. Therefore, accessing the exploitation status of commercial fishery resources becomes very important for their proper management. This study uses catch statistics, 2007-2018, of a vital fishery resource, viz., Ammodytes personatus (Girard, 1856) to know its stock status and ongoing economic implications. For this purpose, Surplus Production Models (SPMs) were applied to the data through two world famous fishery routines, viz., Catch and Effort Data Analysis (CEDA) and A Stock Production Model Incorporating Covariates (ASPIC). In CEDA, we applied two SPMs, viz., Fox, Schaefer and Pella Tomlinson Models abbreviated as FM, SM and PTM, in that order. On the other hand, in ASPIC, we sued two SPMs, viz., FM and Logistic Model (LM). For principle IP 0.9, CEDA calculated MSY in a range between 13500 t and 30500 t whereas the estimates of ASPIC remained between 71500 t and 85000 t. Maximum sustainable yield (MSY) estimates are considerably lower than recent catch statistics which evidently indicates overexploitation. It is suggested that the target catch of this fishery resource should be between 14000 t and 20000 t. Moreover, it is highly recommended to conduct further more comprehensive and detailed studies on A. personatus fishery resource as this study is just a first step.
Article Information
Received 19 August 2021
Revised 03 October 2021
Accepted 18 October 2021
Available online 09 February 2022
(early access)
Published 25 February 2022
Authors’ Contribution
MM and ZL initiated the project, performed statistical analysis and wrote the manuscript. ZT and YH revised many parts and gathered review of literature. QC constructed tables and figures and gave suggestions on the manuscript.
Key words
Ammodytes personatus, Overexploitation, Management, SPMs, China
DOI: https://dx.doi.org/10.17582/journal.pjz/20210819040806
* Corresponding author: zhangluyao@hanyang.ac.kr
0030-9923/2022/0003-1269 $ 9.00/0
Copyright 2022 Zoological Society of Pakistan
INTRODUCTION
The use of surplus production models (SPMs) is very common for managing fishery resources. These models estimate exclusive fishery parameters such as maximum sustainable yield (MSY), fishing mortality (F), fish stock biomass (B) etc. and are easy to employ. The word surplus represents that B will propagate in the absence of fishing. It means fishing can be continued without affecting the fish stock. In other words, fishing can be sustainably continued as overall fishery stock will not decrease. These models use the concept of depletion. It refers to the fishery stock reduction reflected through a decrease in abundance index. These models require a comprehensive and continuous record of catch statistics. Catch statistics means reported catch which is usually in tons (t) and effort which is mostly represented by either number of fishermen or number of boats. Commonly, without gap statistics are preferred (Hoggarth et al., 2006). These models are usually given priority over the other fishery models, such as age-structured, because of their ease of use. These models use a simple catch index or catch per unit effort (CPUE) to estimate fishery management parameters, i.e., MSY. In view of MSY estimates, management advice can be given (Jensen, 2002). A considerable amount of published literature uses SPMs to access fishery status (Ricker, 1975; Hilborn and Walters, 1992; Maunder et al., 2006; Mohsin et al., 2019). This is the reason for using SPMs in this study.
There are different versions of SPMs. Generally, SPMs selection depends upon the type of data to be analyzed and its purpose. Mostly, several SPMs are applied to the data. It is done to ensure the reliability of results and find a suitable good fit model. Once the good fit model is found certain reference points can be determined for making management advice. One very important aspect of SPMs is that sometimes they compute the same parameter estimates. Although different models have different assumptions, but same output means that model application is independent of some biological assumptions. Hence, obtained results are valid, but the key point is to find the best fit model (Hoggarth et al., 2006). Model evaluation is a very important step. At this stage, one important parameter is good of fit (R2). Its higher value indicates a better fitting of model. However, along with this parameters, other parameters like MSY, coefficient of variation CV, etc., should also be considered (Hoggarth et al., 2006).
China is a world leader in fish production. In 2018, more than thirty percent in the global fish supply was contributed by China (FAO, 2020). Diverse fishery resources are found in Chinese marine waters and thousands of coastal fishermen families thrive on them. Capture fisheries constitutes a significant portion of total fish catch (Zhang et al., 2020). Thus, study of Chinese capture fisheries has immense importance to understand the future of fish stocks and food security issues (Szuwalski et al., 2020). Ammodytes personatus fishery is among significant commercial resources in China. This fish is a native fish in many countries, such as Japan, Korea, the USA, and China (Hong et al., 2000). It is a shallow water dwelling cold-water fish species. During night it swims at the sea surface and buries into sand when temperature rises (Tomiyama and Yanagibashi, 2004). It prefers to spawn in bay waters (Kitagawa and Yamashita, 1986). Long distance migration is not evident in this fish species (Hashimoto and Kawasaki, 1981). This feature increases the reliability of this study as statistical methods would assume no migration of fish stock. However, various morphological, genetic and ecological differences exist between populations of this species (Okamoto et al., 1988). This fish has various local names. It is known as Tobis, Pacific sandeel, Sandaal, Ikanago, Salton, and Mian tiao yu in Danish, English, German, Japanese, Spanish and Chinese languages (FAO, 2021; Fish Base, 2021). Its body shape is cylinder type (FAO, 2021). Unfortunately, reported statistics indicate that the catch of this commercially important fish is declining gradually (CFY, 2019). Several other fishery resources in China have already been declared overexploited (CFY, 2019). Thus evaluating stock status for fishery management becomes crucial.
Online available scientific literature mostly documents diverse aspects of research on A. personatus in China. Some studies evaluated the genome sequence of mitochondria of A. personatus (Gao et al., 2013). There is also available literature regarding the segregation and classification of diverse shapes of micro-satellites in A. personatus (Ren et al., 2009). Some researchers have worked on feeding habits and the ecological performance of A. personatus (Sun et al., 2010). Thus, published literature focuses on various aspects of A. personatus, excluding its fishery status. We could find the only study which evaluated the stock status of this fishery resource. But, this study is very old, conducted almost two decades before in 2003 (Chen, 2004). However, there is no updated study in this regard. Thus, this study is the first recent attempt to access the fishery status of A. personatus because knowing stock status is a very essential and basic step for fishery management (Panhwar and Liu, 2013). The main objective of this study is to calculate fishery harvest levels of A. personatus in Shandong marine water of China by using SPMs. Outcomes of this study can be used to identify some basic information about the ongoing stock status of A. personatus on which further research can be planned.
MATERIALS AND METHODS
Data acquisition
Catch statistics, 2007-2018, of A. personatus fish from Shandong, China were statistically evaluated by using non-equilibrium SPMs (surplus production models). Data was fetched through various volumes of the published China Fisheries Yearbooks (CFY, 2019). Catch and effort statistics are given in t and fishermen count or number, respectively.
Data analysis
Collectively we used non-equilibrium versions of three famous fishery SPMs, viz., Fox, Schaefer and Pella-Tomlinson Model hereafter abbreviated as FM, SM and PTM, in that order. SM is very frequently employed to access reliable fishery status of important resources around the globe. It uses a special assumption regarding fish population increase which is logistic increase. It is simply presented through the following equation:
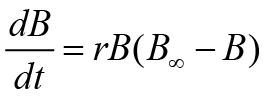 (
(In the above equality, r, B, B∞ and t denote growth rate, the biomass of fish population, carrying capacity of the environment, and time, respectively. On the other hand, the remaining two models, i.e., PTM and FM use the idea of generalized fishery population increase and peculiar growth formula presented by Gompertz. These models are represented as follows:
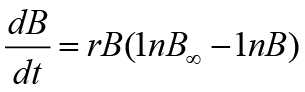 (
(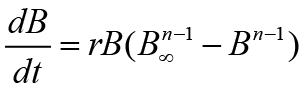 (
(Here, n represents the parameter for shape. The rest of the parameters have already been explained. In addition, it is mandatory to clarify that SPMs as mentioned earlier were used with the help of specialized fishery routines. We used two software CEDA (catch and data analysis) (Hoggarth et al., 2006) and ASPIC (a stock production model incorporating covariates). Both the software were obtained by using online web resources. Former software was taken by requesting MRAG, UK whereas later one was obtained through NOAA fisheries, USA. Moreover, we used particular assumptions in CEDA, known as error assumptions (EA). These EA were called normal, log-normal and gamma EA and were abbreviated as NEA, LNEA and GEA, in that order. We did not use any EA in ASPIC. Only two models, i.e., FM and LM (Logistic Model) were used in ASPIC. More than one SPMs were used in this study to ensure increased reliability of results. To compare different models, we used some specific criteria, i.e., values of MSY, CV and R2. These parameter values were considered collectively to consider output parameter result or reject it. MSY estimates beyond reasonable range, either too high or low, were not considered. Similarly, only results with reasonable CV values were taken into consideration. Likewise, estimates having R2 higher than 0.5 were used to draw scientific results.
CEDA software
This software is a reliable tool for accessing fishery status. It helped us to compute very important fishery parameters. Various parameters estimated by using this statistical routine were model fit goodness (R2), rate of fishery growth (r), MSY, loading capacity of the aquatic system (K), B and coefficient of catchability (q). This statistical tool uses a special estimation method for fishery parameters which is scientifically called as bootstrapping technique. Moreover, it used a confidence interval of 95% while calculating parameters. We applied this software to data in two steps. First, various parameters by using principle initial proportion (IP) value were estimated. This value was obtained by diving the highest catch by initial catch in the used catch and effort data series. The principle IP values in our study remained as 0.9. Second, we also applied CEDA to compute various parameters by using assumed other IP values from 0.1 to 0.8 which is usually called sensitivity analysis. The rationale for using other IP values is that IP value demonstrates fishery status. A higher value like 0.9 indicates that fishery is about fully exploited whereas its lower values like 0.1, 0.2 etc. represent that fishery stock is almost virgin or not fully exploited.
ASPIC software
In addition to CEDA, this software was also applied to data. It computed important fishery parameters like K, R2 and MSY. Besides, it also estimated F and B and their ratios at MSY, i.e. F/FMSY and B/BMSY. Two different types of files, viz., BOT and FIT were prepared to analyze data. Each of them represents the dissimilar mode of computation program. Only BOT used bootstrapping methods like CEDA and estimated general means of parameters among these two modes or files. On the other hand, FIT estimated specifically those parameters which are for management purposes. 500 trials for each of these files were set into ASPIC. In addition to using principle IP value, sensitivity analysis was also performed by using IP values from 0.1 to 0.8.
RESULTS
Computed results indicate significant variation in catch and effort statistics during the course of the study period. The maximum catch is reported during 2009 (94289 t), while the minimum is observed during 2018 (30741 t). On the other hand, the average catch was estimated at 62272 t / year. Statistics indicate that effort increased swiftly between 2007 (498141 no. of fishermen) and 2012 (1009228 no. of fishermen). However, effort steadied between 2012 (1009228 no. of fishermen) and 2018 (1019108 no. of fishermen). Another important point regarding data pattern is that although effort remained stabilized as aforementioned during the last six reported years, quite interestingly, the catch showed declining trend during this time period (Fig. 1). CPUE has shown decreasing trend from 2007 (0.162) to 2018 (0.03) (Fig. 2). CEDA graphs are graphically presented in Figure 3. There are very minute differences in these graphs.
CEDA result
MSY estimates along with their CV values were calculated by using CEDA for all IP values. It was found that CEDA estimated higher values of MSY against lower IP values and vice versa. For instance, for IP 0.1 and 0.9, MSY estimates remained 1.88E+11 t and 14291 t by using FM (NEA), respectively. A similar data pattern was observed for other models and their EA (Table I). Various parameters estimated for principal IP value are given in Table II. For FM, MSY along CV value was computed as 14291 t (0.771) and 24239 t (0.265) by employing NEA and LNEA, in that order. In this model, GEA produced minimization failure. In SM and PTM, EA produced the same MSY estimates, i.e., 13933 t, 30354 t and 23628 t for NEA, LNEA and GEA, respectively. However, their CV values differed from each other. For SM, CV values remained 1.202, 0.274 and 0.530 and for PTM, CV values were estimated as 1.085, 0.255 and 0.599, in that order. The highest R2 value, 0.890, was observed in FM (LNEA).
Table I. Predicted values of MSY for A. personatus in Shandong marine waters, China by using CEDA (IP = 0.1-0.9).
|
IP |
Model |
||||||||
|
FM |
SM |
PTM |
|||||||
|
NEA |
LNEA |
GEA |
NEA |
LNEA |
GEA |
NEA |
LNEA |
GEA |
|
|
0.1 |
1.88E+11 |
130562 |
MF |
MF |
226999 |
568487 |
MF |
222699 |
568487 |
|
(0.561) |
(0.001) |
(MF) |
(MF) |
(0.001) |
(95.7) |
(MF) |
(0.01) |
(556.06) |
|
|
0.2 |
88541 |
89541 |
85287 |
126442 |
126448 |
126448 |
126442 |
126449 |
126448 |
|
(0.011) |
(0.001) |
(0.017) |
(0.004) |
(0.001) |
(0.001) |
(0.005) |
(0.001) |
(0.001) |
|
|
0.3 |
56310 |
41215 |
74532 |
MF |
94341 |
94338 |
MF |
94342 |
94338 |
|
(0.149) |
(0.141) |
(0.001) |
(MF) |
(0.001) |
(0.001) |
(MF) |
(0.001) |
(0.003) |
|
|
0.4 |
40519 |
38126 |
66699 |
MF |
79268 |
MF |
MF |
79268 |
MF |
|
(0.268) |
(0.149) |
(0.038) |
(MF) |
(0.001) |
(MF) |
(MF) |
(0.001) |
(MF) |
|
|
0.5 |
30918 |
36619 |
35965 |
MF |
71998 |
MF |
MF |
71499 |
MF |
|
|
(0.346) |
(0.161) |
(0.237) |
(MF) |
(0.001) |
(MF) |
(MF) |
(0.004) |
(MF) |
|
0.6 |
24526 |
33042 |
2971 |
52496 |
66590 |
MF |
52496 |
66590 |
MF |
|
(0.444) |
(0.157) |
(7.497) |
(0.144) |
(0.002) |
(MF) |
(0.161) |
(0.002) |
(MF) |
|
|
0.7 |
20054 |
31223 |
MF |
32267 |
42905 |
MF |
32267 |
42905 |
MF |
|
(0.509) |
(0.174) |
(MF) |
(0.482) |
(0.081) |
(MF) |
(0.473) |
(0.101) |
(MF) |
|
|
0.8 |
16765 |
16765 |
26489 |
MF |
9942 |
22704 |
MF |
20604 |
38913 |
|
(0.638) |
(0.223) |
(MF) |
(1.562) |
(0.421) |
(MF) |
(0.781) |
(0.135) |
(0.462) |
|
|
0.9 |
14291 |
24239 |
MF |
13933 |
30354 |
23628 |
13933 |
30354 |
23628 |
|
(0.719) |
(0.244) |
(MF) |
(1.118) |
(0.290) |
(0.629) |
(1.182) |
(0.252) |
(0.584) |
|
CV, coefficient of variation (written in parenthesis); MF, minimization failure.
Table II. Different parameters calculated by using CEDA for A. personatus in Shandong marine waters, China (IP = 0.9).
|
Model |
K |
q |
r |
MSY |
CV |
R2 |
B |
|
FM (NEA) |
718969 |
2.35E-07 |
0.054 |
14291 |
0.771 |
0.840 |
108270 |
|
FM (LNEA) |
607737 |
2.90E-07 |
0.108 |
24239 |
0.265 |
0.890 |
99340 |
|
FM (GEA) |
MF |
MF |
MF |
MF |
MF |
MF |
MF |
|
SM (NEA) |
722803 |
2.31E-07 |
0.077 |
13933 |
1.202 |
0.834 |
102999 |
|
SM (LNEA) |
547835 |
3.19E-07 |
0.222 |
30354 |
0.274 |
0.883 |
85037 |
|
SM (GEA) |
623308 |
2.73E-07 |
0.152 |
23628 |
0.530 |
0.861 |
97309 |
|
PTM (NEA) |
722803 |
2.31E-07 |
0.077 |
13933 |
1.085 |
0.834 |
102999 |
|
PTM (LNEA) |
547835 |
3.19E-07 |
0.222 |
30354 |
0.255 |
0.883 |
85037 |
|
PTM (GEA) |
623308 |
2.74E-07 |
0.152 |
23628 |
0.599 |
0.861 |
97309 |
K, carrying capacity; q, Catchability coefficient; r, intrinsic population growth rate; MSY, Maximum sustainable yield; CV, coefficient of variation; R2, coefficient of determination; B, final biomass; MF, Minimization failure.
ASPIC result
ASPIC estimated obtained by using principal IP value of 0.9 are given in Table III. For FM, MSY, CV and R2 estimates remained as 84540 t, 0.306 and 0.942 whereas for LM their values were calculated as 71840 t, 0.211 and 0.937, in that order. Various parameters were also estimated by using other IP values, i.e., from 0.1 to 0.8. Like CEDA, ASPIC also estimated higher MSY values when lower IP values were used. For example, for IP 0.1, this software calculated MSY as 89460 t whereas, for IP 0.9, MSY value was computed as 84540 t in FM. The same data estimation pattern was observed in LM (Table IV). Estimates regarding F and B are presented in Table V. It is clear for both the models, i.e., FM and LM, F is increasing and B is decreasing. For FM, in 2007, F was 0.462, which increased and became 0.864 in 2018. On the other hand, B has decreased from 178400 t (2007) to 36210 t (2018). The same pattern of change in F and B is observed in LM.
DISCUSSION
Global published fishery management literature frequently documents the use of SPMs, which indicates worldwide recognition of these models as authentic scientific tools. A plethora of scientific work carried on population assessment of commercial fishery resources of Pakistan also employ the same SPMs used in this study (Memon et al., 2015; Panhwar and Liu, 2013). The reason for the global trust and practice of these SPMs depends upon their ease of use. These models provide an opportunity to compute fishery status by employing simple statistics, i.e., catch and effort. Otherwise, complex statistics comprising age and length of fish data are generally needed to compute these parameters (Mohsin et al., 2017). It is also worth mention that there are two main types of SPMs, viz., equilibrium and non-equilibrium SPMs. The former type of SPMs basically represents earlier or classical versions of SPMs. These SPMs assumed fishery in a constant or non-changing state. Hence, they were named equilibrium SPMs. Now, scientists find this assumption far beyond reality as fishery status is dynamic always. Therefore, modern SPMs transformed into the later type of SPMs, i.e., non-equilibrium SPMs. These SPMs are more accurate, realistic and dependable (Medley and Ninnes, 1997; Hoggarth et al., 2006).
Models are commonly built on some specific suppositions. Non-equilibrium SPMs employed in this study are also based upon certain assumptions. Such as, there does not exist any kind of interaction in fishery stock, whether it is in the form of intra interaction or inter- interaction. Likewise, the coefficient of catch remains the same and does not change with the passage of time. No fish stock leave or enter into the local fish population, i.e., B remains unchanged. Similarly, there is no inter-dependence between the age of fish and its growth rate. Equally, obtained fishery statistics represent the actual fish stock position. Alike, both types of mortality, i.e., natural and artificial occur at the same time. Last but not the least, the efficiency of fishing boasts remains constant and does not change over time (Hoggarth et al., 2006). Scientific knowledge signifies that may be some or many assumptions cannot be achieved practically. However, it does not mean that these models are useless rather, these are powerful fishery analysis tools widely used in the world to manage fishery resources. Therefore, they are of practical importance (Musick and Bonfil, 2005).
Estimated MSY range by using principle IP values through CEDA and ASPIC clearly fall into a distinct range. CEDA computes this parameter in a narrow range as compared to ASPIC (Tables II and III). As we have mentioned before, we used specific criteria to draw results
Table III. Different parameters assessed by using ASPIC for A. personatus in Shandong marine waters, China.
|
Model |
IP |
MSY |
K |
q |
FMSY |
BMSY |
R2 |
CV |
|
FM |
0.9 |
84540 |
890100 |
8.68E-07 |
0.258 |
327400 |
0.942 |
0.306 |
|
LM |
0.9 |
71840 |
273400 |
1.02E-07 |
0.526 |
136700 |
0.937 |
0.211 |
Table IV. ASPIC outputs for A. personatus by using ASPIC in Shandong marine waters, China (IP = 0.5-1).
|
Model |
IP |
MSY |
K |
q |
FMSY |
BMSY |
R2 |
CV |
|
0.1 |
89460 |
886600 |
9.32E-07 |
0.274 |
326200 |
0.942 |
0.254 |
|
|
0.2 |
86280 |
986100 |
8.28E-07 |
0.238 |
362800 |
0.942 |
0.302 |
|
|
FM |
0.3 |
78510 |
456200 |
1.27E-06 |
0.468 |
167800 |
0.919 |
0.232 |
|
0.4 |
84850 |
902000 |
8.65E-07 |
0.256 |
331800 |
0.942 |
0.329 |
|
|
0.5 |
88250 |
875400 |
9.25E-07 |
0.274 |
322100 |
0.942 |
0.306 |
|
|
0.6 |
90250 |
945500 |
9.00E-07 |
0.259 |
347800 |
0.942 |
0.269 |
|
|
0.7 |
92290 |
935600 |
9.31E-07 |
0.268 |
344200 |
0.942 |
0.267 |
|
|
0.8 |
86160 |
933400 |
8.59E-07 |
0.251 |
343400 |
0.942 |
0.295 |
|
|
0.9 |
84540 |
890100 |
8.68E-07 |
0.258 |
327400 |
0.942 |
0.306 |
|
|
0.1 |
74080 |
245200 |
1.15E-06 |
0.604 |
122600 |
0.937 |
0.166 |
|
|
0.2 |
84900 |
2224000 |
3.26E-07 |
0.076 |
1112000 |
0.914 |
0.150 |
|
|
LM |
0.3 |
75530 |
238700 |
1.20E-06 |
0.633 |
119400 |
0.938 |
0.203 |
|
0.4 |
75150 |
242900 |
1.18E-06 |
0.619 |
121500 |
0.938 |
0.189 |
|
|
|
0.5 |
76200 |
239700 |
1.21E-06 |
0.636 |
119800 |
0.938 |
0.208 |
|
0.6 |
74720 |
247700 |
1.15E-06 |
0.603 |
123900 |
0.938 |
0.192 |
|
|
0.7 |
76680 |
238500 |
1.23E-06 |
0.643 |
119300 |
0.938 |
0.222 |
|
|
0.8 |
76930 |
233800 |
1.25E-06 |
0.658 |
116900 |
0.937 |
0.209 |
|
|
0.9 |
71840 |
273400 |
1.02E-06 |
0.526 |
136700 |
0.937 |
0.211 |
Table V. ASPIC estimates of fishing mortality (F) and biomass (B) (IP = 0.9).
|
Year |
Model |
|||||||
|
FM |
LM |
|||||||
|
F |
B |
F/FMSY |
B/BMSY |
F |
B |
F/FMSY |
B/BMSY |
|
|
2007 |
0.462 |
178400 |
1.791 |
0.545 |
0.533 |
156700 |
1.015 |
1.147 |
|
2008 |
0.453 |
171100 |
1.756 |
0.522 |
0.531 |
147000 |
1.010 |
1.075 |
|
2009 |
0.613 |
167000 |
2.373 |
0.510 |
0.729 |
142000 |
1.387 |
1.039 |
|
2010 |
0.747 |
142500 |
2.895 |
0.435 |
0.900 |
119200 |
1.713 |
0.872 |
|
2011 |
0.731 |
112000 |
2.833 |
0.342 |
0.876 |
92730 |
1.666 |
0.678 |
|
2012 |
0.877 |
94270 |
3.396 |
0.288 |
1.036 |
79530 |
1.970 |
0.582 |
|
2013 |
0.948 |
72650 |
3.672 |
0.222 |
1.121 |
61750 |
2.134 |
0.452 |
|
2014 |
0.717 |
55800 |
2.776 |
0.170 |
0.841 |
46820 |
1.600 |
0.343 |
|
2015 |
0.826 |
55690 |
3.971 |
0.154 |
0.942 |
48120 |
1.793 |
0.352 |
|
2016 |
1.025 |
50520 |
3.487 |
0.120 |
1.156 |
44880 |
2.199 |
0.328 |
|
2017 |
0.900 |
39380 |
3.345 |
0.111 |
1.032 |
34730 |
1.964 |
0.254 |
|
2018 |
0.864 |
36210 |
3.345 |
0.111 |
1.036 |
31190 |
1.972 |
0.228 |
by considering obtained values of MSY, CV and R2. Among these three parameters, MSY is the most important. The other two parameters just speak off about the model fitness and accuracy of results. MSY estimates when compared to catch data can tell fishery exploitation level. If the estimated value of this parameter is less than catch statistics it indicates that fishery resource is overexploited. If its value is higher, it means the fishery has a potential to increase the catch (Hoggarth et al., 2006). Since MSY estimates of ASPIC are significantly high, we compare them with recent catches in the data series. Therefore, rationally, we consider CEDA results more accurate in this situation. In CEDA, not only computed MSY is under reasonable range but also CV, as well as R2, values are in an appropriate range. CEDA estimates of MSY vividly affirm that. A personatus fishery resource has been consistently overexploited in the past. That’s why this fishery resource is declining rapidly even effort is not increasing. The calculated CPUE pattern given in Figure 2 also indicates this is happening. CPUE is a very simple way to know about the fishery status. Decreasing CPUE is an alarming situation which indicates that fishery resource needs more effective management. A. personatus catch is decreasing even effort is more or less stable, indicates overexploitation. Moreover, declining B and increasing F also indicate degrading fish stock of A. personatus.
Various steps collectively form fishery management. The management process starts from data collection and ends at management advice implementation. At all stages of management, stakeholders are involved (FAO, 1997; Die, 2002). For giving management advice, fishery scientists use estimated parameters as a reference guide. Thus, reference points are the estimated fishery parameters which act as a signpost of fishery and help in making management advice (Hoggarth et al., 2006). The trend of using reference points was started in 1992 (FAO, 1995). Most of the time, two types of reference points are recognized based on their purpose. These types include target points and limit points. According to the parameters, fishery scientists decide the limit of the suggested fishery population exploitation level, which is called are target point. Fishery officers try to manage the exploitation of fishery resources according to these levels. In addition to these, fishery officers also decide about those the harvest levels at which fishery stock will start to suffer scientifically. These points are termed as limit points, and fishery managers try to avoid these points (Caddy and Mahon, 1995; Cochrance, 2002). Thus, usually fishery resource exploitation range is defined because reference points do not represent a single fixed level rather, they symbolize threshold levels. The best fishery management strategy is that which manages fishery resources according to the target and limit reference points. However, these points should be suggested with great care otherwise, management practice may deteriorate fishery stock status instead of improving it. For instance, if MSY is underestimated, this will result in economic loss as we shall harvest less B. On the other side, if MSY is overestimated, this situation will result in fishery degrading, thus the management will fail (Rosenberg et al., 1993).
Models employed in this study do have certain advantages as well as disadvantages. These models estimate exclusive fishery parameters and indicate an ongoing fishery regime. In addition, these models use a non-equilibrium state of the fishery and are practically more reliable than other models (Hoggarth et al., 2006; Medley and Ninnes, 1997). Moreover, these models use various assumptions regarding different fishery aspects and constitute a good framework of analysis (Musick and Bonfil, 2005). Nevertheless, it does not mean that these models only have advantages; instead, they also have disadvantages. For instance, changes in fishery input and q can result in wrong estimates obtained by these models. Furthermore, estimated parameters such as K, r and q are interrelated with each other. This interconnection cannot be accurately estimated without accurate or dependable catch statistics. Data exhibiting good contrast of catch statistics is preferred to be used because low contrast data cannot differentiate between K and r (Hilborn and Walter, 1992).
The findings of this study suggest controlling overexploitation of A. personatus for its long term sustainable use. In this regard, fishery managers can play a vital role and implement existing strategies to observe catch. However, more in-depth studies are recommended to further and precisely investigate this issue before making any action plan. Moreover, stock assessment studies of other commercially important fish species should also be conducted to keep safe fishery resources of China.
CONCLUSION
For principle IP 0.9, CEDA calculated MSY in a range between 13500 t and 30500 t. On the other hand, estimates of ASPIC remained between 71500 t and 85000 t. Hence, CEDA estimated MSY in a limited range and its lower values as compared to ASPIC. MSY estimates of CEDA are considerably lower than recent catch statistics, which indicates overexploitation. Furthermore, increasing F and decreasing B also exhibits the same results. Therefore, this study finds overexploitation of A. personatus fishery resource and considering CEDA results suggests that target catch of this fishery resource should be between 14000 t and 20000 t. Moreover, it is highly recommended to further conduct more comprehensive and detailed studies on this fishery resource by using more long data series as this study is just a first step.
ACKNOWLEDGEMENTS
Authors are grateful to Humanities and Social Science Projects of Zhejiang Province (Grant No. 2022B03) and Education of Zhejiang Province (Grant No. Y202146536).
Statement of conflict of interest
The authors have declared no conflict of interest.
REFERENCES
Caddy, J.F., and Mahon, R., 1995. Reference points for fisheries management. FAO Fisheries Technical Paper No. 347. FAO’s Fisheries Department, Rome, Italy, pp. 1–83.
CFY, 2019. China fishery yearbooks. Printed by Beijing Press, China.
Chen, C., 2004. Ammodytes personatus resources in the Yellow Sea and its sustainable utilization. Shuichan Xuebao, 28: 603–607.
Cochrane, K.L., 2002. The use of scientific information in the design of management strategies. In: A fishery manager’s guidebook: Management measures and their application (ed. K.L. Cochrane). FAO Fisheries Technical Paper No. 424. FAO’s Fisheries Department, Rome, Italy. Chapter 5. pp. 95-130.
Die, D., 2002. Design and implementation of management plans. In: A fishery manager’s guidebook: Management measures and their application (ed. K.L. Cochrane). FAO Fisheries Technical Paper No. 424. FAO’s Fisheries Department, Rome, Italy. Chapter 9. pp. 205-220.
Ding, Q., Shan, X., Jin, X. and Gorfine, H., 2021. A multidimensional analysis of marine capture fisheries in China’s coastal provinces. Fish. Sci. 87: 297–309. https://doi.org/10.1007/s12562-021-01514-9
FAO, 1995. Code of conduct for responsible fisheries. FAO’s Fisheries Department, Rome, Italy, pp. 41.
FAO, 1997. Fisheries management. FAO Technical Guidelines for Responsible Fisheries No. 4. FAO’s Fisheries Department, Rome, Italy, pp. 1–82.
FAO, 2020. Species fact sheets. Ammodytes personatus (Girard, 1856). Available at: http://www.fao.org/fishery/species/3261/en (accessed 15 July, 2021).
FAO, 2021. The state of world fisheries and aquaculture 2020–sustainability in action. Available at: (accessed 15 September, 2021).
Fish Base, 2021. Common names list, Ammodytes personatus (Girard, 1856). Available at: https://www.fishbase.de/ComNames/CommonNamesList. tes&SpeciesName=personatus&StockCode=503 (accessed 12 August, 2021).
Fox, W.W. Jr., 1970. An exponential surplus-yield model for optimizing exploited fish populations. Trans. Am. Fish. Soc., 99: 80–88. https://doi.org/10.1577/1548-8659(1970)99<80:AESMFO>2.0.CO;2
Gao, T., Li, N., Zhang, Y. and Shi, P., 2013. The complete mitochondrial genome of Japanese sandeel Ammodytes personatus (Perciformes, Ammodytidae): Rare structure in control region compared. Mitochondrial DNA, 24: 320-322. https://doi.org/10.3109/19401736.2012.760074
Hashimoto, H. and Kawasaki, T., 1981. Population studies of sandeel, Ammodytes personatus (Girard), in Sendai Bay and its neighborhood. Tohoku J. agric. Res., 31: 173–197.
Hilborn, R. and Walters, C.J., 1992. Quantitative fisheries stock assessment and management. Chapman-Hall, New York. https://doi.org/10.1007/978-1-4615-3598-0
Hoggarth, D.D., Abeyasekera, S., Arthur, R.I., Beddington, J.R., Burn, R.W., Halls, A.S., Kirkwood, G.P., McAllister, M., Medley, P., Mees, C.C., Parkes, G.B., Pilling, G.M., Wakeford, R.C. and Welcomme R.L., 2006. Stock assessment for fishery management. A framework guide to the stock assessment tools of the fisheries management science programme. FAO Fisheries Technical Paper No. 487, FAO’s fisheries department, Rome, Italy, pp. 1–261.
Hong, S.H., Yeon, I.J., Im, Y.J., Hwang, H.J., Ko, T.S. and Park, Y.C., 2000. Feeding habits of Okamejei kenojei in the Yellow Sea. Bull. Nat. Fish. Res. Dev. Inst. Korea., 58: 1–9.
Jensen, A.L., 2002. Maximum harvest of a fish population that has the smallest impact on population biomass. Fish. Res., 57: 89–91. https://doi.org/10.1016/S0165-7836(01)00337-X
Kitagawa, D. and Yamashita, Y., 1986. Occurrence and distribution of the Japanese sand eel, Ammodytes personatus, larvae in the coastal waters of Iwate prefecture. Nippon Suisan Gakki, 50: 205–213.
Li, B. and Jin, X., 2019. Spatio-temporal evolution of marine fishery industry ecosystem vulnerability in the Bohai rim region. Chin. Geogr. Sci., 29: 1052–1064. https://doi.org/10.1007/s11769-019-1076-5
Maunder, M.N., John, R.S., Fonteneau, A., Hampton, J., Kleiber, P. and Harley, S.J., 2006. Interpreting catch per unit effort data to assess the status of individual stocks and communities. ICES J. mar. Sci., 63: 1373–1385. https://doi.org/10.1016/j.icesjms.2006.05.008
Medley, P.A. and Ninnes, C.H., 1997. A recruitment index and population model for spiny lobster (Panulirus argus) using catch and effort data. Can. J. Fish. aquat. Sci., 54: 1414–1421. https://doi.org/10.1139/f97-027
Memon, A.M., Memon, K.H., Baloch, W.A., Memon, A., and Baset, A., 2015. Evaluation of the fishery status for King Soldier Bream Argyrops spinifer in Pakistan using the software CEDA and ASPIC. Chin. J. Oceanol. Limn., 33: 966–973. https://doi.org/10.1007/s00343-015-4330-4
Mohsin, M., Guilin, D., Zhou, C., Hengbin, Y. and Noman, M., 2019. Maximum sustainable yield estimates of Carangoides fishery resource in Pakistan and its bioeconomic implications. Pakistan J. Zool., 51: 279–287. https://doi.org/10.17582/journal.pjz/2019.51.1.279.287
Mohsin, M., Mu, Y., Memon, A.M., Kalhoro, M.T., and Shah, S.B.H., 2017. Fishery stock assessment of Kiddi shrimp (Parapenaeopsis stylifera) in the Northern Arabian sea coast of Pakistan by using surplus production models. Chin. J. Oceanol. Limn., 35: 936–946. https://doi.org/10.1007/s00343-017-6096-3
Musick, J.A., and Bonfil, R., 2005. Management techniques for elasmobranch fisheries. FAO Fisheries Technical Paper No. 474. FAO’s Fisheries Department, Rome, Italy, pp. 1–251.
Okamoto, H., Yamazaki, F. and Mishima, S., 1988. Genetic divergence among sandlance Ammodytes personatus population in Japan. Nippon Suisan Gakki, 54: 1297–1304. https://doi.org/10.2331/suisan.54.1297
Panhwar, S. K. and Liu, Q., 2013. Population statistics of the migratory hilsa shad, Tenualosa ilisha, in Sindh, Pakistan. J. appl. Ichthyol., 29: 1091–1096. https://doi.org/10.1111/jai.12134
Pella, J.J., and Tomlinson, P.K., 1969. A generalized stock production model. Int. Am. Trop. Tuna Comm. Bull., 13: 416–497.
Ren, G., Hu, J., Bao, Z., Jiang, X. and Gao, T., 2009. Isolation and characterization of eleven polymorphic microsatellite markers of sand lance (Ammodytes personatus). Conserv. Genet., 10: 1837-1839. https://doi.org/10.1007/s10592-009-9828-x
Ricker, W. E., 1975. Computation and interpretation of biological statistics of fish populations. Bull. Fish. Res. Bd. Can., 191: 1–382.
Rosenberg, A.A., M.J. Fogarty, Sissenwine, M.P., J.R. Beddington, and Shepherd J.G., 1993. Achieving sustainable use of renewable resources. Science, 262: 828-829. https://doi.org/10.1126/science.262.5135.828
Schaefer, M.B., 1954. Some aspects of the dynamics of populations important to the management of the commercial marine fisheries. Int. Am. Trop. Tuna Comm. Bull., 1: 23-56.
Sun, K., Zhou, X., Su, Z. and Zhang, H., 2016. Dynamic assessment and spatial differentiation of sustainable utilization of marine fishery resources in China. Sci. Geogr. Sin., 36: 1172–1179.
Sun, Y., Liu, Y., Liu, X. and Tang, O., 2010. The influence of particle size of dietary prey on food consumption and ecological conservation efficiency of young-of-the-year sand lance, Ammodytes personatus. Deep Sea Res. Part II Top. Stud. Oceanogr., 57: 1001-1005. https://doi.org/10.1016/j.dsr2.2010.02.011
Szuwalski, C.S., Jin, X., Shan, X., Clavelle, T., 2020. Marine seafood production via intense exploitation and cultivation in China: Costs, benefits, and risks. PLoS One, 15: 1–30. https://doi.org/10.1371/journal.pone.0227106
Tomiyama, M. and Yanagibashi, S., 2004. Effect of temperature, age class, and growth on induction of aestivation in Japanese sandeel (Ammodytes personatus) in Ise Bay, central Japan. Fish. Oceanog., 13: 81–90. https://doi.org/10.1046/j.1365-2419.2003.00272.x
Zhang, W., Liu, M., Sadovy de Mitcheson, Y., Cao, L., Leadbitter, D., Newton, R., Little. D.C., Li, S., Yang, Y., Chen, X. and Zhou W., 2020. Fishing for feed in China: Facts, impacts and implications. Fish Fish., 21: 47–62. https://doi.org/10.1111/faf.12414
To share on other social networks, click on any share button. What are these?


