

Expression Analysis of BMPR1B, BMP15, GDF9, Smad1, Smad5, and Smad9 in Rams with Different Fecundity


Expression Analysis of BMPR1B, BMP15, GDF9, Smad1, Smad5, and Smad9 in Rams with Different Fecundity
Weihao Chen1,2, Zhilong Tian2, Lin Ma2, Shangquan Gan3, Wei Sun1,4,* and Mingxing Chu2,*
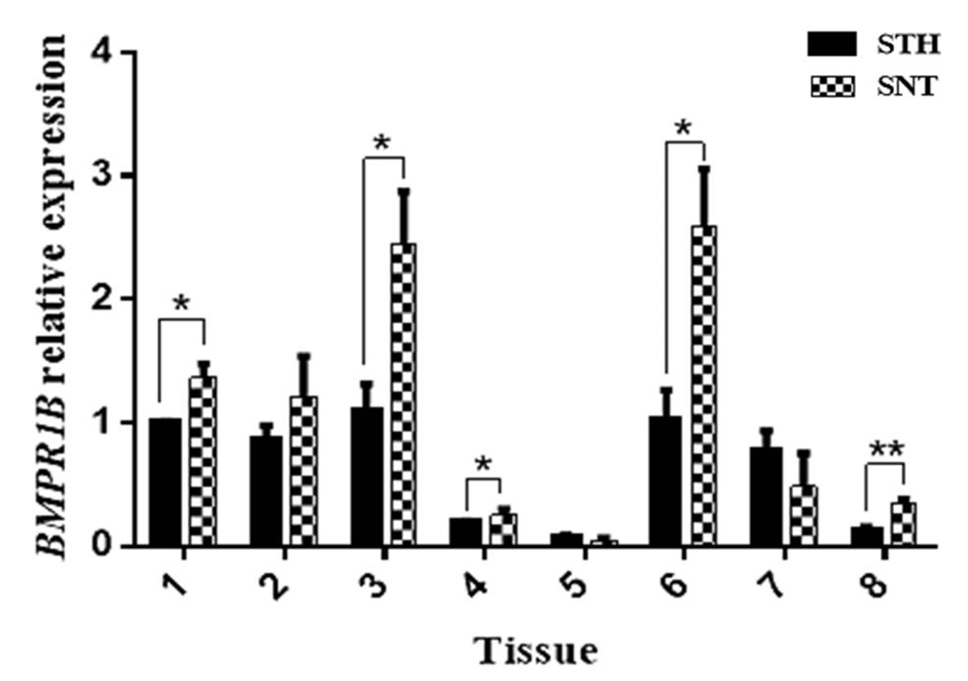
Comparison of the expression of BMPR1B in eight tissues (Tissues 1–8: brain, cerebellum, hypothalamus, pituitary, testis, epididymis, vas deferens, and adrenal gland, respectively) between Small Tail Han sheep (STH) and Sunnite sheep (SNT). Means with different superscripts are significantly different. The significant results with a p-values lower than 0.01 and 0.05 are given two asterisks (**) and one asterisk (*), respectively.

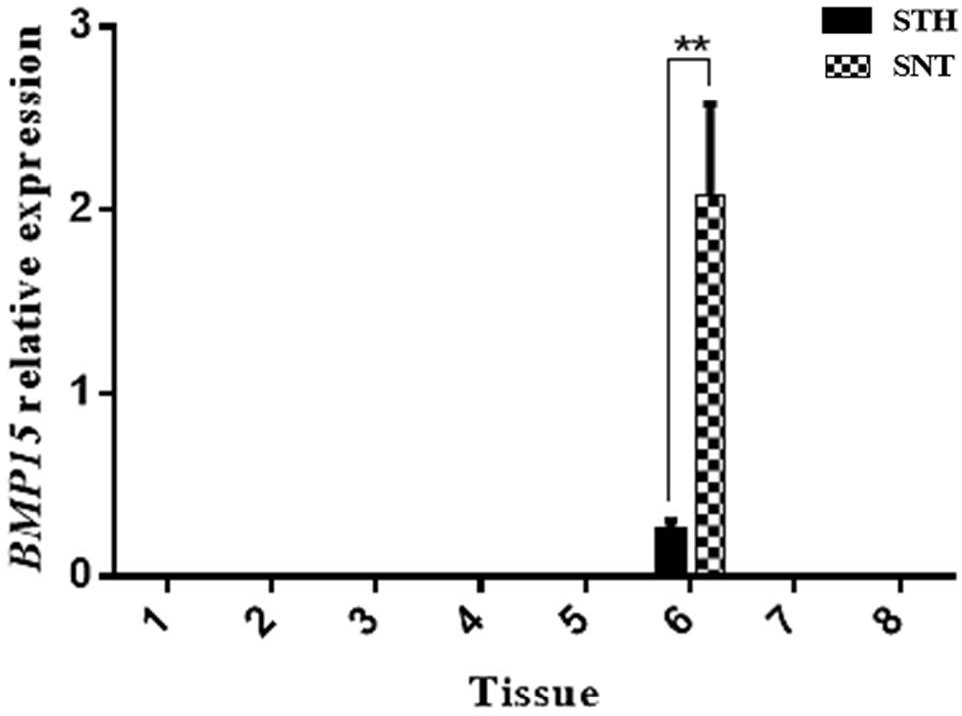
Comparison of the expression of BMP15 in eight tissues (Tissues 1–8: brain, cerebellum, hypothalamus, pituitary, testis, epididymis, vas deferens, and adrenal gland, respectively) between STH and SNT. Means with different superscripts are significantly different. The significant results with a p-values lower than 0.01 is given two asterisks (**).

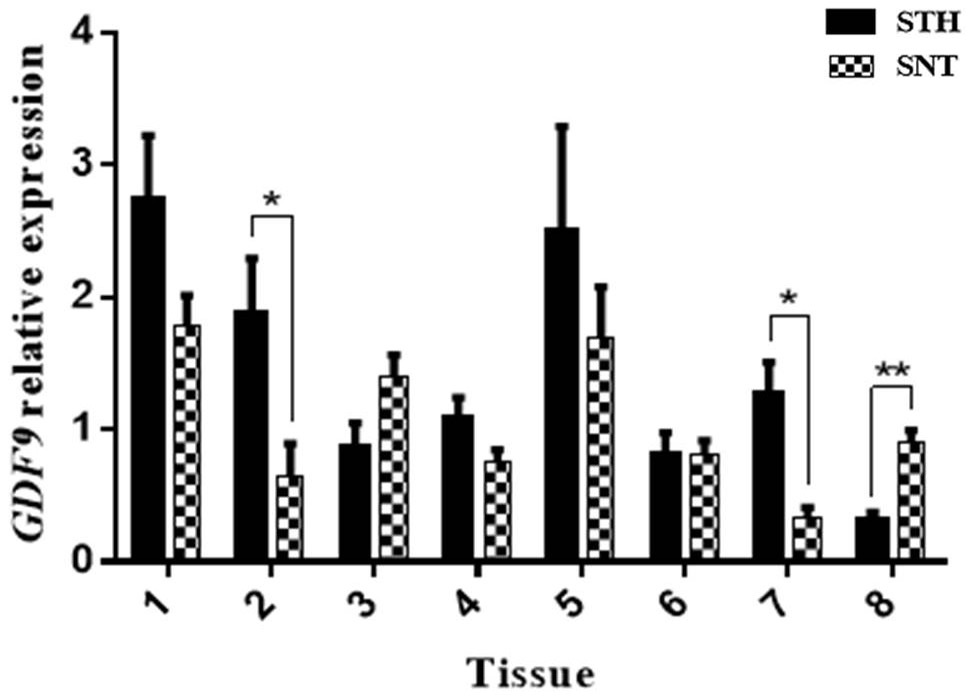
Comparison of the expression of GDF9 in eight tissues (Tissues 1–8: brain, cerebellum, hypothalamus, pituitary, testis, epididymis, vas deferens, and adrenal gland, respectively) between STH and SNT. Means with different superscripts are significantly different. The significant results with a p-values lower than 0.01 and 0.05 are given two asterisks (**) and one asterisk (*), respectively.
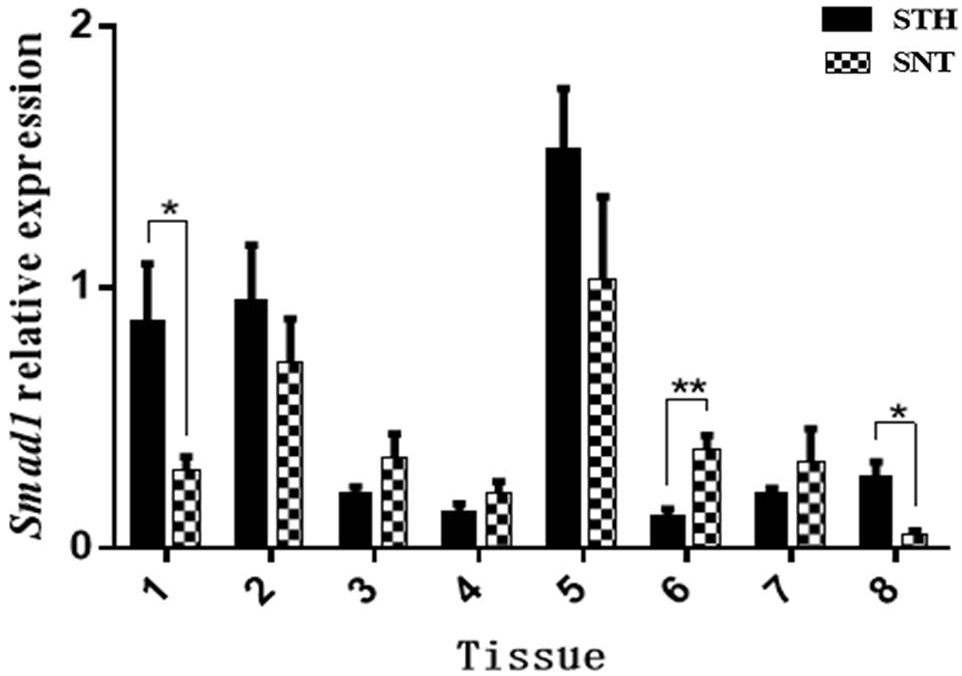
Comparison of the expression of Smad1 in eight tissues (Tissues 1–8: brain, cerebellum, hypothalamus, pituitary, testis, epididymis, vas deferens, and adrenal gland, respectively) between STH and SNT. Means with different superscripts are significantly different. The significant results with a p-values lower than 0.01 and 0.05 are given two asterisks (**) and one asterisk (*), respectively.

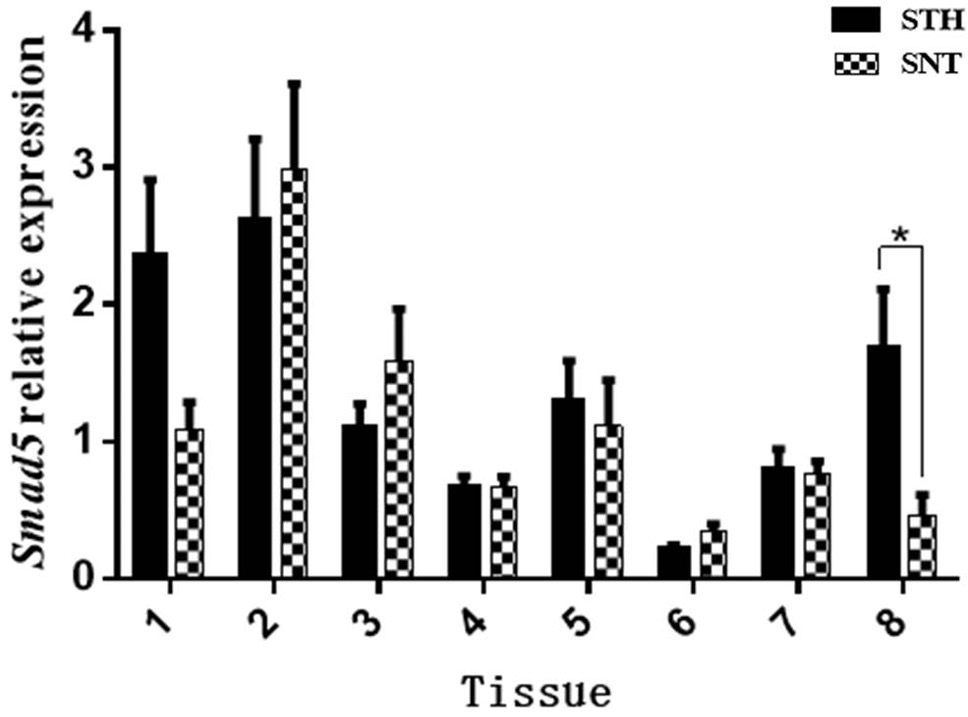
Comparison of the expression of Smad5 in eight tissues (Tissues 1–8: brain, cerebellum, hypothalamus, pituitary, testis, epididymis, vas deferens, and adrenal gland, respectively) between STH and SNT. Means with different superscripts are significantly different. The significant results with a p-values lower than 0.05 is given one asterisk (*).
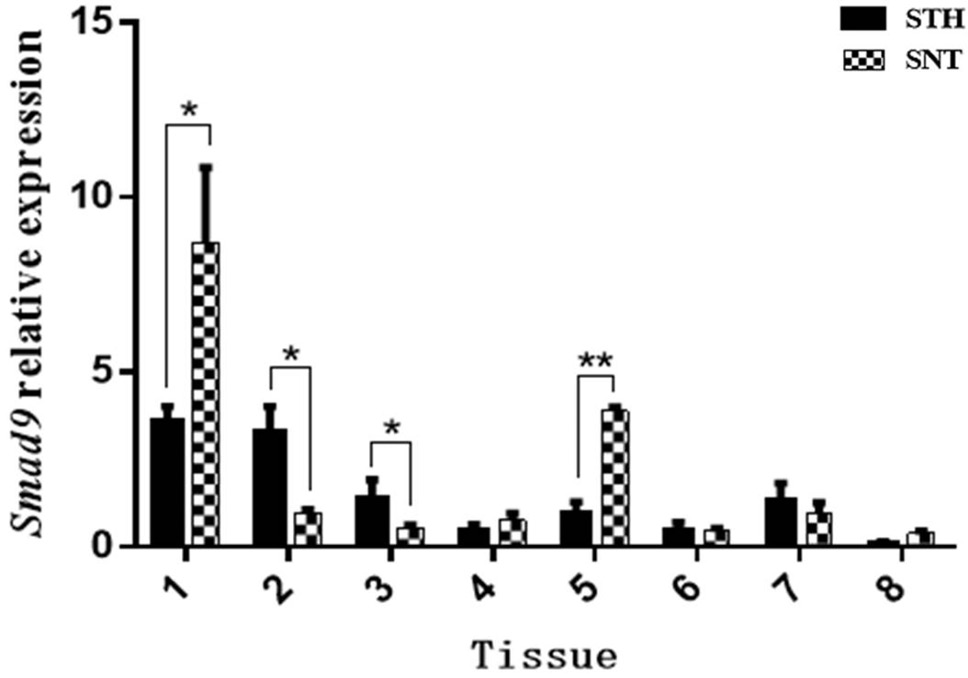
Comparison of the expression of Smad9 in eight tissues (Tissues 1–8: brain, cerebellum, hypothalamus, pituitary, testis, epididymis, vas deferens, and adrenal gland, respectively) between STH and SNT. Means with different superscripts are significantly different. The significant results with a p-values lower than 0.01 and 0.05 are given two asterisks (**) and one asterisk (*), respectively.


