
Allocative Efficiency of Tomato Growers in District Mardan, Khyber Pakhtunkhwa Province of Pakistan


Research Article
Allocative Efficiency of Tomato Growers in District Mardan, Khyber Pakhtunkhwa Province of Pakistan
Mehran Ahmad, Syed Attaullah Shah and Shahid Ali*
Department of Agricultural and Applied Economics, The University of Agriculture, Peshawar, Khyber Pakhtunkhwa, Pakistan.
Abstract | This study was carried out to identify major determinants that influence tomato yield and estimate allocative efficiency of tomato growers in district Mardan of Khyber Pakhtunkhwa province of Pakistan. The study was based on primary data, collected from a sample of 105 tomato growers selected through multistage random sampling procedure. Data was collected through a well-designed interview schedule during January-July, 2018. Cobb-Douglas type production function was used to estimate effect of important determinants on tomato yield. Results showed that the estimated coefficient of net farming (dummy) is 0.25; implies that tomato yield with net farming is 25 percent more than traditional production technology. DAP, Nitrate and Urea, labor and FYM had positive significant effects on tomato yield. Estimated allocative efficiencies of DAP, Nitrate and FYM, were greater than 1, indicating that growers were underutilizing these inputs. This might be due to growers’ lack of knowledge or budget constraint. Nitrophous and chemicals were over utilized as their allocative efficiencies were less than 1. The study recommends that government may provide subsidized inputs and interest free production credit to poor farmers for purchase of chemical fertilizers for optimal utilization of these inputs.
Received | January 10, 2019; Accepted | May 22, 2019; Published | June 19, 2019
*Correspondence | Shahid Ali, Assistant Professor, Department of Agricultural and Applied Economics, The University of Agriculture, Peshawar, Khyber Pakhtunkhwa, Pakistan; Email: drshahid@aup.edu.pk
Citation | Ahmad, M., S.A. Shah and S. Ali. 2019. Allocative efficiency of tomato growers in district Mardan, Khyber Pakhtunkhwa Province of Pakistan. Sarhad Journal of Agriculture, 35(3): 675-685.
DOI | http://dx.doi.org/10.17582/journal.sja/2019/35.3.675.685
Keywords | Tomato growers, Allocative efficiency, Cobb-Douglas type production function, Khyber Pakhtunkhwa, Pakistan
Introduction
Pakistan is blessed with a lot of agricultural resources on behalf of its fertile land, well-irrigated plains, irrigation system and extremes of weather. Being an agrarian country, agriculture contributes 18.9 percent to the Gross Domestic Product (GDP) and employs almost 42.3 percent of the total labor force. In rural areas almost, 68 percent people are involved in agriculture directly or indirectly through production, processing and exchange of both minor and major agricultural goods as it is the main source of living and a mean of support for them, fulfilling the food requirements of the entire population and providing materials in raw form to industries (GoP, 2018).
The agro-climatic conditions and fertile lands in Pakistan are very much suitable for the cultivation of cereal crops as well as vegetables production. Among the major vegetables grown in Pakistan, Tomato (Lycopersicon esculentum) is a vegetable of major importance and grown as a cash crop all over the world. Being a short duration crop and of its high economic value, it is preferred by most of the farmers. It is consumed widely in meat, rice and cooked with other vegetables or used as salad etc. It can also be used in processed form for making ketchup, juices and chutney. It possesses 90% water and is pretty rich in sugars, vitamins, essential minerals and amino acids. It is also used in many medicines as it comprises of antioxidants such as carotenoids and other phenolic compounds, curing cancer and heart diseases (Adalid et al., 2004).
Global fresh tomatoes production was about 177.04 million tones and was cultivated on an area of 4.7 million hectares in year 2016 (FAO, 2016). The average yield per hectare recorded that year was 37.01 million tones. China was the leading tomato producer with the production of 56.4 million tones on an area of 1 million hectare, followed by India, U.S.A, Turkey, and Egypt. Pakistan was ranked as 35th largest tomato producer country in the world (FAO, 2016).
In Pakistan tomato is cultivated in all provinces in both the spring and autumn seasons. In Pakistan tomato was cultivated on an area of 63.20 thousand hectares and total production was recorded as 601.098 thousand tones during 2017. The mean tomato yields that year was recorded as 9510.60 kilograms/hectare (FAO, 2017). Baluchistan was the largest tomato producing province in the country with the production of 200 thousand tones on an area of 27 thousand hectares, followed by Sindh, Khyber Pakhtunkhwa and Punjab (GoP, 2016).
Agriculture land in district Mardan is well fertile and quite conducive for vegetables farming. Most of the farmers grow vegetables like potato, lady finger, bitter guard and tomato etc. In Mardan tomato was cultivated on area of 339 hectares and total production recorded was 4,431 tones (GoKP, 2014). The average yield of tomato in district Mardan was 13.07 tons per hectare which is comparatively low than other districts. Production level and yield of tomato can be increased by improving the allocative efficiency of tomato growers in the study area.
Allocative efficiency is the ability of farmers to equate marginal products of resources with their prices (cost minimization behavior) (Farrell, 1957). Increase in tomato yield will not only fulfill the increasing demand of the current time but will also ensure higher profit for the farming community. As the persistent increase in inflation affected cost of production and profitability of the tomato producers badly, threatening the survival of farming community; an idea arises to conduct a comprehensive study to estimate net revenue, allocative efficiency and factors affecting profitability of tomato producers in the study area.
Tomato being a cash crop is a major source of income for the farmers. As allocative efficiency provides an accurate idea about the farmers’ performances and most of the farmers in the study area grow tomatoes, therefore this study is an attempt to analyze whether tomato producers in the study area are allocatively efficient or not. The main objectives of this study are to estimate and examine the effect of important determinants on tomato yield and allocative efficiency of tomato growers in the study area.
Review of literature
In literature review different researcher has carried out study about the theme of the topic and to know about the background of research. It gives the idea about the issue on which many researchers worked on a particular matter in Pakistan and other countries.so this section mostly focus on the relevant literature which are to be reviewed.
Donkoh et al. (2008) conducted a research study to analyze the technical efficiency of tomato growers in Northern Ghana. Primary data from 105 randomly selected farmers was collected through interview. The results estimated the average technical efficiency as 0.93, showing that output can be increased by 7% with existing technology. Variables like farmers’ education and level of experience were statistically significant to technical efficiency.
Murthy et al. (2009) analyzed the technical efficiency of tomato producers in Karnataka, India, using primary data. The study revealed that the small tomato producers were price efficient, medium age producers were technically efficient due to low cost of production. Moreover, the most of the large farmers were technically inefficient. Farmers were unable to use modern technology they use that technology which was available at that time so the consequences were less production of tomato and inefficiency. The farmers who use innovative technology they have increasing return to scale and achieve high productivity.
Khan (2012) estimated technical, allocative and economic efficiencies of tomato growers in Nowshera, Khyber Pakhtunkhwa. Data were collected from 61 tomato farmers using a multistage sampling technique. It was determined that respondents’ education, frequency of extension visits; age of respondents and their access to credit were significant and positively increased their level of efficiencies. Research estimated 65% and 56% technical and allocative efficiencies.
The study recommended government to strengthen extension services and education services to enhance production.
Tosho et al. (2012) examined factors affecting allocative, technical and economic efficiencies of vegetables’ producers in Sokoto state, Nigeria. Data were primarily collected from 155 farmers randomly selected through a multistage sampling. Results revealed that farm location, frequency of extension visits, cropping pattern and irrigation were significantly effective in allocative, technical and economic efficiencies.
Khan and Ghafar (2013) determined the mean technical efficiency of tomato producers in Peshawar, Khyber Pakhtunkhwa. Technical efficiency was achieved by 92% of farmers and showed increasing return to scale. Age and experience showed inefficiency in tomato production.
Usman and Bakari (2013) analyzed productivity of tomato growers in Adamawa state, Nigeria. A multistage sampling technique was used to collect data from 200 respondents in the study area. The study revealed that the mean allocative and technical efficiencies estimated were 0.81 and 0.72 respectively. The result showed that technical efficiency was affected significantly by extension contact, family size, education level and farming experience while credit availability, extension contact, farmers’ age and education level were the major determinants affecting allocative efficiency.
Maniriho et al. (2015) examined the allocative efficiency of tenants in northern Rwanda, in district Musanze. Data were collected from 107 farmers in study area. Results indicated that increase in fertilizer and other inputs like seed, labors etc. will lead to increase in production of agriculture. This research illustrated that Total Factor Productivity (TFP) was 1.47. The estimated average APP was 1.06 kilograms and the estimated average marginal physical product (MPP) for inputs of seeds, fertilizer and labor were 3.18, 0.27 and 14.96 in kgs respectively.
The reviewed literature showed that both the Stochastic Frontier Production function and price efficiency approaches were used to analyze the allocative efficiency of the farmers. Most of the researchers used robust ordinary least square method instead of tobit regression because it is a consistent estimator and is unbiased.
Methods and Materials
Study area
This study was carried out in District Mardan of KP, occupying an area of 1,632 square kilometers. The district is situated at 34.20 degree to the North and 72.02 degree to the South (Figure 1). According to 2017 census, the total population of Mardan was recorded as 2,373,061. The climatic conditions of district Mardan are very conducive for agriculture.
Sampling design and sample size
The data required for estimating the allocative efficiency of tomato growers in Mardan district were collected through a multistage sampling technique.
In fist stage out of three tehsils, tehsil Mardan was chosen randomly. In second stage out of 60 rural union councils in tehsil Mardan, 3 union councils namely Sawaldher, Chamdheri, Chargulli were selected randomly. In third stage a sample of 105 tomato farmers was chosen using Yamane formula (Yamane, 1967) as under:
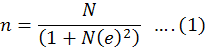
Where;
n = sample size for tomato growers; N = total number of tomato growers in the selected villages; e = precision level; In final stage from selected union councils 105 tomato farmers were randomly selected using proportional allocative sampling technique (Cochran, 1977) as follows:
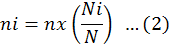
Where;
ni= Tomato growers to be selected from ith village; n= Total sample size for tomato growers; Ni= Total growers in ith village; N= Total tomato growers in the selected villages; i= Number of villages randomly selected.
Analysis
Cost of production, total revenue and net revenue of tomato growers were estimated using the following formula (Varian, 1992; Debertin, 2012).
Cost of production
Total cost of tomato production is the sum total of nursery raising cost, on farm tomato raising cost and marketing cost.
Total tomato cost = Nursery raising cost + tomato raising on farm cost + marketing cost … (1)
Total revenue
The money which is received by the growers from selling their produce is called total revenue. Tomato growers’ total revenue per acre of land was derived by multiplying quantity produced per acre (Q) with per unit mark price (PQ).
TR = PQ × Q … (2)
Net revenue
Net revenue per acre of tomato crop was calculated by subtracting total cost per acre from total revenue per acre of tomato crop.
NR = TR – TC … (3)
Theoretical framework
Farrell (1957) defined allocative efficiency as the ability of farmers to equate marginal products of resources with their prices (cost minimization behavior). According to Farrell (1957) those farmers were allocatively inefficient who were unable to equate the output and input ratio. Lau and Yotopolous (1971); Schmidt and Lovell (1979), Kopp and Diewert (1982) and Zieschang et al. (1983) defined an alternative approach of farmer’s profit maximization and stated allocative efficiency as an achievement to equate the value marginal product (MVP) to the inputs’ prices.
Byerlee (1987) recommended that allocative efficiency should be divided for policy purposes into two cases. The constrained case, where allocative gains are achieved by reallocating resources within a constant level of cost and the unconstrained case, where allocative efficiency is achieved by reaching a point on expansion path where the marginal return becomes equal to the marginal cost. According to him the allocative inefficiency in constrained case mostly arises due to lake of skills and information while in unconstrained case it arises due to financial constraints, market flaws, risk aversion and farmer’s non-relevant goals.
Allocative efficiency is actually the selection of appropriate combination of inputs in a production process (Farrell, 1957) (Figure 2).
Source: Adopted from Byerlee (1987).
Figure 2 shows a combination of two inputs, land and labor to produce a homogenous product. An iso-quant of YY’ represents output whereas the iso-cost curve is represented by II’. Firms lying anywhere on production possibility curve are technically efficient but all the firms on curve are not allocatively efficient. The only firm lying on point ‘Q’ is allocatively efficient because at this point the iso-cost curve is tangent to iso-quant and thus MVP becomes equal to the MFC. The figure further reveals that an allocatively efficient firm is technically efficient but all the technically efficient firms are not allocatively efficient. Mathematically allocative efficiency can be written as:

Allocative efficiency of value 1 reveals that farmers are 100% allocatively efficient. A. E of value less than 1 represents that inputs have been over-utilized and A.E exceeding 1 represents that inputs have been under-utilized by farmers. Allocative efficiency can either be determined by production function or linear programming technique. The basic question here is that what type of production function is suitable to measure the efficiency level of farmers. Most of the studies used a Cobb-Douglas type production function due to its simplicity, computational feasibility and adequate fitness. As Cobb-Douglas production function results better estimates of the parameters of input and output relationship, the model will be used in this study.
Empirical model
Cobb-Douglas type production function was used to identify the major determinants of tomato yield and allocative efficiency of the sampled respondents. The same model was used by Bashir and Dilawar (2005), Ebiowe et al. (2013), Puozaa (2015), Gebretsadik (2017), Muhammad et al. (2017) and Ali et al. (2018). The following specified form of the Cobb-Douglas type production function was used for estimation of effects of determinants on tomato yield.

Where;
Ln is log, Y is tomato yield in kilograms per acre,β`s are the coefficients to be estimated, Labor hrs are the labor working hours per acre, Irrigation is the number of irrigations per acre, Chemicals represents the application of pesticides and weedicides in bottles per acre (1 bottle = 500 ml), DAP is the amount of DAP used in kg per acre, Nitrate is the amount of Nitrate used in kg per acre, Urea is the amount of Urea in kg per acre, Nitro-phas is the amount of Nitro-phas used in kg per acre, FYM is the amount of FYM in trolleys per acre, Netfarming is the dummy variable (1 for farms where net was used, 0 otherwise) and ei is the error term.
Estimation of allocative efficiencies
Estimated coefficients from Cobb-Douglas type production function and average utilized levels of important inputs, their average physical product (APPxi) and marginal physical products (MPPxi) were estimated. Further, using the average market price of tomato produce and estimated MPPxi, the inputs value marginal products (VMPxi) were calculated. Following Bashir and Khan (2005), Ebiowei et al. (2013), Pouzaa (2015), Gebretsadik (2017) and Muhammad et al. (2017) allocative efficiency for each input was estimated by dividing its VMPxi by MFCxi as under:
Allocative efficiency = AExi = VMPxi / Pxi …. (6)
Pxi = MFCxi = per unit input cost … (7)
VMPxi = MPPxi × Py … (8)
Where;
VMPxi is the value of marginal product from ith input and Py is the price per unit output.
Results and Discussion
This chapter deals with results farm data analysis of the study. It starts with the socio-economic characteristics of the tomato growers in study area, then present results for cost and benefit analysis for tomato crop and finally discuss determinants of yield. Results for post estimation diagnosis tests and allocative efficiency analyses were discussed at the end of this chapter.
Socio-economic characteristics of tomato growers
Socio-economic characteristics of the sampled farmers that play an important role in the production are discussed in detail (Table 1). These characteristics include age, level of education, farming experience and farm size of the sampled respondents. The results showed that the mean age of the sampled farmers estimated in study area was 44.44 years with the maximum, minimum and standard deviation of 87, 22 and 10.75 years respectively. The mean education level of the sampled farmers in study area was 6.03 years with the maximum, minimum and standard deviation of 14, 0 and 4.65 years respectively. The mean farm size of the sampled respondents in the study area was recorded as 3.96 acres with the maximum, minimum and standard deviation of 10, 1 and 1.76 acres respectively. The average level of farming experience in the study area was 23.94 years with the maximum, minimum and standard deviation of 60, 4 and 9.93 years, respectively.
Table 1: Socio-economic characteristics of tomato growers.
| Particulars | Mean | Std. Dev. | Minimum | Maximum |
| Age (Years) | 44.44 | 10.75 | 22 | 87 |
| Education (Years) | 6.03 | 4.65 | 0 | 14 |
| Experience (Years) | 23.94 | 9.93 | 4 | 60 |
| Farm Size (Acres) | 3.96 | 1.76 | 1 | 10 |
Source: Survey data, 2018.
Budget summary of tomato production
This section we discuss the cost and revenue from tomato crops. The total cost is expanded as variable cost and fixed cost. Both the variable and fixed costs are used in the estimation of production cost of tomato. These fixed and variables inputs costs are discussed below in the production cost.
Production cost
Based on the entire production process, the production cost can be divided into nursery raising cost and the main crop cost. The cost incurred on nursery growing is given below in detail.
Nursery raising cost
The most important and very initial stage of growing tomato crop is the nursery rising, and the first step of nursery rising is the preparation of seed bed for it. After seed bed being prepared, seeds are sown in it, and water for irrigation and pesticides are used by expert labor at required stages. Thus, the nursery raising costs include land preparation cost, seed cost, fertilizers cost, pesticides cost, irrigation cost and the labor cost. On average, nursery raising cost was Rs. 14,723.32 per acre as shown in Table 2.
Table 2: Nursery raising cost (per acre).
| Items | Units | Quantity | Cost/unit (Rs) | Total cost (Rs) | %age |
| Seeds | Packets | 4.00 | 3011.00 | 12045.71 | 81.81% |
| Fertilizers | Kgs | 5.11 | 60.00 | 609.04 | 4.13% |
| Chemicals | Bottles | 0.46 | 400.00 | 184.76 | 1.25% |
| Labor | Days | 2.327 | 500.00 | 1163.81 | 8.90% |
| Irrigation | No. | 9.00 | 80.00 | 720.00 | 4.89% |
| Total nursery cost | Rs | 14723.325 | 100% |
Source: Survey data 2018.
Seed cost
Seed and its cost play a vital role in the production of a crop. The average cost of tomato seeds for raising nursery was Rs. 12045.71 and it shared 81.81 percent in the total nursery cost. Almost all the sampled tomato growers used certified and good quality seeds and that was a reason for impressive production in the study area.
Fertilizers cost
Chemical fertilizers are important input in raising nursery for tomato crop. Fertilizers provide vital minerals and elements to crops which deficient in soil, and thus play important role in crops production. Most of the growers used FYM, DAP and Urea fertilizers in raising nursery for tomato crops. The average cost incurred on these fertilizers was Rs. 609 and its share was 4.13 percent of the total nursery cost.
Irrigation cost
Irrigation is very important for any crop; it provides water for seed germination and seedlings growth. The average irrigation cost in nursery rising was Rs. 720 and its share was 4.89 percent in the total cost.
Chemicals cost
Different types of pesticides and herbicides are applied on tomato nursery. The average cost of those chemicals was Rs. 184.76 and its share was 1.25 percent of the total nursery raising cost.
Labor cost
Labor is considered a main factor in the process of nursery rising. Labor is used for seed bed preparation, irrigation, fertilizers and chemicals applications. The average labor cost on nursery rising was Rs. 1163.81 and it share was 8.90 percent in the total cost.
Average cost of production on farm
Average cost of tomato production on farm is depicted in Table 3. The raising of main tomato crop includes costs on land preparation, chemical fertilizers, FYM, chemicals (pesticides and herbicides), irrigation and labors. Results from data analysis revealed that the average total cost incurred on main tomato crop was Rs. 114, 009.
Table 3: Average cost of production on farm (per Acre).
| Items | Units | Quantity | Cost/unit (Rs) | Total cost (Rs) | %age |
| Tractor | Hours | 2.01 | 1000.00 | 2010.00 | 2.63% |
| FYM | Trolley | 1.40 | 3000.00 | 4200.00 | 5.51% |
| Fertilizers | Kg | 314.74 | 38 .46 | 12104.90 | 15.88% |
| Irrigation | No. | 7.67 | - | 400.00 | 0.52% |
| Chemicals | Bottles | 25.41 | 414.28 | 10526.85 | 13.81% |
| Labor | Hours | 365.33 | 70.00 | 25573.10 | 33.55% |
| Land rent | Rs | - | - | 21395.24 | 28.07% |
| Total Cost | Rs. | 76210.09 | 100% |
Source: Survey data 2018.
Land preparation cost
Land preparation is very important for crops production because it increases soil fertility and capacity to provide nutrients essential for crops growth. The cost that was incurred on land preparation for tomato crop arises from ploughing, leveling and furrows making. The average land preparation cost for main tomato crops was Rs. 2010, which is 2.63 percent of the total production cost.
Fertilizers cost
Most of the sampled growers used DAP, Nitrate, Urea, and Nitro-pas for main tomato crop. The total average fertilizer cost was Rs. 12104.90 and its share was 15.88 percent in the total cost for main tomato crop.
Irrigation cost
It was observed that almost all the sampled growers used canal-water irrigation for tomato crops. The irrigation department fixed rate for tomato crop was Rs. 400 per acre, and its share in total cost on main crop was only 0.52 percent.
Table 4: Marketing cost (per acre).
| Items | Units | Quantity | Cost/unit (Rs) | Total cost (Rs) | %age |
| Packaging and carets charges | Crates | 111.80 | 40 | 4472 | 31.74% |
| Transportation, Loading, and unloading charges | Trip | 9.54 | 1007.78 | 9614.22 | 68.25% |
| Total marketing cost | Rs | 14,086.22 | 100 |
Source: Survey Data 2018.
Chemicals
Different types of chemical are applied on main tomato crops in the study area. Pesticides chemical are used for pest control and herbicides are used for herbs and shrubs control in field. The average per acre cost of chemicals was Rs. 10502.86 and its share was 13.81 percent in total cost on main tomato crop.
Labor cost
Tomato is a labor-intensive crop as it needs labor in all stages of production, such as nursery raising, transplanting crop to the field, fertilizers and chemicals application, irrigation, harvesting and packaging. The average labor cost on main tomato crop was Rs. 25573.1 and its share was 33.55 percent in the total cost on main crop.
Land rent
Cost of land utilized for crop production is taken as a fixed cost in production process. For growers utilizing their own land for tomato production, land rent is taken as their opportunity cost. The average land rent in the study area was Rs. 21395.24, making 28.07 percent to the total cost on main crop.
Marketing cost
Marketing cost of tomato produce is presented in Table 4. Marketing cost includes the costs for transportation, loading and unloading, packing and empty bags or crates. The total average marketing cost for tomatoes produced on one acre was Rs. 14,086.22 and its share was 9.34 percent in total cost on main tomato crop.
Grand total cost of tomato production
The total production cost of tomato crop is the sum of nursery raising cost, total main crop cost and marketing cost. The total average nursery raising cost for one acre was Rs. 14,723.32, on average total tomato raising cost was Rs. 76,210.09 per acre and total average marketing cost was Rs. 14,086.22 per acre. Grand total cost was Rs. 105,019.63 per acre.
Net revenue
Table 5 presents total revenue, total cost and net revenue from tomato crop. Total revenue from sale of tomato was Rs.198166.5 per acre, grand total cost of tomato production was Rs. 105,019.63 per acre and net revenue was calculated as Rs. 93146.87 per acre.
Table 5: Net revenue (per acre).
| Particulars | Quantity (kg/acre) | Price (Rs/kg) | Value (Rs/acre) |
| I. Total Revenue | 7,926.66 | 25 | 198,166.5 |
| II. Total Nursery Cost | 14,723.32 | ||
| III. Total cost on main crop | 76,210.09 | ||
| IV. Total marketing cost | 14,086.22 | ||
| V. Grand total cost (II+III+IV) | 105,019.63 | ||
| VI. Net Revenue (I-V) | 93,146.87 |
Source: Survey data, 2018.
Table 6: Results of estimated production function.
| Variables | Coefficients | Std. errors | t-ratios | P-values |
| Constant | 7.39794 | 0.2423527 |
30.53** |
0.000 |
| Labor hrs | 0.1121484 | 0.0500374 |
2.24* |
0.027 |
| Irrigation | 0.07948 | 0.0522526 |
1.52ns |
0.132 |
| Pesticides/Herbicides | 0.026805 | 0.046319 |
0.58ns |
0.564 |
| DAP | 0.095803 | 0.0270038 |
3.55** |
0.001 |
| Nitrate | 0.006958 | 0.0020832 |
3.45** |
0.002 |
| Urea | 0.009988 | 0.0043268 |
2.29* |
0.04 |
| Nitro-phas | 0.0024226 | 0.0050918 |
0.48ns |
0.635 |
| FYM | 0.0443717 | 0.0146083 |
3.04** |
0.003 |
| Net farming (Dummy) | 0.2531316 | 0.211742 |
11.95** |
0.000 |
|
R2 |
0.914 | |||
Source: Survey Data, 2018.
Results of estimated production function
Table 6 portrays estimates of Cobb-Douglas type production function for tomato yield. Estimated results show that net farming, labor hours, DAP, Urea, Nitrate fertilizers and FYM have statistically positive significant effects on tomato yield. The sum of all the estimated coefficients is 0.71, which indicates that return to scale for tomato production is less than 1. Results of DAP, urea, labor hours are in line with the findings of Muhammad et al. (2017) and Puozza (2015).
Table 7: Estimated allocative efficiencies.
| Variables (1) | Coeff.(2) |
APPxi (3) |
MPPxi (4) |
P y (5) |
VMPxi (6) |
MFCxi (7) |
A.Exi (8) |
| Labor Hrs | 0.1121484 | 22.76 | 2.55 | 25.00 | 63.81 | 70 | 0.91 (≈1) |
| Pesticides | 0.026805 | 311.95 | 8.36 | 25.00 | 209.04 | 400 | 0.52 |
| Urea | 0.009988 | 95.95 | 0.95 | 25.00 | 24.00 | 24 | 1.00 |
| DAP | 0.095803 | 77.42 | 7.41 | 25.00 | 185.43 | 60 | 3.09 |
| Nitro-phas | 0.0024226 | 87.61 | 0.21 | 25.00 | 5.30 | 40 | 0.13 |
| Nitrate | 0.006958 | 252.28 | 1.75 | 25.00 | 43.88 | 13.58 | 1.82 |
| FYM | 0.044372 | 4150.08 | 184.14 | 25.00 | 4603.65 | 3000 | 1.53 |
Source: Survey data, 2018.
The coefficient value for net production technology is 0.25 which indicated the yield of tomato growers with net-technology is 25 percent more than tradition technology. Chemical Fertilizers-DAP, Urea and Nitrate-have positive and significant coefficients. An increase of 1 percent in DAP, Urea and Nitrate increase tomato yield by 0.09, 0.006 and 0.009 percent, respectively. FYM being the natural source of fertilizer is significant, taking a positive coefficient of 0.04, which indicates that a 1 percent change in FYM would increase tomato yield by 0.04 percent. The same results were obtained by Fatima et al. (2017).
Variables like irrigation, Nitro-Phas fertilizer and chemicals were statistically insignificant. The result of irrigation is in correspondence with Bashir and Khan (2005).
The estimated coefficient of determination was 0.914; implies that 91.4% of variation in tomato yield has been explained by variation in explanatory variables included in model. This value confirms that the model is good fit to the data.
Estimated allocative efficiencies
Table 7, column 8, shows that tomato growers were allocatively efficient in utilization of urea and labors. The allocative efficiencies for DAP, Nitrate and FYM were 3.09, 1.82 and 1.53, respectively, which revealed that these inputs were underutilized. This might be due to lack of farming experience in tomato production or budget constraint. Inputs, like Nitro-phas and chemicals were over utilized as their allocative efficiencies were estimated 0.13 and 0.52, respectively. Farmers in the study area would be allocatively efficient if they increase the use of DAP, Nitrate and FYM till their MFCs become equal to respective VMPs.
Conclusions and Recommendations
This study was carried out to estimate and examine allocative efficiency of tomato growers in district Mardan. The results from regression analysis of the primary data collected from tomato growers revealed that net production technology, labor, DAP, Urea, Nitrate and FYM were the important determinants of tomato yield in the study area. Allocative efficiency analysis shows that tomato growers were efficiently utilizing urea and labors. DAP, Nitrate and FYM, though important determinants of tomato yield, were underutilized. This might be due to lack of farming experience in tomato production or budget constraint. Inputs, like Nitro-phas and chemicals were over utilized.
Government should provide DAP on subsidized rates to tomato growers to avoid underutilization of this important input. Farmers need to be facilitated short term credit on low interest rates and easy installments. Extension department should arrange seasonal trainings for farmers to educate them on optimal utilization of inputs. This study was limited to district Mardan; therefore, findings of this study should be carefully extended to other districts of the province. As prices of tomato are fluctuating very frequently, therefore policy makers need to devise policy for tomato keeping in view these facts.
Novelty Statement
In this study, allocative efficiency analysis are based on estimated from Cobb-Douglas type of production function, which, theoretically provides more sound results as compared to results derived from widely used simple linear production function.
Author’s Contribution
Mehran Ahmad conducted this study, searched for literature and wrote first draft of the manuscript. Dr. Syed Attaullah Shah supervised this study and helped in model specification and statistical analysis. Dr. Shahid Ali helped in technical writing, interpretation and comparison of results, editing of manuscript, incorporated and corrected references.
References
Adalid, A.M., S. Roselló, and F. Nuez. 2004. Breeding tomatoes for their high nutritional value. Recent Res. Dev. Plant Sci. 11: 33-52.
Adenuga, A.H., A. Muhammad and O.A. Rotimi. 2013. Economics and technical efficiency of dry season tomato production in selected areas in Kwara State, Nigeria. Department of agricultural economics and farm management, university of Ilorin, Nigeria. Agris. Papers Econ. Inf. 5(1): 1-9.
Ali. A., R. Shrestha, G. Ali, I. Ullah and S. Khan. 2018. Net return and allocative efficiency of sugarcane production in district D.I. Khan, Khyber Pakhtunkhwa. Sarhad J. Agric. 34(2): 276-281. https://doi.org/10.17582/journal.sja/2018/34.2.276.281
Bashir, M. and D. Khan. 2005. An analysis of allocative efficiency of wheat growers in northern Pakistan. Pak. Dev. Rev. 44(4): 643–657. https://doi.org/10.30541/v44i4IIpp.643-657
Byerlee, D. 1987. The political economy of third world food imports. The case of wheat: Econ. Dev. Cult. Change. 35(2): 307-28. https://doi.org/10.1086/451587
Cochran, W.G. 1977. Sampling techniques, 3rd Edition. John Wiley and Sons, New York. pp. 37–45.
Debertin, D.L. 2012. Agriculture production economics, 2nd Edition. Macmillan publishing company, New York.
Donkoh, S.A., M. Tachega and N. Amowine. 2008. Technical efficiency of tomato production: The case of Irrigation Company of Upper Region (ICOUR) in the Kasena Nankana district of Northern Ghana. Dep. Agric. Resour. Econ., Facul. Agric. Univ. Dev. Stud. Tamale, Ghana.
Ebiowei1, K.P, O.E. Chukwuemeka and N.N. Jackson. 2013. Allocative efficiency and resource use in banana (Musa sapientum) and plantain (Musa paradisiaca) production enterprises in Bayelsa state, Nigeria. J. Exp. Biol. Agric. 1(5): 360-366. http://www.jebas.org
FAO, 2016. Countries tomato statistics. http://www.fao.org/faostat/en/#data/QC
FAO, 2017. Year wise world tomato statistics. http://www.fao.org/faostat/en/#data/QC
Farrell, M.J. 1957. The measurement of productive efficiency. J. R. Stat. Soc. 120(3): 252-281. https://doi.org/10.2307/2343100
Fatima, H., L. Almas and B. Yasmin. 2017. Allocative efficiency and profitability analysis of high-tech cotton-melon multiple cropping system in Punjab, Pakistan: Sarhad J. Agric. 33(1): 117-126. https://doi.org/10.17582/journal.sja/2017.33.1.117.126
Gebretsadik, D. 2017. Technical, allocative and economic efficiencies and sources of inefficiencies among large-scale sesame producers in Kafta Humera District, Western Zone of Tigray, Ethiopia: Non-parametric approach Int. J. Sci. Eng. Res. 8(6): 2041-2061.
GoKP. 2014. Fruits, vegetables and condiment statistics Khyber Pakhtunkhwa. Crop Rep. Ser. Agric. Lives. Coop. Dep. Peshawar.
GoKP. 2016. Development statistics of Khyber Pakhtunkhwa. Plann. Dev. Dep. KPK.
GoP. 2016. Pakistan statistical year book 2015-16. Ministry of statistics, Pak. Bur. Stat. Islamabad, Pak.
GoP. 2018. Economics survey of Pakistan, 2017-18. Economic advisory wing, finance division, Islamabad, Pakistan.
Khan, H. 2012. Measurement of technical, allocative and economic efficiency of tomato farms in northern Pakistan. J. Agric. Sci. Technol. 2: 1080-1090.
Khan, R.E.A. and S. Ghafar. 2013. Technical efficiency of tomato production: A case study of district Peshawar (Pakistan). World Appl. Sci. J. 28 (10): 1389-1392.
Kopp, R.J. and W.E. Diewert. 1982. The decomposition of frontier cost function deviations into measure of technical and allocative efficiency. J. Econ. 19(2-3): 319-331. https://doi.org/10.1016/0304-4076(82)90008-2
Lau, L.J. and P.A. Yotopoulos. 1971. A test for relative efficiency and application to Indian agriculture. Am. Econ. Rev. 61(1): 94-109.
Maniriho, Aristide and B. Alfred. 2015. Analysis of allocative efficiency among small scale farmers in Musanze District, Northern Rwanda. Eur. J. Acad. Essays. 2(2): 57-64.
Muhammad, N., S.A. Shah, A.U. Jan, Irfan Ullah, M. Ibrahim and S. Khan. 2017. Allocative efficiency analysis of tomato growers in Mohmand Agency, Pakistan. Sarhad J. Agric. 33(3): 366-370. https://doi.org/10.17582/journal.sja/2017/33.3.366.370
Murthy, D.S., M. Sudha., M.R. Hegde and V. Dakshinamoorthy. 2009. Technical efficiency and its determinants in tomato production in Karnataka, India. Agric. Econ. Res. Rev. 22: 215-224.
Puozaa, F.Z. 2015. Allocative efficiency of irrigated tomato production in the upper east region, Ghana. Thesis submitted to the university of Ghana, Legon, in partial fulfillment of the requirement for Master of Philos. degree Agric. Econ. http://ugspace.ug.edu.gh
Schmidt, P. and C.A.K. Lovell. 1979. Estimating technical and allocative efficiency relative to stochastic production and cost frontiers: J. Econ. 9(1979): 343-366. https://doi.org/10.1016/0304-4076(79)90078-2
Tsoho, B.A., O.A. Omotesho., S.A. Salauand and M.O. Adewumi. 2012. Determinants of technical, allocative and economic efficiencies among dry season vegetable farmers in Sokoto State, Nigeria. J. Agric. Sci. 3(2): 113-119. https://doi.org/10.1080/09766898.2012.11884692
Usman, J. and U.M. Bakari. 2013. Productıvıty analysıs of dry season tomato (lycopersicon esculentum mill.) productıon in Adamawa State, Nigeria. ARPN J. Sci. Technol. 3(5): 2225-7217.
Varian, H.R. 1992. Microeconomic analysis, 3rd edition. W.W. Norton and Company Inc., New York. N.Y. 10110.
Yamane, T. 1967. Statistics: An introductory analysis, 2nd Ed., New York. Harper and row.
Zieschang, K. 1983. A note on the decomposition of cost efficiency into technical and allocative components: J. Econ. 23(3): 401-405. https://doi.org/10.1016/0304-4076(83)90067-2
To share on other social networks, click on any share button. What are these?


