Advances in Animal and Veterinary Sciences
Research Article
Assessing the Influence of Biotic and Abiotic Factors on Tick Disease Incidence in Cattle
Boopathi Gopalakrishnan1,2, Melkumaramangalam Palani Sugumaran1*, Kannan Balaji1, Maruthamuthu Thirunavukkarasu1, Veeraswamy Davamani1
1Tamil Nadu Agricultural University, India; 2 ICAR- National Institute of Abiotic Stress Management, India.
Abstract | An epidemiological study was carried out through sero-surveillance to assess the tick disease outbreak in Thondamuthur block of Coimbatore district in Tamil Nadu, India. Blood samples were collected from cattle with severe tick infestation and other clinical symptoms for the screening of haemoparasites. Information regarding cattle breed, age, sex, tick species and meteorological data were gathered. The results revealed that the theileriosis incidence was higher (12.87%) compared to anaplasmosis (2.26%) and babesiosis (1.58%). Rhipicephalus microplus was observed to be dominant (51.69%) compared to Hyalomma anatolicum (48.31%), Haemaphysalis sp. (8.58%) and Amblyomma sp. (5.42%). Crossbred cattle were found to be more susceptible (96.39%) to tick infestation compared to native breeds (3.61%). Higher tick infestation was recorded in the monsoon season (38.60%) and higher tick diseases were observed in the summer season (23.19%). The results can provide an insight into the dynamics of tick disease outbreak in cattle as influenced by the changes in various biotic and abiotic factors.
Keywords | Cattle, Biotic influence, Seasonal factors, Tick diseases, Ticks
Received | April 15, 2020; Accepted | July 18, 2020; Published | September 01, 2020
*Correspondence | Sugumaran MP, Tamil Nadu Agricultural University, India; Email: [email protected]
Citation | Gopalakrishnan B, Sugumaran MP, Kannan B, Thirunavukkarasu M, Davamani V (2020). Assessing the influence of biotic and abiotic factors on tick disease incidence in cattle. Adv. Anim. Vet. Sci. 8(11): 1120-1128.
DOI | http://dx.doi.org/10.17582/journal.aavs/2020/8.11.1120.1128
ISSN (Online) | 2307-8316; ISSN (Print) | 2309-3331
Copyright © 2020 Gopalakrishnan et al. This is an open access article distributed under the Creative Commons Attribution License, which permits unrestricted use, distribution, and reproduction in any medium, provided the original work is properly cited.
Introduction
Ticks act as a carrier for various diseases that spread between animals and humans and are considered as dangerous vectors next to mosquitoes. Tick-borne diseases often hinder cattle rearing by rapidly developing clinical symptoms and fatal diseases (Ghosh et al., 2006). The loss arising out of Ticks and Tick-Borne Diseases (TTBD) in India is estimated to be very high around $500 million per annum (Minjauw and Mcleod, 2003). Ticks carry and transmit a wide range of harmful pathogens like Crimean-Congo Haemorrhagic Fever (CCHF) virus, Kyasanur Forest Disease (KFD) virus, Theileria, Babesia, Anaplasma, etc., causing considerable damage to the cattle population (Ghosh and Nagar, 2014).
The prominence of blood parasites like Theileria, Babesia, Anaplasma, Trypanosoma, etc., varies from region to region. Geographic factors were found to have an influence on the parasitic survival rate (Siddiki et al., 2012). Significant seasonal fluctuation has been observed in the prevalence of diseases caused by blood parasites in cattle. Rainfall, temperature and relative humidity play a vital role in the tick infestation and development (Ghosh et al., 2007). The age, breed, sex, location and tick exposure were found to be deciding factors for the animal to be a carrier for tick-borne pathogens and susceptibility to tick diseases (Vahora et al., 2012; Kolte et al., 2017).
Indigenous breeds were found to be more resistant to certain infection even in the absence of any management practices and are less susceptible to protozoan diseases compared to crossbred cattle (Ghosh et al., 2018). Higher tick infestation and the associated disease incidence was observed to be higher in aged and diseased cattle (Ponnudurai et al., 2017). Epidemiological studies through sero-surveillance can provide detailed information on the disease outbreak and the factors affecting them in a particular location. Such studies can be helpful in providing information about the dynamics of tick disease incidence in cattle with regard to several biotic and abiotic factors. Hence the current investigation was carried out to study the influence of biotic and abiotic factors involved in tick disease outbreak in cattle.
MATERIALS AND METHODS
Study area
Thondamuthur block is located in the Coimbatore south Taluk of the Coimbatore district in the State of Tamil Nadu, India (Figure 1). It comprises ten village Panchayats extending between 10° 54’ 42.57” N, 76° 55’ 12.4” E and 11° 1’ 20.33” N, 76° 41’ 14.46” E. The altitude of the region varies from 400 to 600 m. The average temperature ranges between 21°C and 32°C. The average annual precipitation varies between 550 and 900 mm.
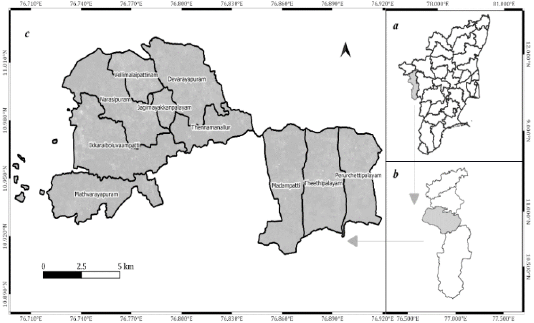
Figure 1: (a) The State of Tamil Nadu, (b) Coimbatore District, (c) Thondamuthur Block (Study area).
Ethical statement
Blood samples were collected from clinical cases attended at the government veterinary dispensaries and various cattle camps organised by the Department of Animal Husbandry. Samples were collected only by the government authorised Veterinary Assistant Surgeons from cattle with severe tick infestation and other clinical symptoms. Hence the study does not require any ethical approval.
Biotic factors
Breed
The cattle in the study area was broadly classified under two categories, viz., crossbred and indigenous. The major breeds of crossbred cattle in the study area were Holstein Friesian crossbred, Jersey crossbred and Mixed breed (HF × Jersey). The indigenous cattle include all the descript and non-descript varieties of native breeds (GOI, 2014).
Sex
The sex of both the indigenous and crossbred cattle was classified as male and female (GOI, 2014).
Age
In the crossbred cattle, the male population >1.5 years were classified as adult and < 1.5 years as calves. The female population > 2.5 years were classified as adult and < 2.5 years as calves. Similarly, in the indigenous category, the male population > 2 years were classified as adult and < 2 years as calves. The female population > 3 years were classified under adult category and < 3 years as calves (BAHFS, 2014).
Tick species
The tick species collected during blood sample collection were identified using standard morphological identification keys (Soulsby, 1982).
Abiotic factors
Geographic factors
Significant variation was observed in the tick species and the disease prevalence through various studies conducted in different zones of India. Hence, the geographical location of the study area which falls under the southern part of the country was considered as a factor to study and compare the tick and disease prevalence with other studies conducted in the same zone.
Seasons
The disease incidence was compared between four seasons, viz., Summer, Monsoon, Post Monsoon and Winter season, as per the standard classification of the seasons described by the Indian Meteorological Department, Government of India (IMD, 2017).
Meteorological data
The daily average temperature and relative humidity data were obtained from the NASA Langley Research Centre (LaRC) POWER Project funded through the NASA Earth Science/Applied Science Program and used to prepare the monthly dataset to compare with the disease prevalence.
Blood sample collection and staining
Blood samples were collected and thin blood smears were prepared as per the standard protocol described by Uilenberg (1998). The slides were allowed to air dry for five minutes and labelled appropriately with identification number including cattle details, place of collection and date. The air-dried blood smears were stained using Leishman stain solution as per the standard procedure (Gadhavi et al., 2017) and observed under the light microscope through oil immersion at 100X magnification for detection of blood parasites. Samples were collected for the period between March 2019 and February 2020.
Statistical analysis
Data were subjected to t-test, one way- analysis of variance (ANOVA) and logistic regression using R software for statistical computing (3.6.3). All values are expressed as mean with standard error values.
Table 1: Seasonal prevalence of haemoparasites in the study area.
| Season | Months | Total sample collected | Total positive | Theileria annulata | Anaplasma marginale | Babesia bigemina |
| Summer | March | 35 | 8(22.86) | 5(14.29) | 2(5.71) | 1(2.86) |
| April | 48 | 13(27.08) | 11(22.92) | 1(2.08) | 1(2.08) | |
| May | 55 | 11(20.00) | 9(16.36) | 1(1.82) | 1(1.82) | |
| Total | 138 | 32(23.19) | 25(18.12) | 4(2.90) | 3(2.17) | |
| Mean ± SE |
8.33±1.76a |
1.33±0.33NS |
1.00±0.00NS |
|||
| Monsoon | June | 38 | 8(21.05) | 6(15.79) | 1(2.63) | 1(2.63) |
| July | 42 | 9(21.43) | 8(19.05) | 1(2.38) | 0(0.00) | |
| August | 30 | 5(16.67) | 5(16.67) | 0(0.00) | 0(0.00) | |
| September | 37 | 6(16.22) | 4(10.81) | 1(2.70) | 1(2.70) | |
| Total | 147 | 28(19.05) | 23(15.65) | 3(2.04) | 2(1.36) | |
| Mean ± SE |
5.75±0.85ab |
0.75±0.25 NS |
0.50±0.29NS |
|||
| Post Monsoon | October | 38 | 4(10.53) | 2(5.26) | 1(2.63) | 1(2.63) |
| November | 37 | 4(10.81) | 3(8.11) | 1(2.70) | 0(0.00) | |
| Total | 75 | 8(10.67) | 5(6.67) | 2(1.33) | 1(2.67) | |
| Mean ± SE |
2.5±0.5b |
1±0NS |
0.5±0.5NS |
|||
| Winter | December | 29 | 2(6.90) | 1(3.45) | 1(3.45) | 0(0.00) |
| January | 26 | 1(3.85) | 1(3.85) | 0(0.00) | 0(0.00) | |
| February | 28 | 3(10.71) | 2(7.14) | 0(0.00) | 1(3.57) | |
| Total | 83 | 6(7.23) | 4(4.82) | 1(1.20) | 1(1.20) | |
| Mean ± SE |
1.33±0.33b |
0.33±0.33NS |
0.33±0.33NS |
|||
| Total | 443 | 74(16.70) | 57(12.87) | 10(2.26) | 7(1.58) | |
| Mean ± SE | 4.75±0.94 | 0.83±0.17 | 0.58±0.15 |
Values in brackets are in percentage; Mean values with a different superscript in the same column differ significantly (p<0.05); NS: Not Significant.
Table 2: Influence of sex on seasonal tick and disease prevalence in cattle.
| Season | Total samples | Tick infestation | Total Samples | Disease incidence | ||||||
| Crossbred | Native | Crossbred | Native | |||||||
| Male | Female | Male | Female | Male | Female | Male | Female | |||
| Summer | 138 | 2 | 132 | 2 | 2 | 32 | 1 | 31 | - | - |
| Monsoon | 147 | 1 | 140 | 4 | 2 | 28 | 1 | 27 | - | - |
| Post Monsoon | 75 | 2 | 71 | 1 | 1 | 8 | 1 | 7 | - | - |
| Winter | 83 | 1 | 78 | 3 | 1 | 6 | 1 | 5 | - | - |
| Total | 443 | 6 | 421 | 10 | 6 | 74 | 4 | 70 | - | - |
| Mean ± SE | 1.5±0.29 | 105.25±17.89 | 2.5±0.65 | 1.5±0.29 | 1±0 | 17.5±6.70 | - | - | ||
|
t (6) = 5.8, Significant at p<0.05 |
t (6) = 1.4, Not Significant |
t (6) = 2.5, Significant at p<0.05 |
||||||||
Results
The screening process revealed the prevalence of three major blood parasites in the study area viz., Theileria annulata, Babesia bigemina and Anaplasma marginale. Theileria annulata appeared as a small stained signet ring or comma-shaped organism when observed through a light microscope at 100X magnification. Babesia bigemina appeared as an oval or pear-shaped organism and Anaplasma marginale appeared as a small round organism situated towards the periphery of the red blood cells. The monthly breakup of samples collected and the incidence percentage of the above blood parasites are given in Table 1. The results revealed that the incidence of theileriosis was higher (12.87%) in the study area compared to anaplasmosis (2.26%) and babesiosis (1.58%). Significant difference (p<0.01) between the seasons was observed with regard to theileriosis incidence (Suppl. Table 1. and Suppl. Table 2) and no significant difference was observed between the seasons with regard to babesiosis (Suppl. Table 3 and Suppl. Table 4) and anaplasmosis (Suppl. Table 5 and Suppl. Table 6) incidence. Out of the 443 samples collected, only 16 samples (3.61%) were from native breeds with tick infestation and none of the samples screened positive for the presence of blood parasites (Table 2). Native breeds showed increased resistance to tick infestation and tick-borne diseases compared to crossbred cattle.
Out of the 443 samples from tick infested cattle, 427 (96.39%) samples were from female cattle and 16 (3.61%) samples were from male cattle (Table 2). The female population of crossbreds recorded the highest tick infestation (95.03%) and disease incidence (94.59%). The adult population of cattle was found to be more susceptible to tick infestation compared to calves (Table 3). A higher percentage of tick infestation (80.14%) and disease incidence (77.03%) was recorded in adults when compared to the tick infestation (19.86%) and disease incidence (22.97%) in calves.
Table 3: Influence of age on seasonal tick and disease prevalence in cattle.
| Season | Total samples | Tick infestation | Total samples | Disease incidence | ||||||
| Crossbred | Native | Crossbred | Native | |||||||
| Adult | Calf | Adult | Calf | Adult | Calf | Adult | Calf | |||
| Summer | 138 | 102 | 32 | 3 | 1 | 32 | 25 | 7 | - | - |
| Monsoon | 147 | 119 | 22 | 4 | 2 | 28 | 22 | 6 | - | - |
| Post Monsoon | 75 | 60 | 13 | 1 | 1 | 8 | 6 | 2 | - | - |
| Winter | 83 | 63 | 16 | 3 | 1 | 6 | 4 | 2 | - | - |
| Total | 443 | 344 | 83 | 11 | 5 | 74 | 57 | 17 | - | - |
| Mean ± SE | 86±14.58 | 20.75±4.19 | 2.75±0.63 | 1.25±0.25 | 14.25±5.39 | 4.25±1.31 | - | - | ||
|
t (6) = 4.3, Significant at p<0.05 |
t (6) = 2.2, Not Significant |
t (6) = 1.8, Not Significant |
||||||||
Table 4: Logistic regression for various factors used in the study.
| Dependent variable | Factors | Predictors | Logit | OR | 95% CI | SE | Z value | Pr(>|z|) |
| Disease incidence | Age | Adult | 1.654 | 5.228 | 3.94- 6.94 | 0.145 | 11.441 |
<2e-16 *** |
| Calf | -0.225 | 0.799 | 0.44- 1.46 | 0.306 | -0.733 | 0.463 | ||
| Sex | Female | 1.607 | 4.986 | 3.86- 6.43 | 0.130 | 12.355 |
<2e-16 *** |
|
| Male | 0.003 | 1.003 | 0.28- 3.56 | 0.646 | 0.004 | 0.997 | ||
| Breed | Crossbred | 1.562 | 4.770 | 3.71- 6.13 | 0.128 | 12.220 |
<2e-16 *** |
|
| Native | 15.004 | 3.281e+06 | 0.00- inf | 599.886 | 0.025 | 0.98 | ||
| Tick | Rhipicephalus | 1.158 | 3.182 | 2.35- 4.31 | 0.155 | 7.488 |
7.02e-14 *** |
|
| Hyalomma | 0.900 | 2.459 | 1.36- 4.43 | 0.300 | 2.995 | 0.003** | ||
| Haemaphysalis | 2.454 | 11.629 | 1.56- 86.72 | 1.025 | 2.393 | 0.017 * | ||
| Amblyomma | 2.021 | 7.543 | 1.00- 57.04 | 1.032 | 1.957 | 0.050 | ||
| Season | Summer | 1.198 | 3.313 | 2.23- 4.92 | 0.202 | 5.938 |
2.89e-09 *** |
|
| Monsoon | 0.249 | 1.283 | 0.73-2.27 | 0.291 | 0.856 | 0.392 | ||
| Post Monsoon | 0.928 | 2.528 | 1.10-5.82 | 0.425 | 2.183 | 0.029 * | ||
| Winter | 1.354 | 3.874 | 1.54- 9.72 | 0.469 | 2.885 | 0.004 ** |
Significance level: ***, p <0.001; **, p<0.01; *, p<0.05; CI: Confidence Interval; OR: Odds Ratio; SE: Standard Error.
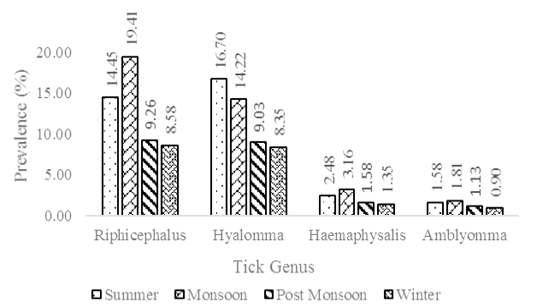
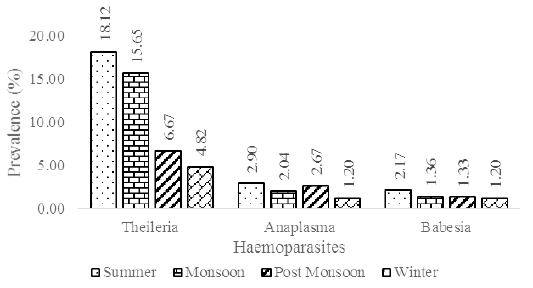
The major tick species found in the study area were Rhipicephalus microplus, Hyalomma anatolicum, Haemaphysalis sp. and Amblyomma sp. Among the tick species, Rhipicephalus microplus was found to be prominent (51.69%) in the study area followed by Hyalomma anatolicum (48.31%), Haemaphysalis sp. (8.58%) and Amblyomma sp. (5.42%). A considerable amount of mixed infestation by two or more genus of ticks was also observed. The prevalence of tick infestation was found to be higher in monsoon season (38.60%) followed by summer season (35.21%), post monsoon season (20.99%) and least in the winter season (19.19%). The prevalence of tick disease incidence was found to be higher in summer season (23.19%) followed by monsoon season (19.05%), post monsoon season (10.67%) and least in the winter season (7.23%).
Discussion
In the current study, theileriosis incidence was observed to be higher compared to other haemoparasites. The prevalence of theileriosis has been observed to be high in the tropical regions which provide a favourable environmental condition for tick and parasitic development (Kumar et al., 2018). Several studies conducted across India in various states have reported the higher incidence of theileriosis compared to other tick-borne diseases making the disease endemic to the Indian subcontinent (Vahora et al., 2012; Kohli et al., 2014; Velusamy et al., 2014; Ganguly et al., 2017).
Biotic factors
Influence of breed
Indigenous cattle were observed to be least affected by tick infestation and disease incidence. This is due to the ability of the native breeds to manifest tick resistance through their morphological adaptations like skin thickness, light coat colour, short dense hair (Shyma et al., 2013) and immuno-biochemical responses in their skin (Franzin et al., 2017). In a similar study conducted by Ponnudurai et al. (2017), all the positive results were reported from crossbred cattle and none of the native cattle scored a positive for blood protozoans. Earlier studies have shown that the population of crossbred cattle was sensitive to tick infestation and diseases when compared to native cattle (Kolte et al., 2017; Siddiki et al., 2012; Vahora et al., 2012).
Influence of sex
The male population of crossbreds was very rare in the study area excepting a few male calves and stud bulls. The reverse scenario was observed with regard to native breeds where the male population was higher compared to female. As a result, the observations were more weighted towards the female population of crossbreds which showed the highest tick infestation and disease incidence. The female population was found to be more susceptible to tick infestation due to hormonal effect and higher stress levels compared to males (Kaur et al., 2015). In several studies, the female population of cattle showed a higher infestation of ticks and the presence of pathogens when compared to the male population (Kabir et al., 2011; Kolte et al., 2017; Debbarma et al., 2018; Ghosh et al., 2018).
Influence of age
In the current investigation, the adult population of cattle was found to have a higher tick infestation and disease incidence compared to calves. One major reason is that the majority of adult cattle in the study area were allowed to graze in open fields which increases the risk of tick infestation and in turn the disease incidence. Calves were usually stall-fed and not allowed for open grazing which lowers the risk of tick infestation. Similar studies on tick infestation in cattle have reported higher infestation in the adults compared to calves (Ananda et al., 2009; Ghosh et al., 2018; Roy et al., 2004; Velusamy et al., 2014).
Influence of tick species
The higher incidence of Rhipicephalus and Hyalomma genus is due to the fact that they tend to propagate in hot humid and semi-dry conditions, which is prevalent in the study area thereby providing a favourable condition for their rapid multiplication. Earlier studies on tick infestation in cattle have shown that the genus and species of ticks vary depending on the geographical location of the outbreak (Singh and Rath, 2013; Ponnudurai et al., 2017; Debbarma et al., 2018; Ghosh et al., 2018).
Abiotic factors
Influence of geographic factors
In the current study, Theileria haemoparasite (12.87%) and Rhipicephalus ticks (51.69%) were found to have a high prevalence in the study area. The hot and humid weather condition prevalent in the southern part of India makes the region endemic to certain parasitic and tick infestation. Theileriosis incidence was found to be endemic in the western districts of Tamil Nadu State (Velusamy et al., 2014). A severe outbreak of Theileria orientalis was reported in the northern (40%) and middle zone (39.28%) and Babesia bigemina in the southern zone (14.94%) of Kerala State (Kariyappa et al., 2017). Higher prevalence of theileriosis (31.06%) was reported among the cattle in the northern zone of Bangalore (Ananda et al., 2009). The prevalence of Rhipicephalus sp. and Haemaphysalis intermedia was found to be higher in the North western part of Tamil Nadu (Ponnudurai et al., 2017).
Influence of season
Incidence of ticks: The prevalence of Rhipicephalus microplus was higher in the monsoon season and Hyalomma anatolicum was higher in the summer months (Figure 2). The reason for their prevalence in different seasons is that Rhipicephalus sp. tends to propagate rapidly in hot and humid weather conditions, while Hyalomma sp. thrives well in dry and semi-dry conditions (Singh and Rath, 2013). Several studies on tick infestation have shown variation in the period of maximum incidence with some observing higher incidence in summer and some in rainy seasons. However, the incidence was found to be lowest in the winter seasons in most of the studies (Kabir et al., 2011; Singh and Rath, 2013; Ghosh et al., 2018).
Incidence of blood parasites: In the current investigation, higher disease incidence was observed in the summer season (Figure 3). Temperature and relative humidity were observed to influence haemoparasitic development (Figure 4a and 4b). Earlier studies on tick disease outbreak have shown variation in the period of maximum incidence. Theileriosis prevalence was observed to be higher in the summer months (Velusamy et al., 2014). The overall parasitic outbreak in cattle was reported to be higher in summer followed by winter and least in the rainy season (Velusamy et al., 2015). Similar studies have reported higher parasitic incidence in monsoon season followed by summer and winter seasons (Vahora et al., 2012; Kohli et al., 2014; Ganguly et al., 2017; Debbarma et al., 2018).
Logistic regression
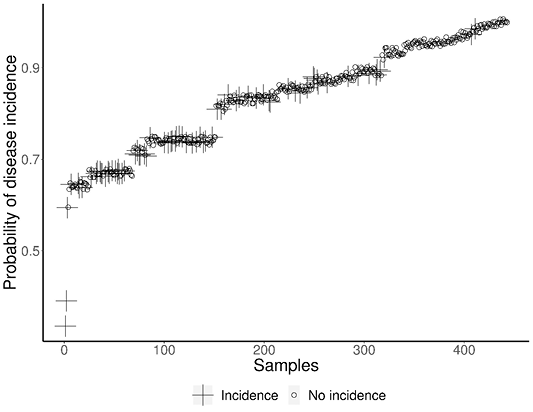
The various factors considered in the current study were subjected to logistic regression to arrive at the significance of individual factors in the disease outbreak. The results of the statistical analysis along with the log of odds for various factors and their significance is presented in Table 4. The results revealed that the factors like adult cattle, female population, crossbred cattle and summer season significantly influenced the disease outbreak. The tick genus Rhipicephalus and Hyalomma contributed significantly to disease incidence compared to other tick genus. The probability of disease incidence for each collected sample derived from the logistic regression model is depicted in Figure 5.
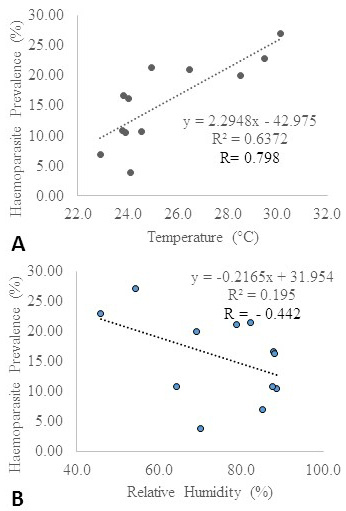
Figure 4: (A): Influence of temperature on haemoparasite prevalence*; (B): Influence of relative humidity on haemoparasite prevalence*.
* The meteorological data were obtained from the NASA Langley Research Centre (LaRC) POWER Project funded through the NASA Earth Science/Applied Science Program.
Conclusion
The influence of various factors over tick disease outbreak in cattle was assessed in the current investigation. Tick diseases have a huge impact on the economy of cattle farmers by directly affecting the cattle through mortality or indirectly through reduced productivity and increased medical expenses. Majority of the farmers maintain cattle as a risk reduction component in times of crisis like crop failure and hence their welfare must be given utmost importance. Proper control measures should be carried out to reduce the impact of both abiotic and biotic factors which influence the tick-borne diseases. Studies on the seasonal dynamics of disease outbreak can help in establishing an early warning system which will dampen the risks associated with cattle rearing. Future studies on disease outbreak in cattle can include the use of models to predict the seasonal rhythms of various limiting factors and their application in controlling the disease prevalence.
Acknowledgements
The author acknowledges the Director, Indian Council of Agricultural Research – National Institute of Abiotic Stress Management and the Head of the Department of Environmental Sciences, Tamil Nadu Agricultural University, for providing the necessary support to carry out the current research. The support provided by the Veterinary Assistant Surgeons (Department of Animal Husbandry) in sample collection is greatly acknowledged.
Authors Contribution
Boopathi Gopalakrishnan designed the study, performed the survey, sample collection, processing and screening and wrote the first draft of the manuscript. Melkumaramangalam Palani Sugumaran managed the literature searches, manuscript improvement and supervised the overall work. Kannan Balaji handled the data processing, statistical analysis and manuscript improvement. Maruthamuthu Thirunavukkarasu and Veeraswamy Davamani reviewed the work and provided critical comments for improvement.
Conflict of interest
The authors have declared no conflict of interest.
REFERENCES
Supp Table 1: One-way anova for Theileria.
| Df | Sum | Sq | Mean Sq | F value | Pr(>F) |
| Season | 3 | 87.67 | 29.222 | 8.179 | 0.00806** |
| Residuals | 8 | 28.58 | 3.573 |
Signif. codes: 0 ‘***’ 0.001 ‘**’ 0.01 ‘*’ 0.05 ‘.’ 0.1 ‘’ 1
Supp Table 2: Tukey’s HSD for Theileria (95% family-wise confidence level)
| Diff | lwr | upr | p | adj |
| Post Monsoon-Monsoon | -3.250000 | -8.4921705 | 1.9921705 | 0.2690862 |
| Summer-Monsoon | 2.583333 | -2.0398265 | 7.2064932 | 0.3441040 |
| Winter-Monsoon | -4.416667 | -9.0398265 | 0.2064932 | 0.0611691 |
| Summer-Post Monsoon | 5.833333 | 0.3076004 | 11.3590662 | 0.0389398 |
| Winter-Post Monsoon | -1.166667 | -6.6923996 | 4.3590662 | 0.9032647 |
| Winter-Summer | -7.000000 | -11.9423658 | -2.0576342 | 0.0082576 |
Supp Table 3: One-way anova for Babesia.
| Df | Sum | Sq | Mean Sq | F value | Pr(>F) |
| Season | 3 | 0.750 | 0.2500 | 0.923 | 0.472 |
| Residuals | 8 | 2.167 | 0.2708 |
Signif. codes: 0, ***; 0.001, **; 0.01, *; 0.05, .; 0.1, 1
Supp Table 4: Tukey’s HSD for Babesia (95% family-wise confidence level).
| Diff | lwr | upr | p | adj |
| Post Monsoon-Monsoon | 0.0000000 | -1.4432805 | 1.4432805 | 1.0000000 |
| Summer-Monsoon | 0.5000000 | -0.7728538 | 1.7728538 | 0.6111780 |
| Winter-Monsoon | -0.1666667 | -1.4395205 | 1.1061871 | 0.9735804 |
| Summer-Post Monsoon | 0.5000000 | -1.0213513 | 2.0213513 | 0.7255634 |
| Winter-Post Monsoon | -0.1666667 | -1.6880179 | 1.3546846 | 0.9841146 |
| Winter-Summer | -0.6666667 | -2.0274046 | 0.6940713 | 0.4451797 |
Supp Table 5: One-way anova for Anaplasma
| Df | Sum | Sq | Mean Sq | F value | Pr(>F) |
| Season | 3 | 1.583 | 0.5278 | 2.027 | 0.189 |
| Residuals | 8 | 2.083 | 0.2604 |
Signif. codes: 0; ***; 0.001; **; 0.01; *; 0.05 . 0.1; 1
Supp Table 6: Tukey’s HSD for Anaplasma (95% family-wise confidence level).
| Diff | lwr | upr | p | adj |
| Post Monsoon-Monsoon | 0.2500000 | -1.1652530 | 1.6652530 | 0.9395415 |
| Summer-Monsoon | 0.5833333 | -0.6648025 | 1.8314692 | 0.4817750 |
| Winter-Monsoon | -0.4166667 | -1.6648025 | 0.8314692 | 0.7165012 |
| Summer-Post Monsoon | 0.3333333 | -1.1584743 | 1.8251410 | 0.8882246 |
| Winter-Post Monsoon | -0.6666667 | -2.1584743 | 0.8251410 | 0.5162153 |
| Winter-Summer | -1.0000000 | -2.3343133 | 0.3343133 | 0.1543951 |


