
Quantification of Sodium from Food Sources by Using Various Analytical Techniques


Quantification of Sodium from Food Sources by Using Various Analytical Techniques
Nauman Jamil Khan1, Rabia Tariq2, Hina Saleem2 and Muhammad Waheed Mushtaq2*

Figure 1:
Structure of sodium azide.

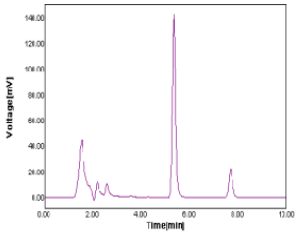
Figure 2:
Chromatogram of juice sample.

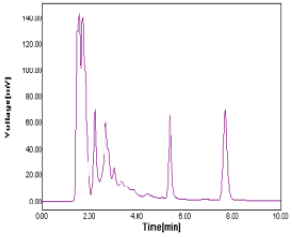
Figure 3:
Chromatogram of jam sample.
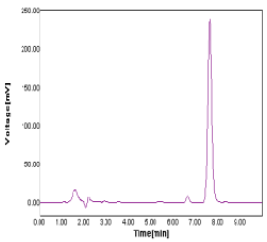
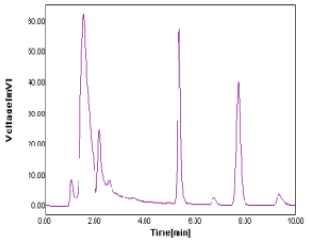
Figure 4:
Chromatogram of cake sample.

Figure 5:
Chromatogram of fizz juice sample.

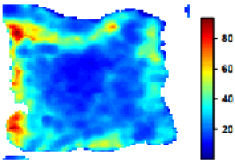
Figure 7:
Brined sample in 2 h (Na intensity on the edges).
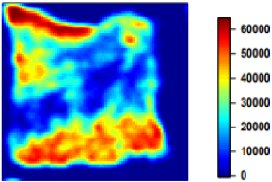
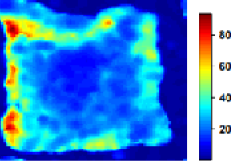
Figure 6:
Control sample.

Figure 8:
Brined sample in 24 hr (Na intensity on the center).

