
Northern Arabian Sea: Rare Fish Diversity and Biogeographic Affinities


Northern Arabian Sea: Rare Fish Diversity and Biogeographic Affinities
Bushra Sial1, Arif Muhammad Khan1, Mohsan Raza1,6*, Azhar Abbas Khan2, Sayyad Ali Raza Bukhari1, Muhammad Kashif Hanif3, Sher Khan Panhwar4, Muhammad Ashfaq5
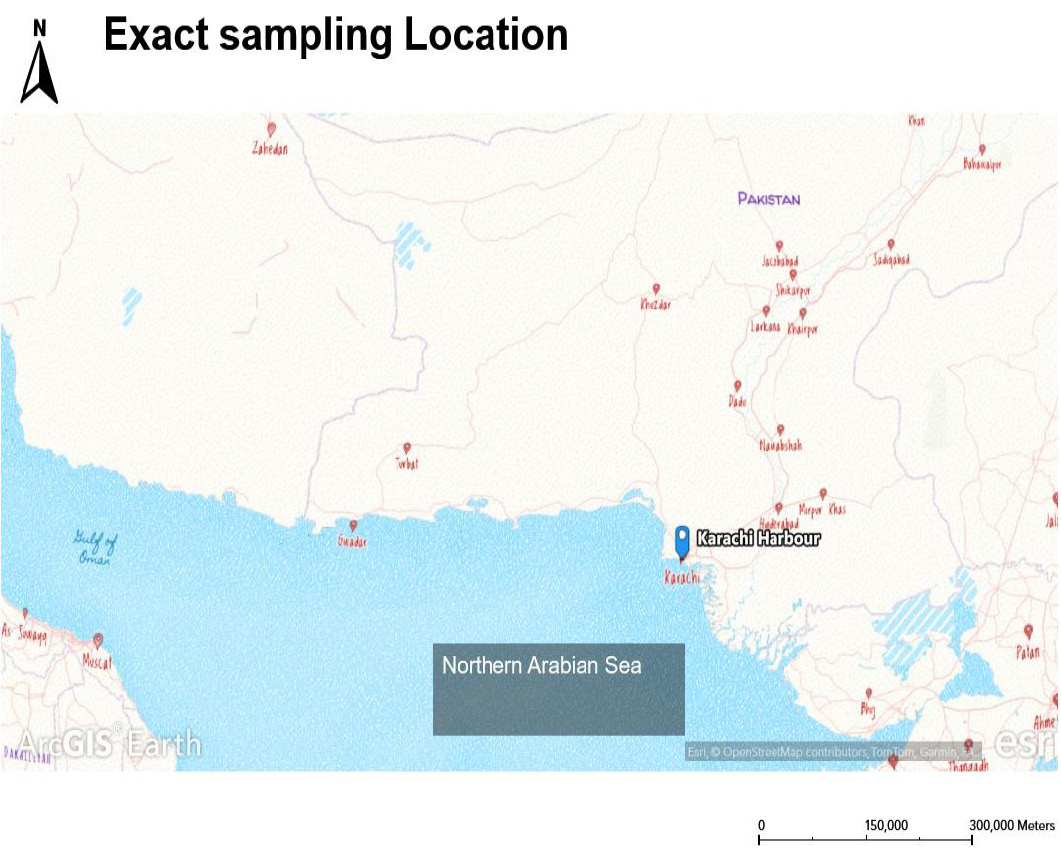
Exact sample collection site. The blue mark shows the exact sampling site for rare fish species.
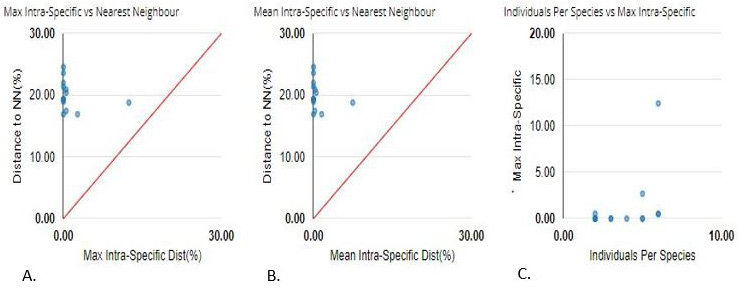
Barcode Gap analysis. (A) Max Intraspecific vs. Nearest Neighbors: Compares the maximum intraspecific distance of each species to the genetic distance of its nearest neighboring species. (B) Mean Intraspecific vs. Nearest Neighbors: Shows the average intraspecific genetic distance compared to the distance to the nearest neighboring species. (C) Individual per Species: Displays individual genetic distances for each species, highlighting variation within and between species.
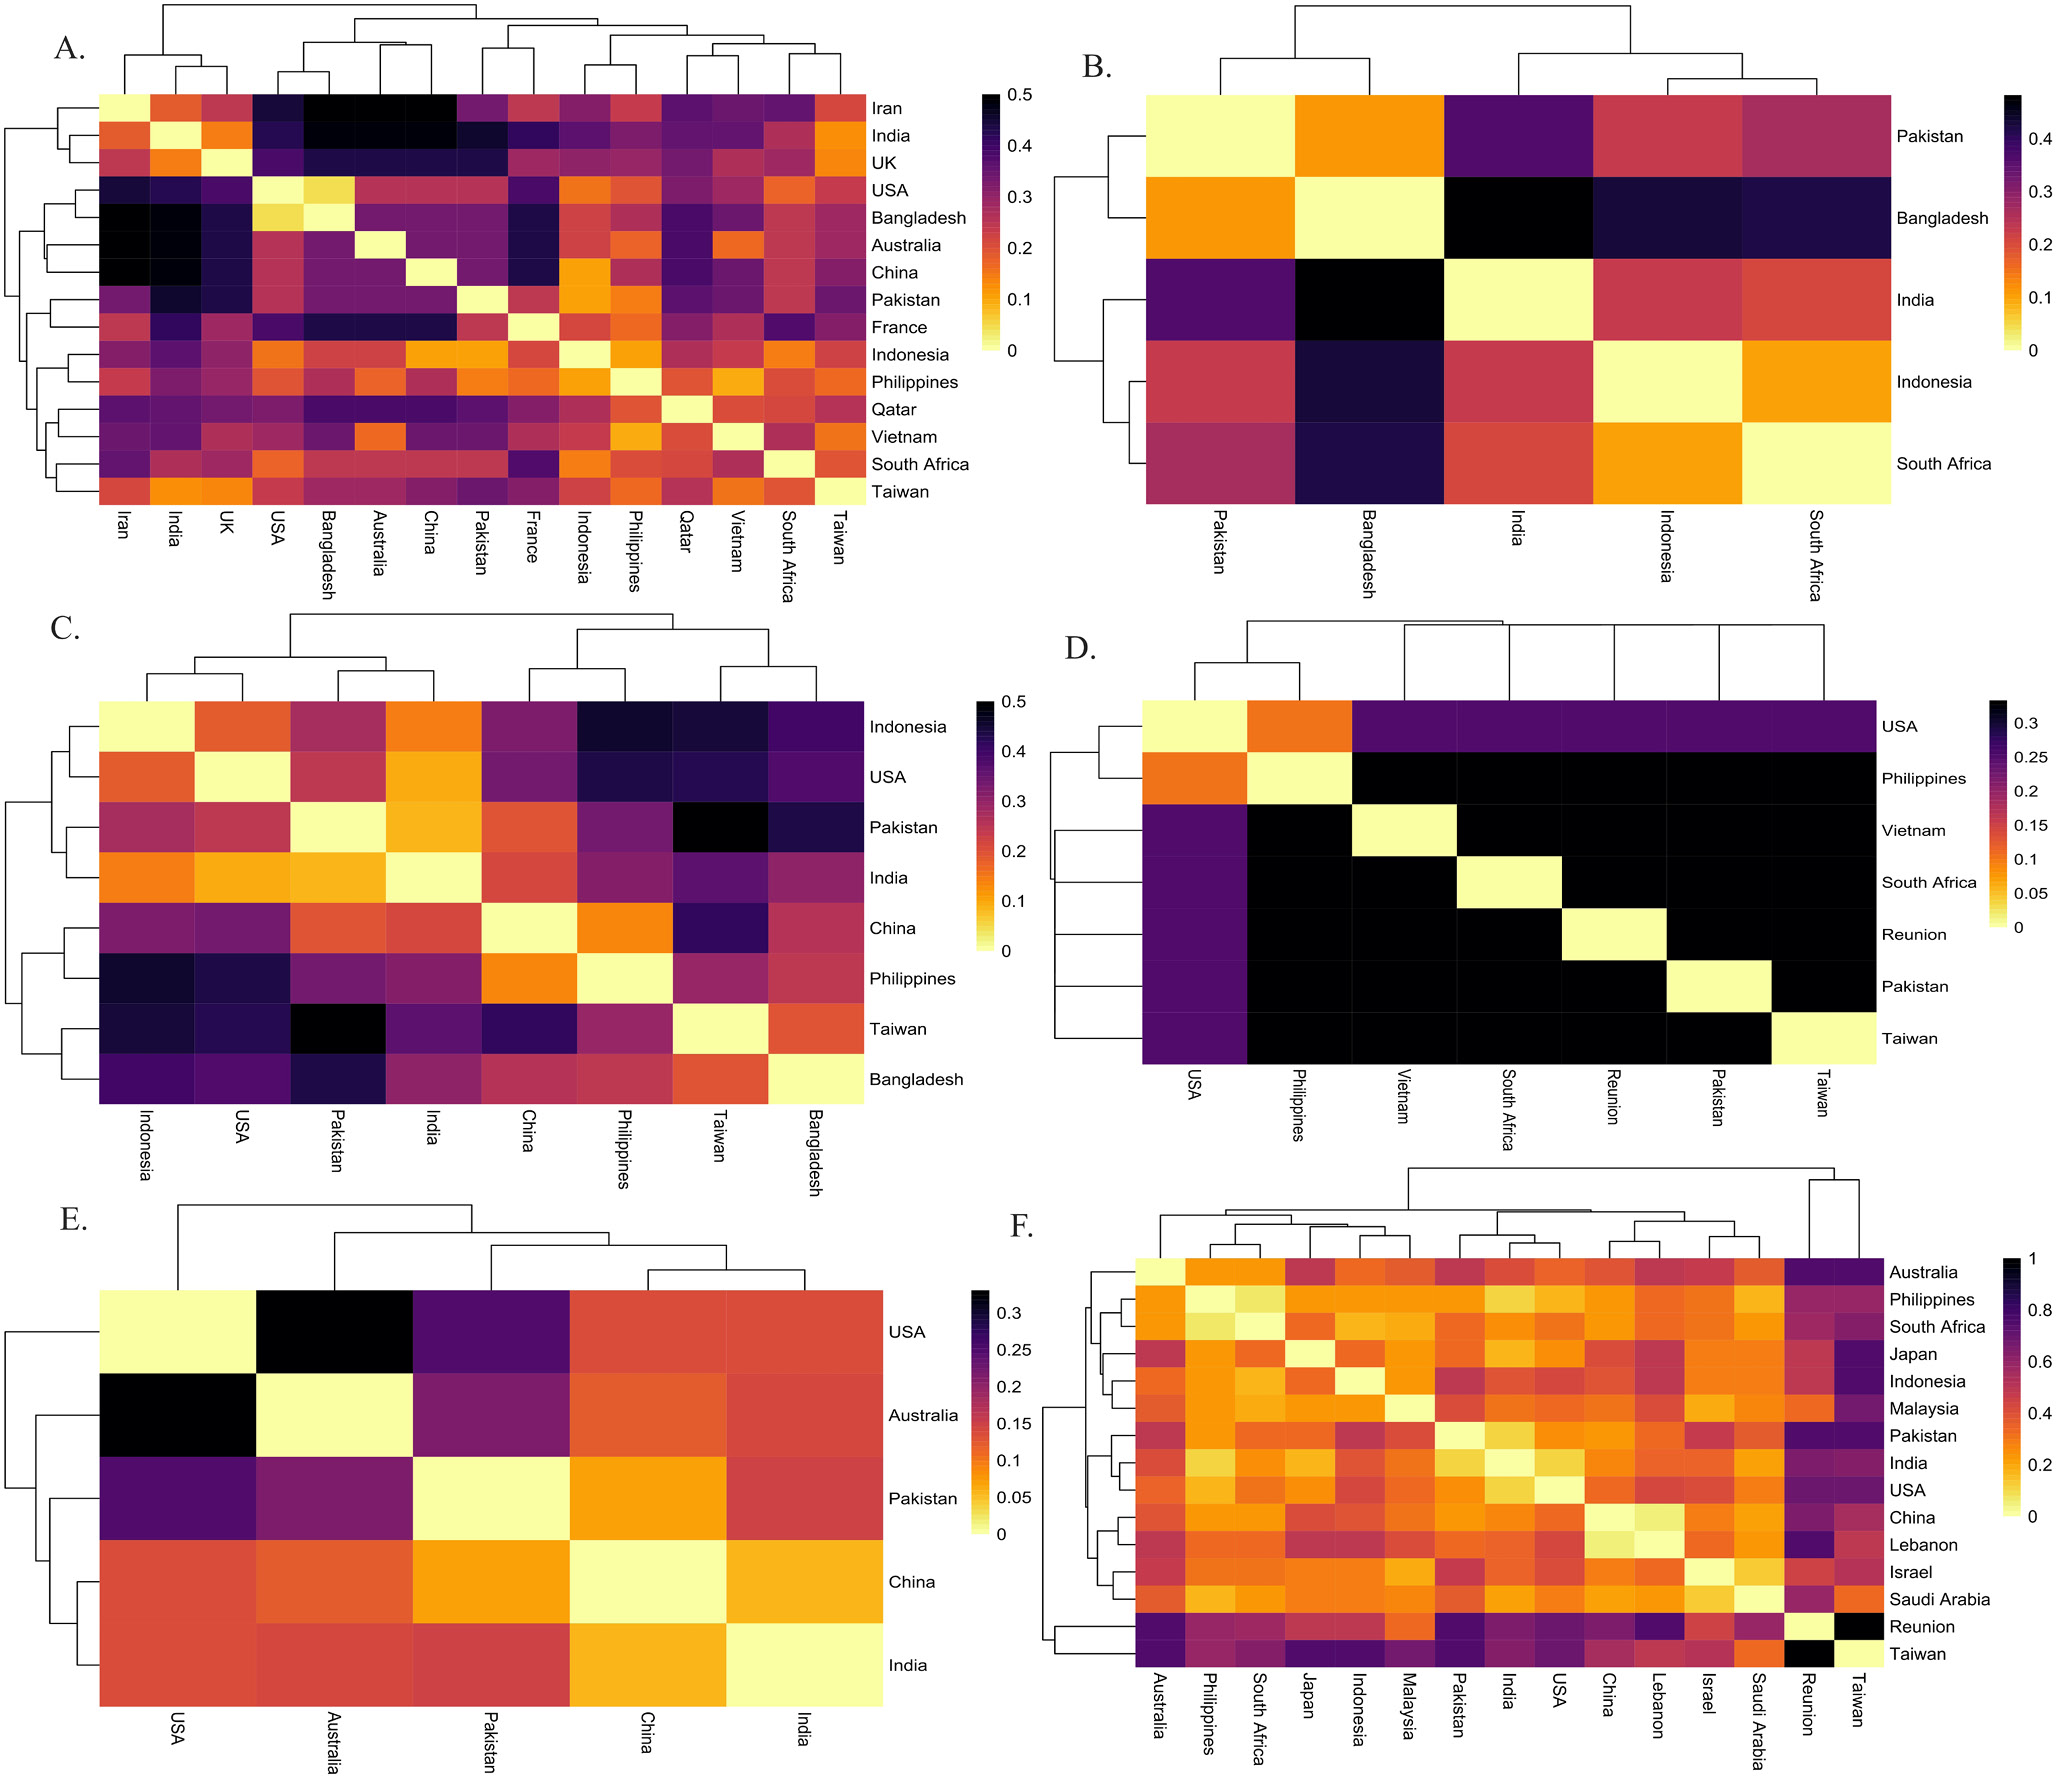
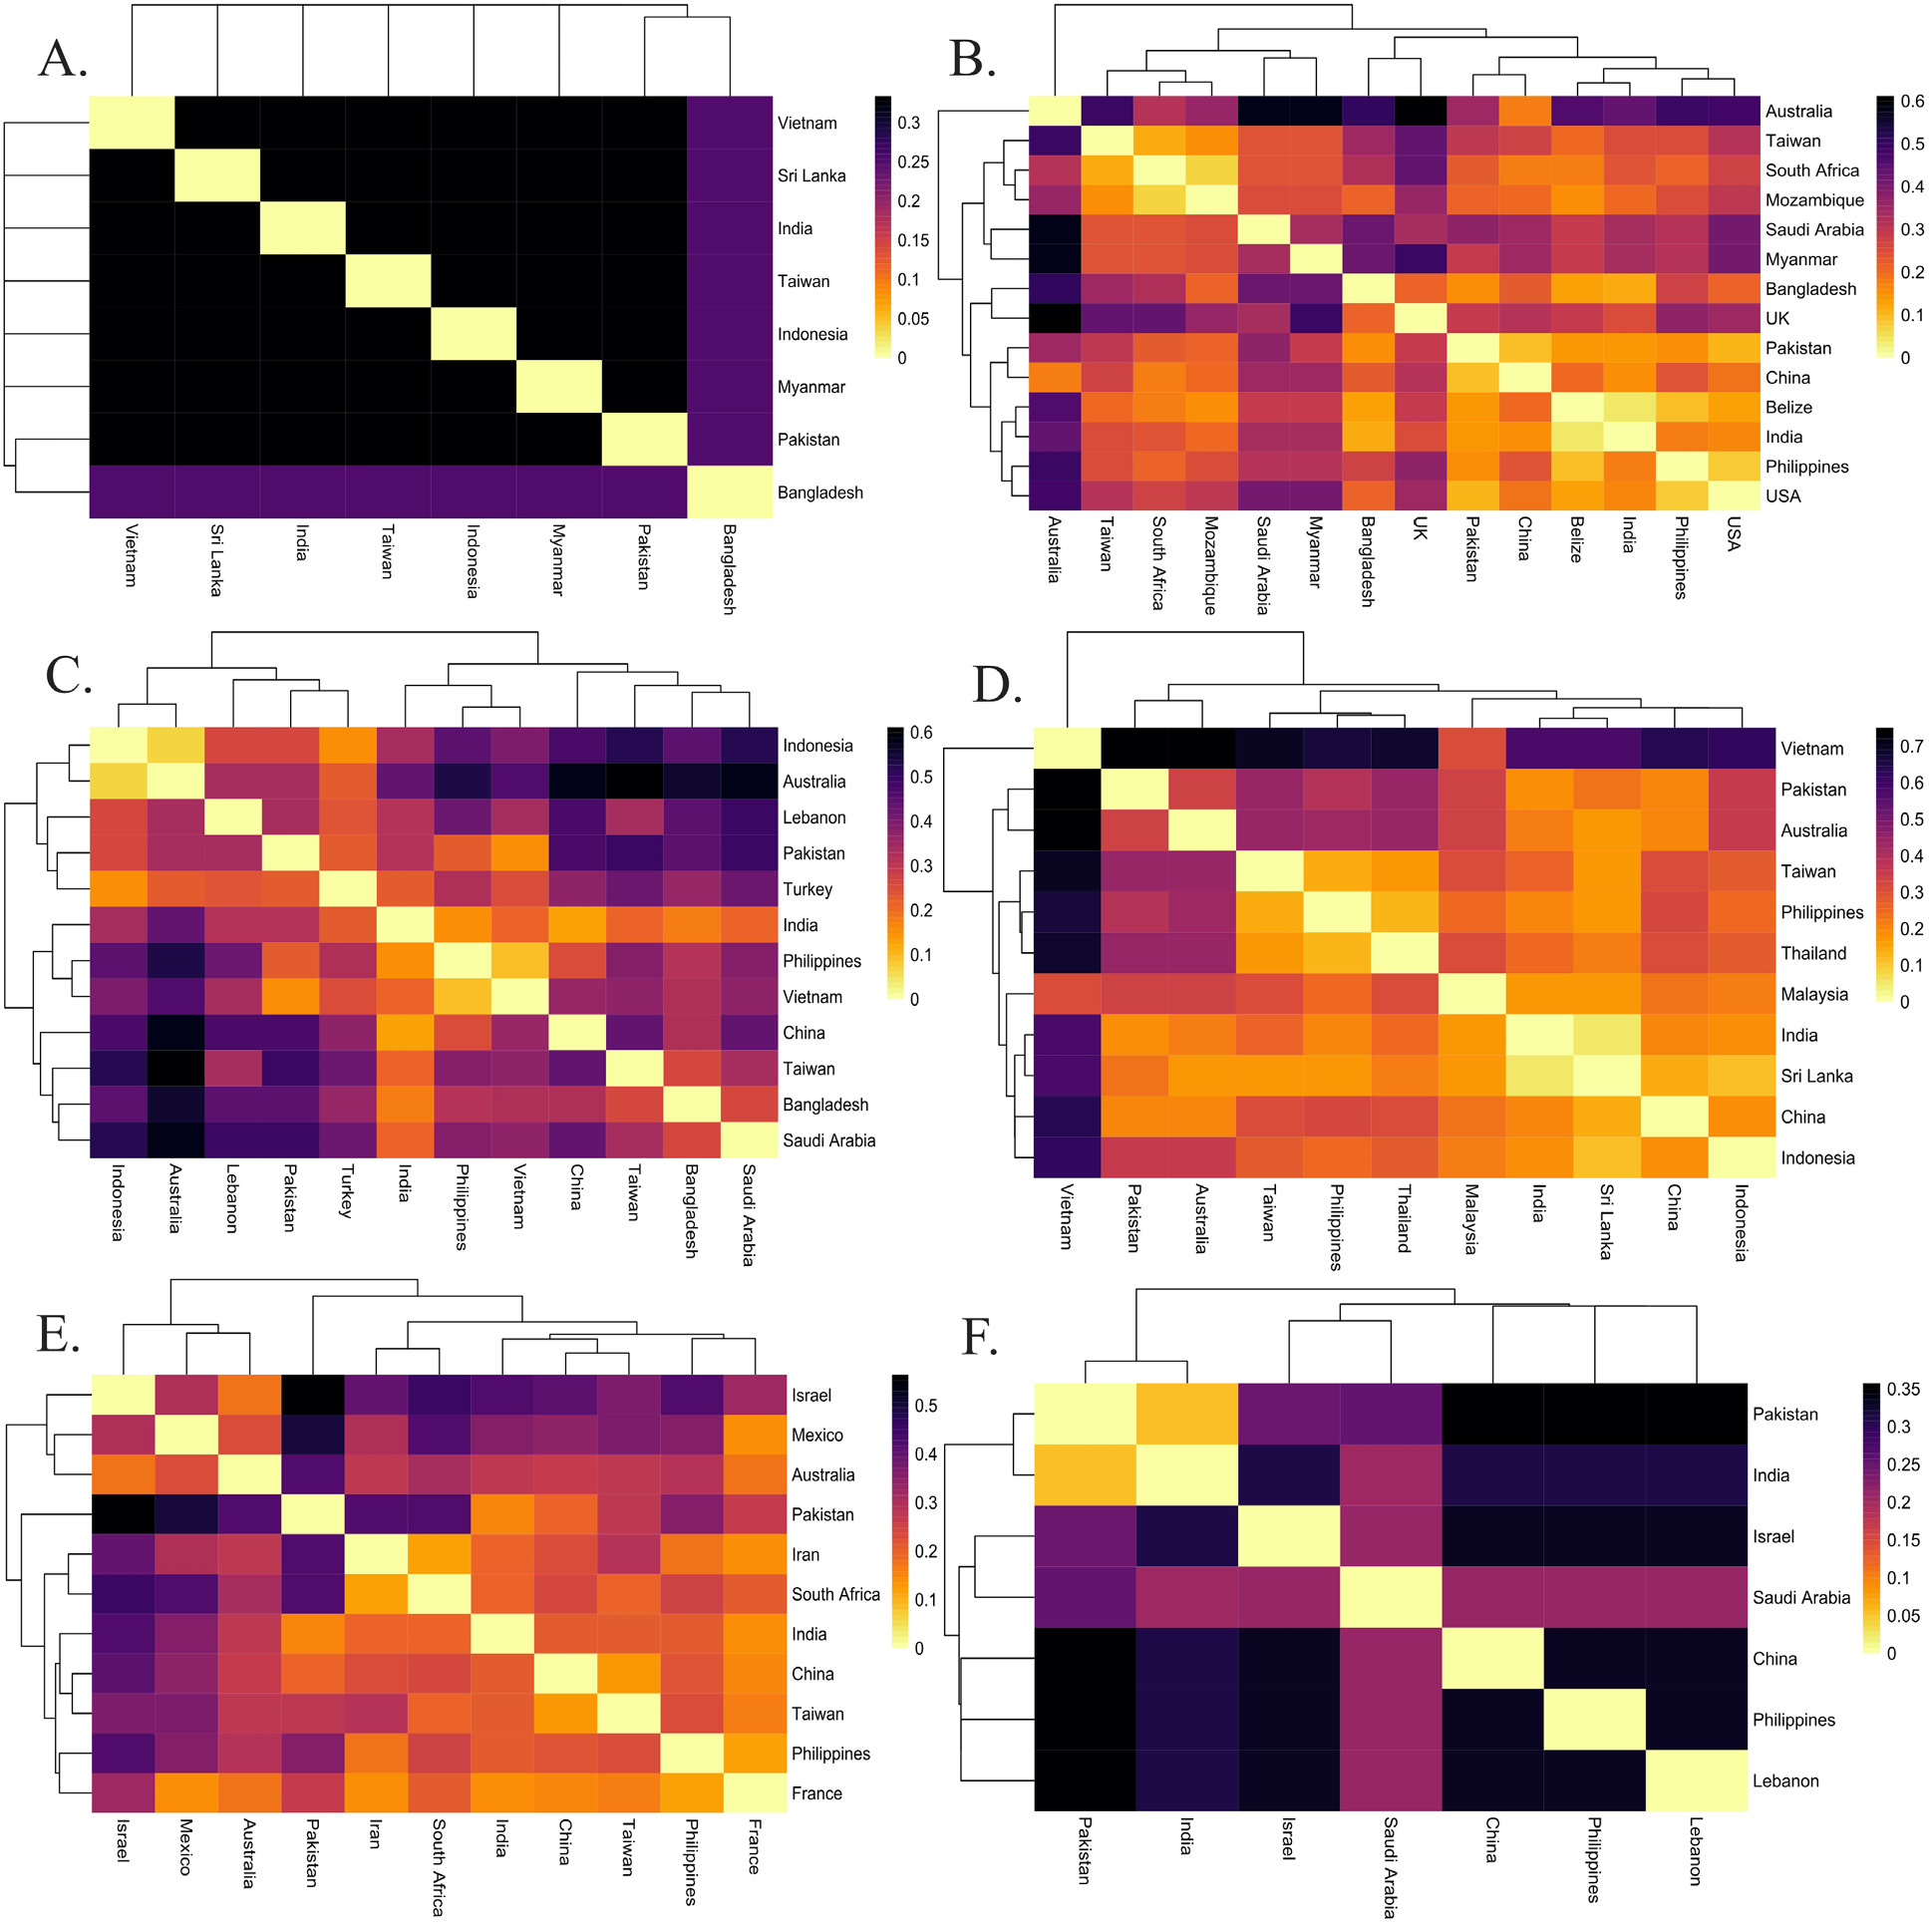
Heatmap illustration of Fst values (A). Chanos chanos (B). Drepane longimana (C). Lactarius lactarius (D). Myripristis botche (E). Pampus argenteus (F). Plotosus lineatus Heatmap chart is based on Fst analysis of sequence data of species population. The darker color shows high values and the light color shows fewer values from Fst.
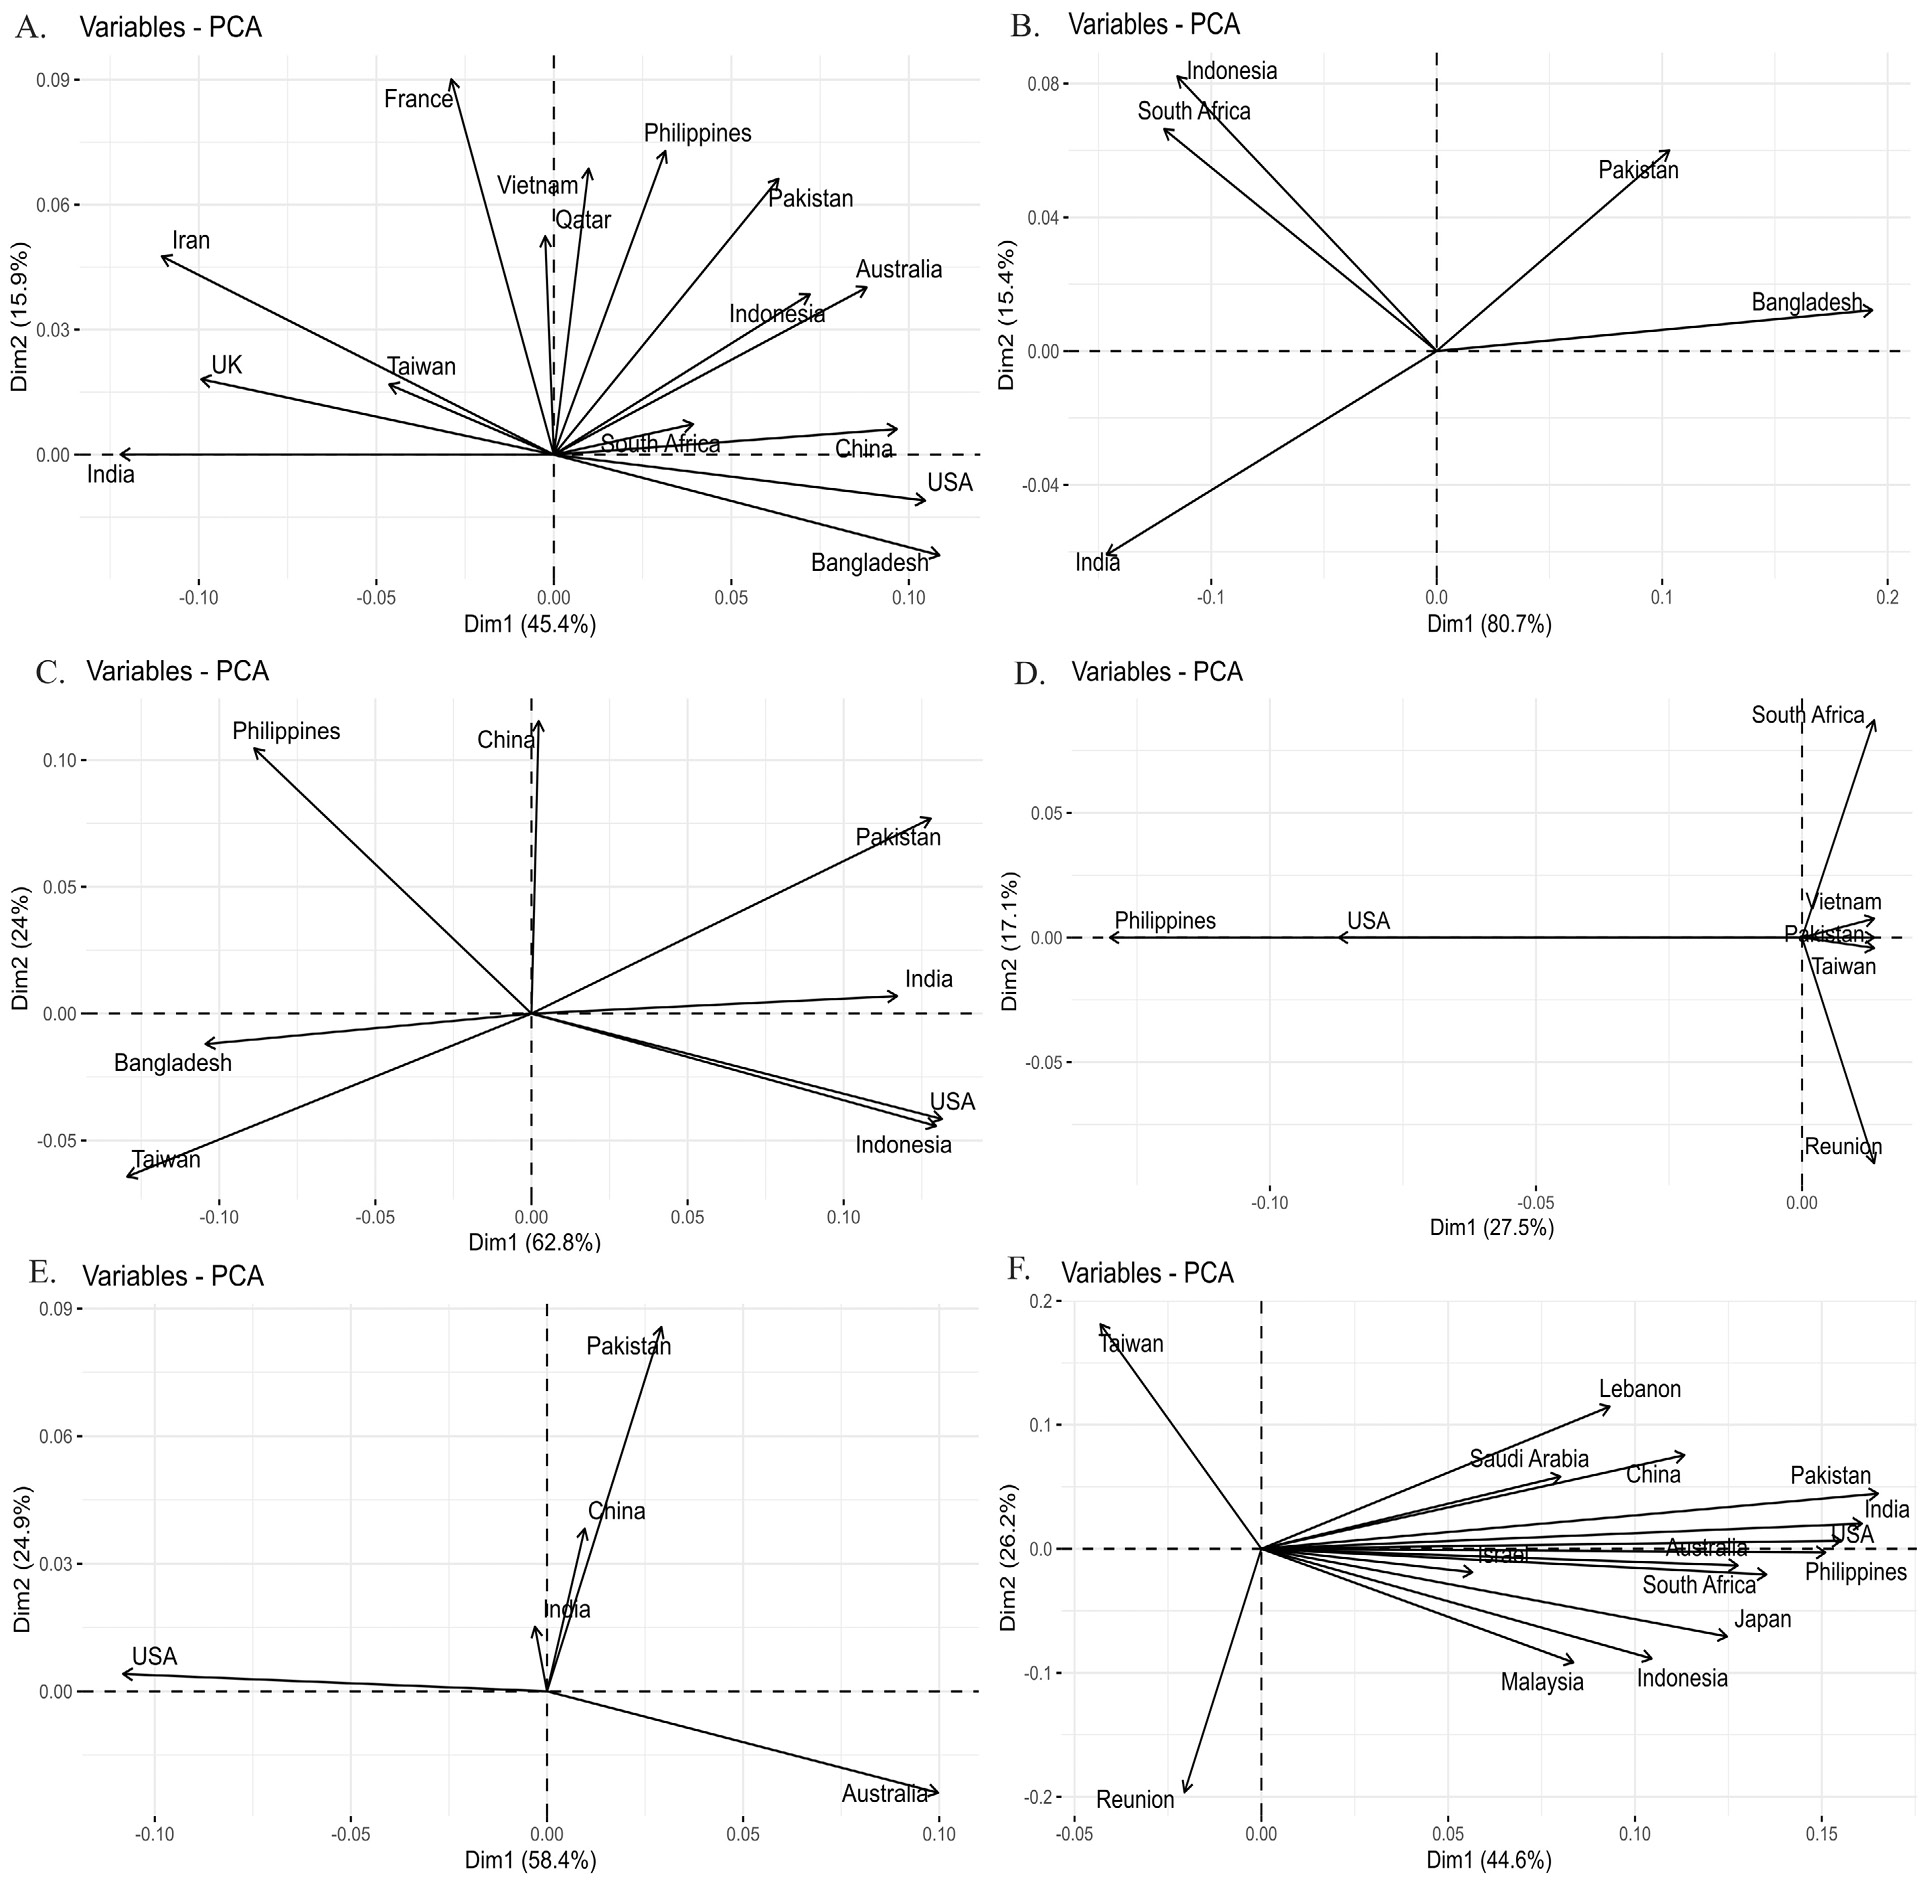
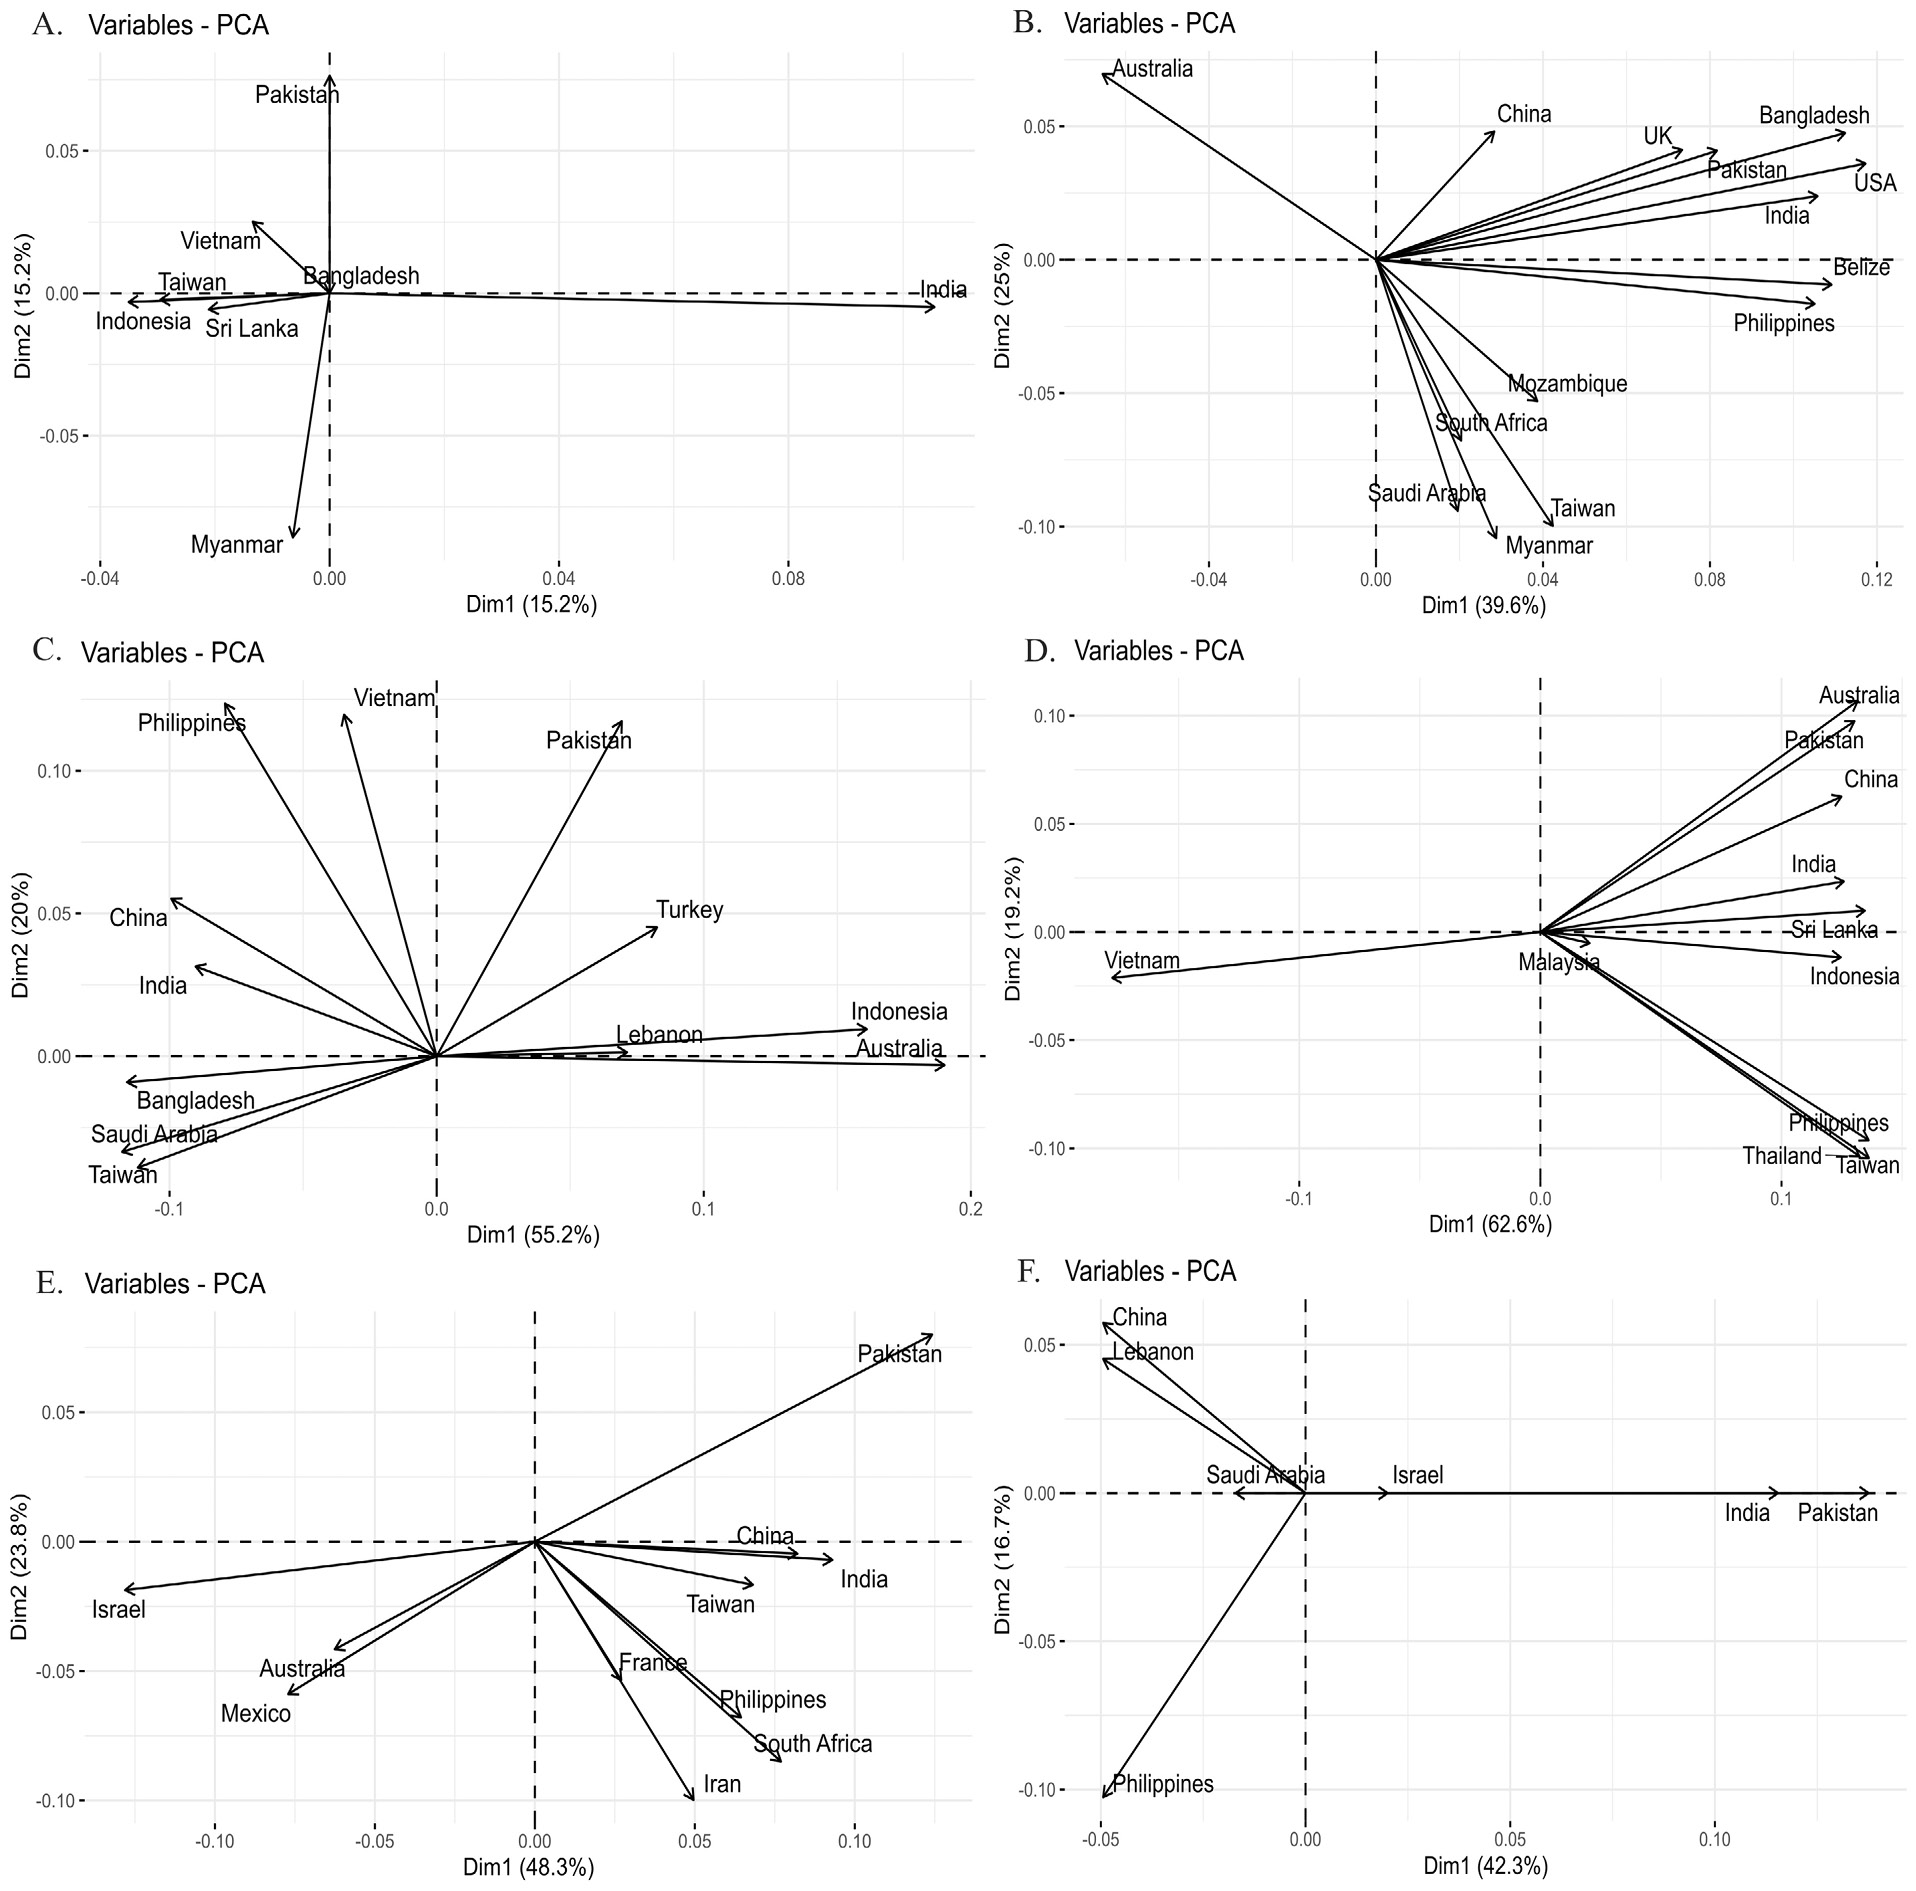
Principle component analysis of Fst values. (A). Chanos chanos (B). Drepane longimana (C). Lactarius lactarius (D). Myripristis botche (E). Pampus argenteus (F). Plotosus lineatus PCA is based on Fst analysis of sequence data of species population. Countries falling in one dimension have individuals more close to each other as compared to those falling in different dimensions.
Heatmap Illustration of Fst values. (A). Pomacanthus annularis (B). Rachycentron canadum (C). Sargocentron rubrum (D). Scatophagus Argus (E). Terapon jarbua (F). Terapon puta Heatmap chart is based on Fst analysis of sequence data of species population. The darker color shows high values and light color shows fewer values from Fst.
Principle component analysis of Fst values. (A). Pomacanthus annularis (B). Rachycentron canadum (C). Sargocentron rubrum (D). Scatophagus Argus (E). Terapon jarbua (F). Terapon puta PCA is based on Fst analysis of sequence data of species population. Countries falling in one dimension have individuals more close to each other as compared to those falling in different dimensions.
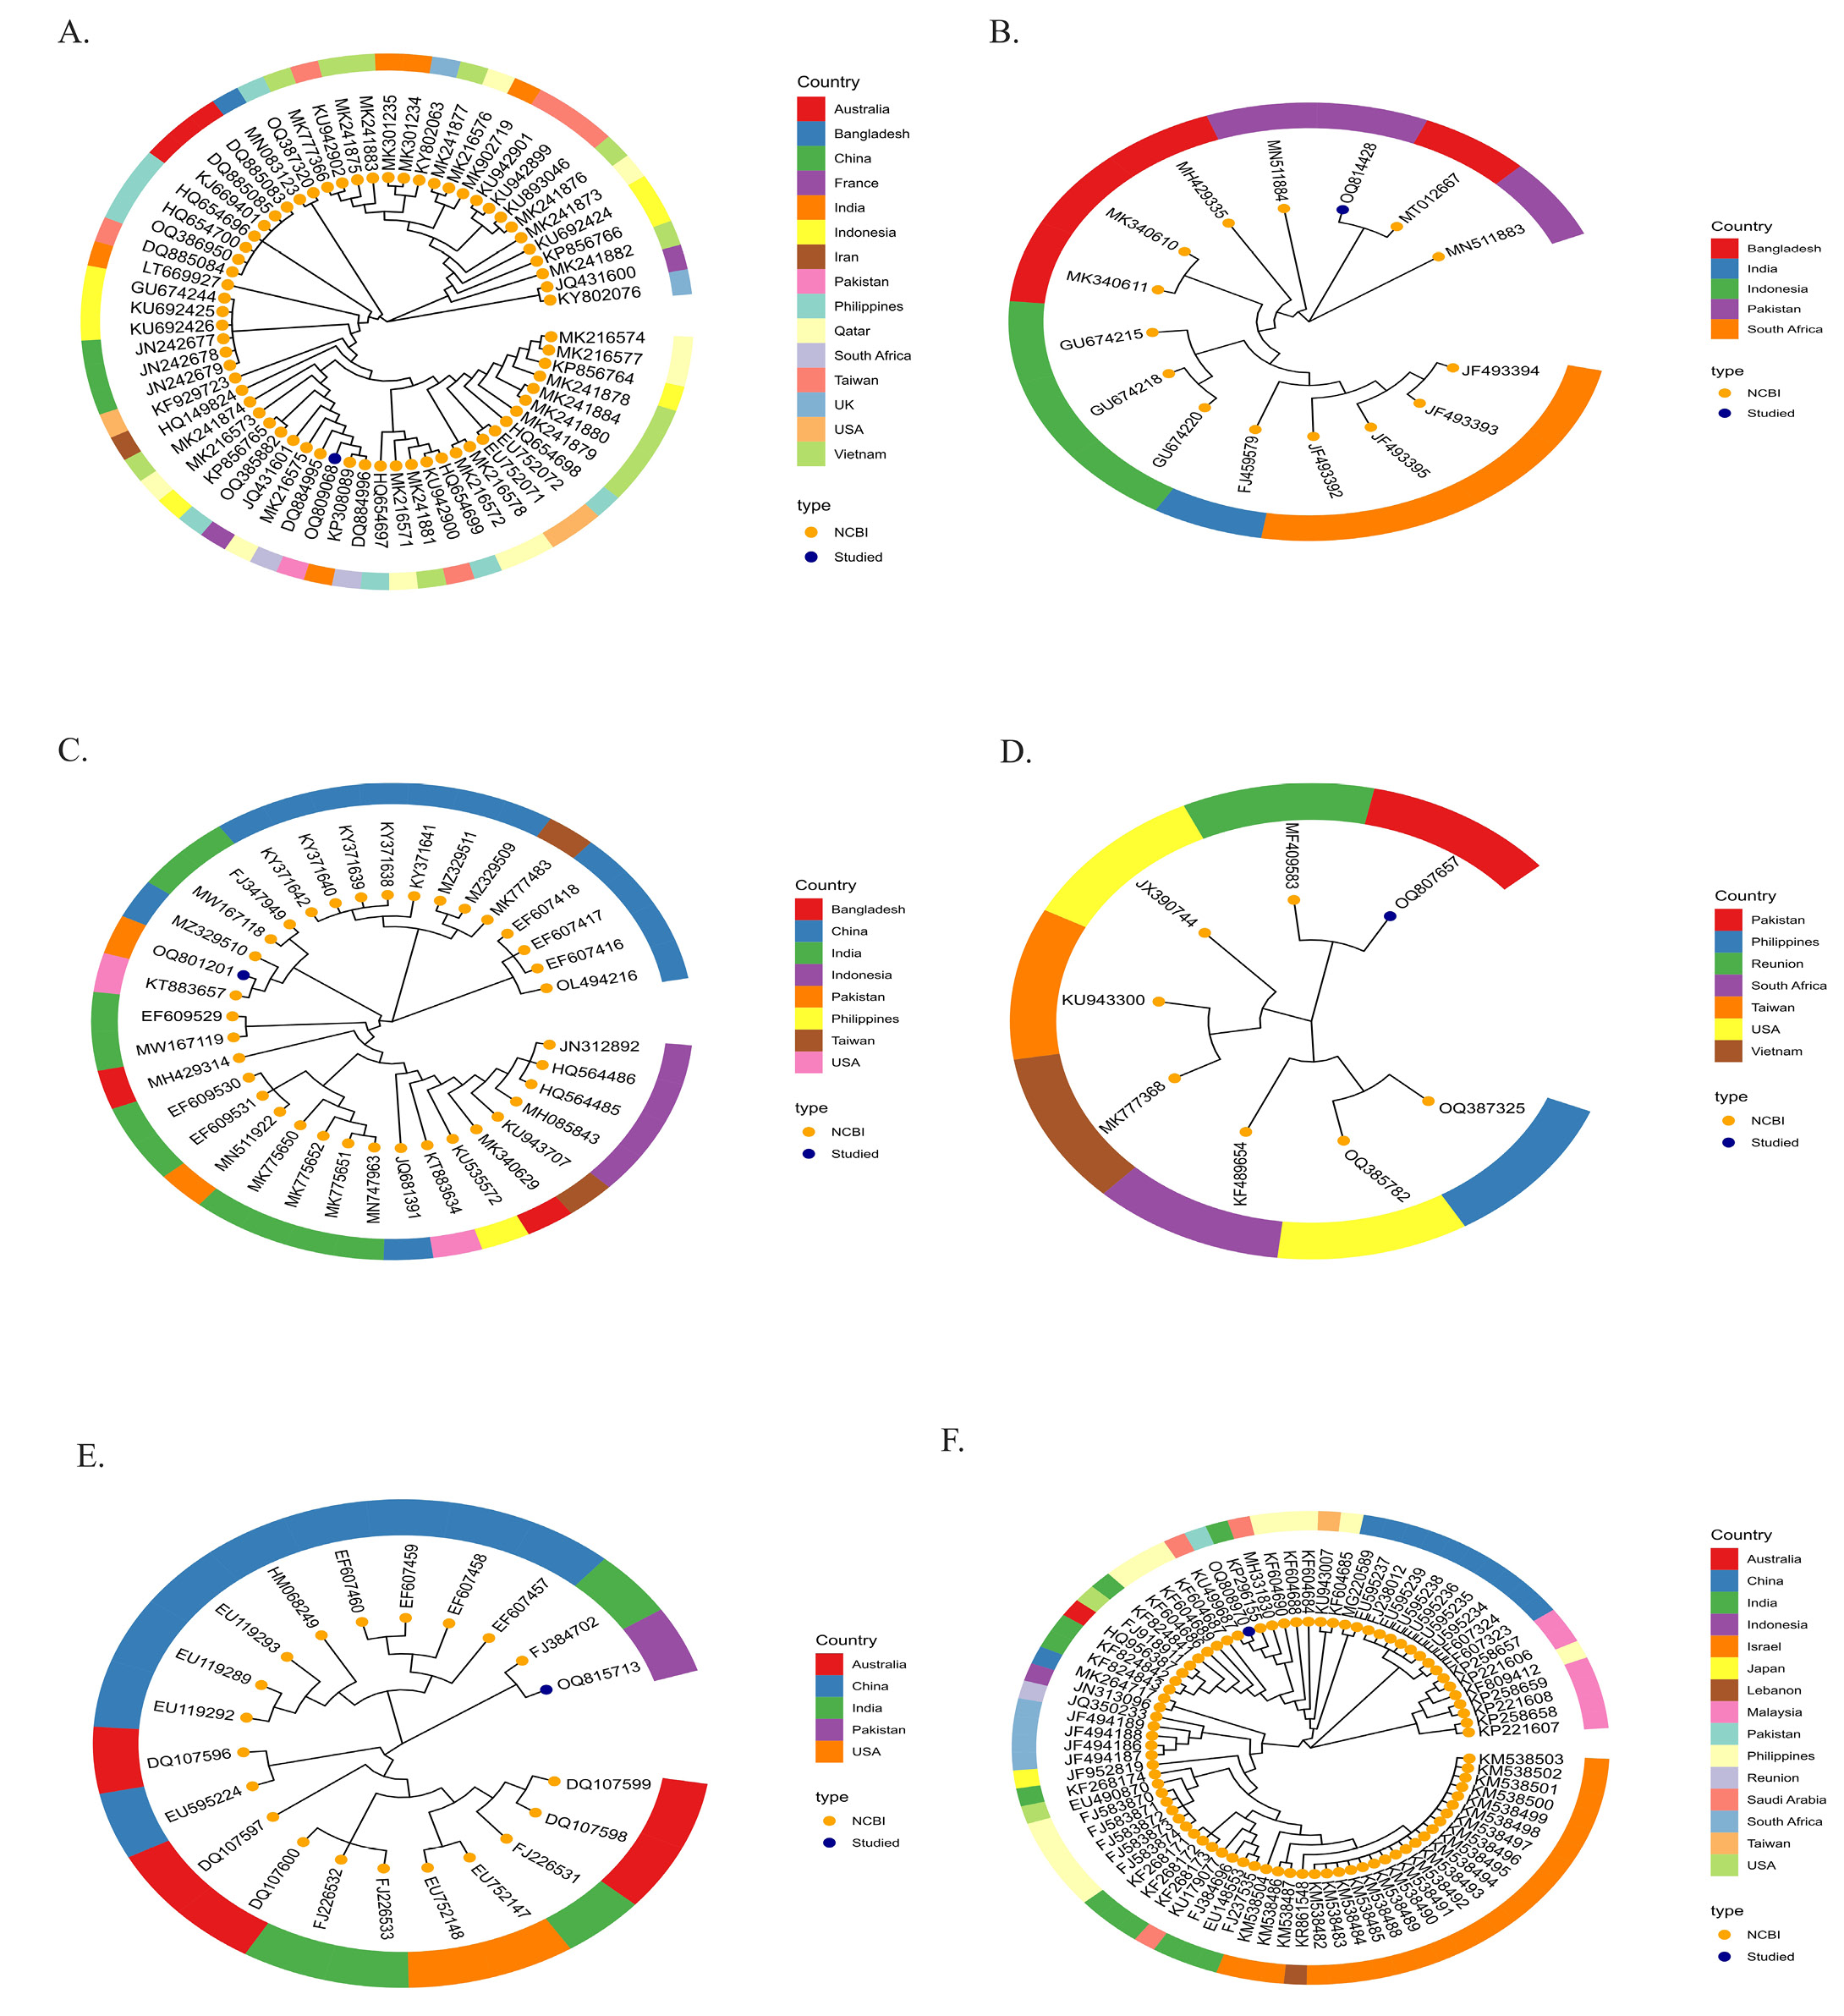
Species level phylogenetic relationship illustration of members occurring across the globe. (A). Chanos chanos (B). Drepane longimana (C). Lactarius lactarius (D). Myripristis botche (E). Pampus argenteus (F). Plotosus lineatus
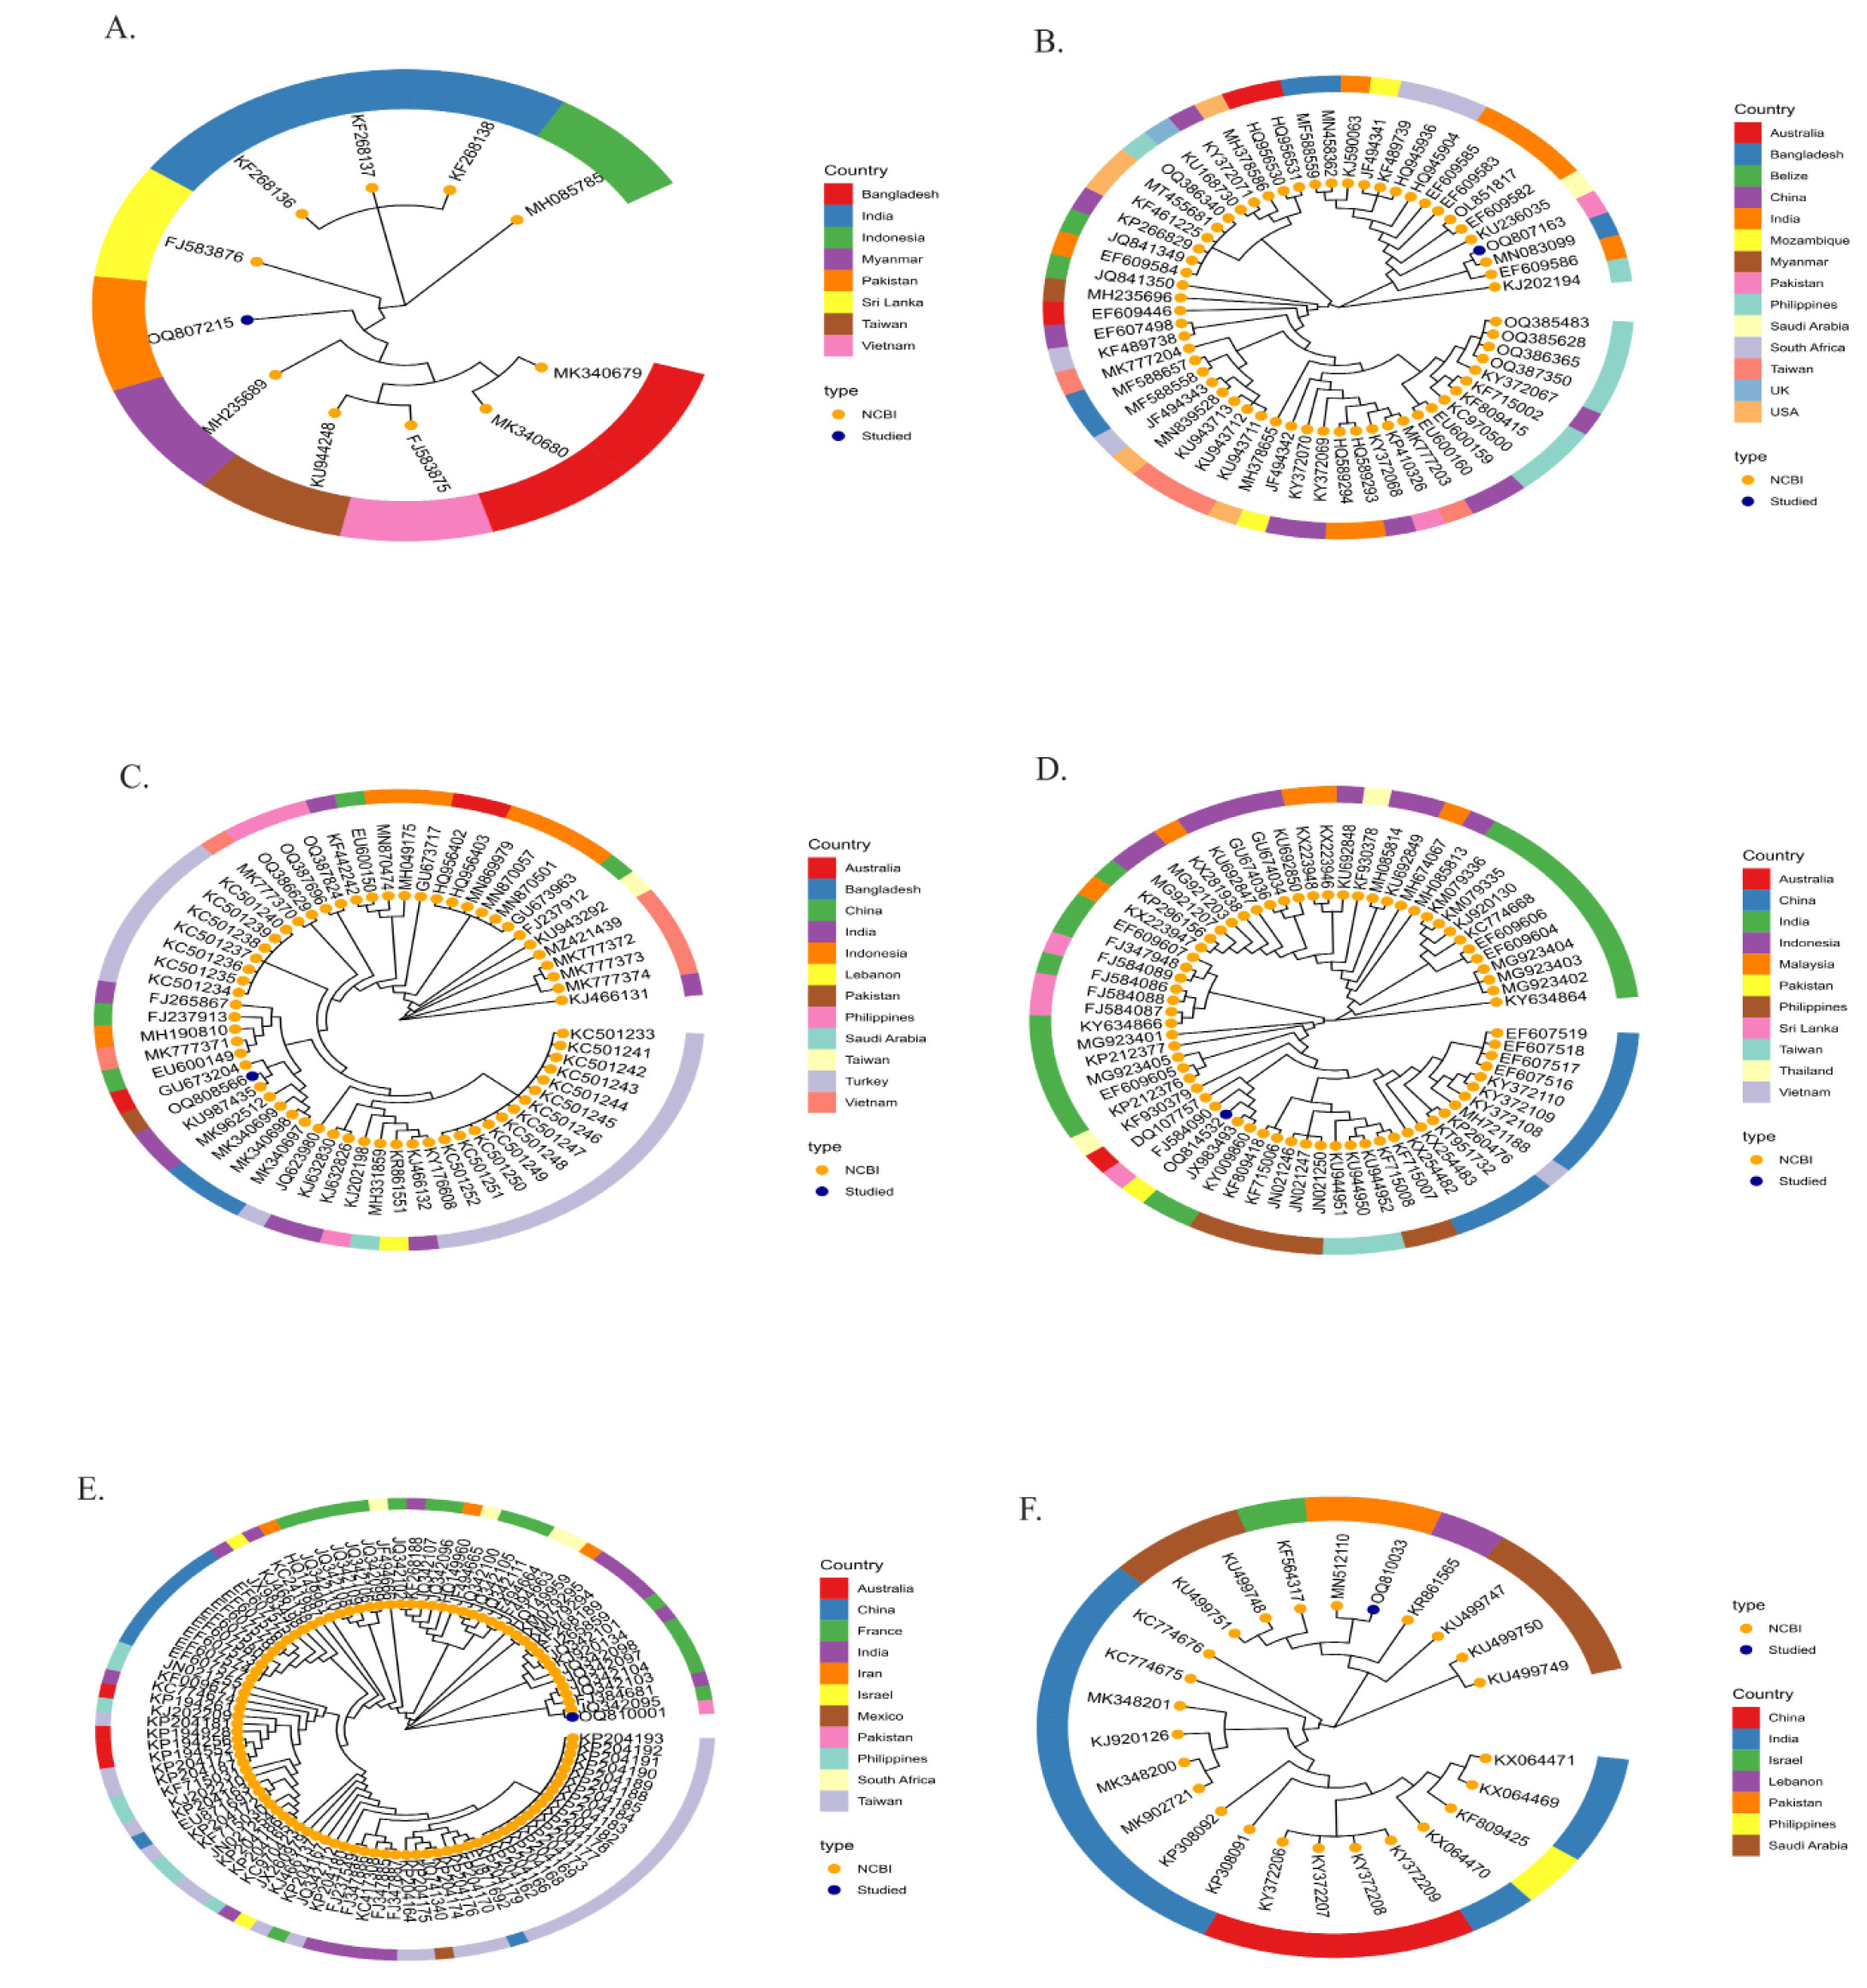
Species-level phylogenetic relationship illustration of members occurring across the globe (A). Pomacanthus annularis (B). Rachycentron canadum (C). Sargocentron rubrum (D). Scatophagus argus (E). Terapon jarbua (F). Terapon puta.
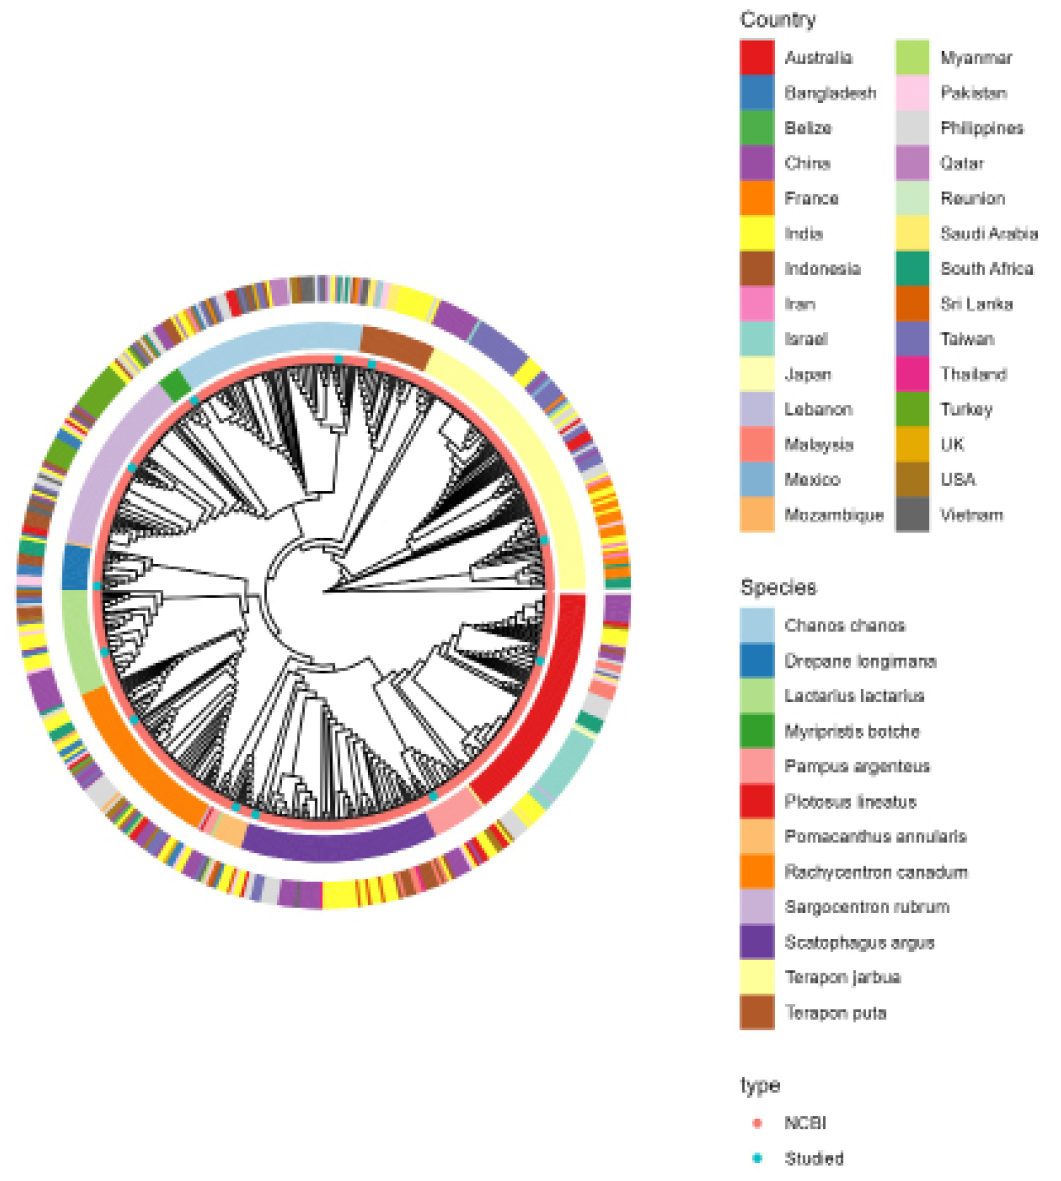
Phylogenetic relationship of all samples included in the study.
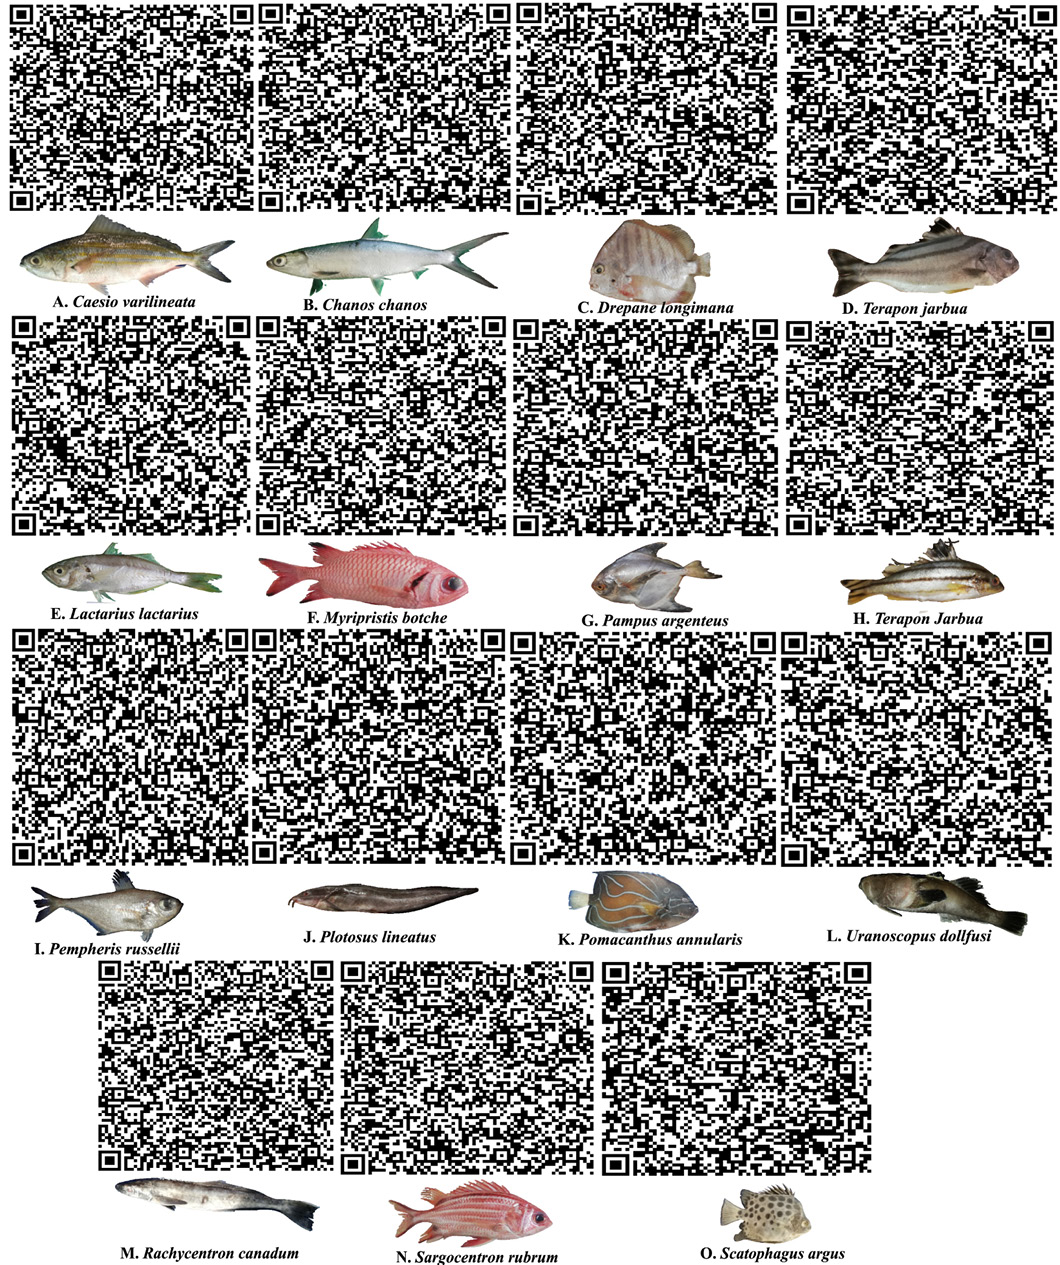
Specimen pictures together with QR codes that contain nucleotide information for each species.

