Offline analysis was performed using EchoPAC Clinical Workstation Software (EchoPAC Software, version 7.0.0, GE Vingmed Ultrasound A/S, Horten, Norway). Two-chamber setting for offline data analysis was applied. Early and late diastolic filling velocity quotient (E/A) was calculated for every defined myocardial segment. Additionally electro-mechanical coupling-periods, time intervals from onset Q in the electrocardiogram to peak myoca-
Table 1: Right parasternal long-axis view, gray scale analysis: right ventricular velocities (cm/s) of the individual segments (basal, mid, apical) in longitudinal and transverse planes in 6 healthy warmblood horses (group 1) compared to 6 asthmatic warmblood horses (group 2). Results were expressed as mean ± s.d, median, RMSCV % and P-value.
Group 1: control; Group 2: severe equine asthma; VL: longitudinal velocity; VT: transverse velocity; basRV: basal right ventricular segment; midRV: mid right ventricular segment; apRV: apical right ventricular segment; _S: systolic; _E: early diastolic; _A: late diastolic/atrial contraction; E/A: quotient of early diastolic and late diastolic/atrial contraction velocities; s.d.: standard deviation; P: value of significance; RMSCV: root mean square coefficient of variance.
Table 2: Right parasternal long-axis view, gray scale analysis: interventricular septum velocities (cm/s) of the individual segments (basal, mid, apical) in longitudinal and transverse planes in 6 healthy warmblood horses (group 1) compared to 6 asthmatic warmblood horses (group 2). Results were expressed as mean ± s.d, median, RMSCV % and P-value.
Group 1: control; Group 2: severe equine asthma; VL: longitudinal velocity; VT: transverse velocity; apIVS: apical interventricular septum segment; midIVS: mid interventricular septum segment; basIVS: basal interventricular septum segment; _S: systolic; _E: early diastolic; _A: late diastolic/atrial contraction; E/A: quotient of early diastolic and late diastolic/atrial contraction velocities; s.d.: standard deviation; P: value of significance; RMSCV: root mean square coefficient of variance.
Table 3: Right parasternal long-axis view, gray scale image analysis: right ventricle (RV) and the interventricular septum (IVS) strain (%) of the individual segments (bas, mid, apical) in longitudinal and transverse planes in 6 healthy warmblood horses (group 1) compared to 6 asthmatic horses (group 2). Results were expressed as mean ± s.d, median, RMSCV % and P-value.
Group 1: control; Group 2: severe equine asthma; SL: longitudinal strain %; ST: transverse strain %; basRV: basal right ventricular segment; midRV: mid right ventricular segment; apRV: apical right ventricular segment; apIVS: apical interventricular septum segment; midIVS: mid interventricular septum segment; basIVS: basal interventricular septum segment; s.d.: standard deviation; P: value of significance; RMSCV: root mean square coefficient of variance.
Table 4: Right parasternal long -axis view, gray scale image analysis: right ventricular strain rate (1-s) of the individual segments (basal, mid, apical) in longitudinal and transverse planes in 6 healthy horses (group 1) compared to 6 asthmatic horses (group 2). Results were expressed as mean ± s.d, median, RMSCV % and P-value.
Group 1: control; Group 2: severe equine asthma; SrL: longitudinal strain rate; SrT: transverse strain rate; basRV: basal right ventricular segment; midRV: mid right ventricular segment; apRV: apical right ventricular segment; _S: systolic; _E: early diastolic; _A: late diastolic/atrial contraction; s.d.: standard deviation; P: value of significance; RMSCV: root mean square coefficient of variance.
Table 5: Right parasternal long -axis view, gray scale image analysis: interventricular septum strain rate (1-s) of the individual segments (basal, mid, apical) in longitudinal and transverse planes in 6 healthy horses (group 1) compared to 6 asthmatic horses (group 2). Results were expressed as mean ± s.d, median, RMSCV % and P-value.
Group 1: control; Group 2: severe equine asthma; SrL: longitudinal strain rate; SrT: transverse strain rate; apIVS: apical interventricular septum segment; midIVS: mid interventricular septum segment; basIVS: basal interventricular septum segment; _S: systolic; _E: early diastolic; _A: late diastolic/atrial contraction; s.d.: standard deviation; P: value of significance; RMSCV: root mean square coefficient of variance.
Table 6: Right parasternal long-axis view, gray scale image analysis: Longitudinal and transverse right ventricle (RV) and the interventricular septum (IVS) displacement (mm) of the individual segments (bas, mid, apical) in 6 healthy warmblood horses (group 1) compared to 6 asthmatic horses (group 2). Results were expressed as mean ± s.d, median, RMSCV % and P-value.
Group 1: control; Group 2: severe equine asthma; DL: longitudinal displacement mm; DT: transverse displacement mm; basRV: basal right ventricular segment; midRV: mid right ventricular segment; apRV: apical right ventricular segment; apIVS: apical interventricular septum segment; midIVS: mid interventricular septum segment; basIVS: basal interventricular septum segment; s.d.: standard deviation; P: value of significance; RMSCV: root mean square coefficient of variance.
rdial events, were measured manually. The endocardium was tracked manually where region of interest (ROI) was placed on the myocardium manually clockwise starting at the interventricular septum. Tracking speckles was started automatically dividing the right ventricular free wall and interventricular septum into equal 3 segments each (basRV, midRV, apRV, apIVS, midIVS, basIVS), the software analysed the velocities, strain, strain rate and displacement. The region of interest was adjusted at a maximum width to assess the myocardium (Figure 1).
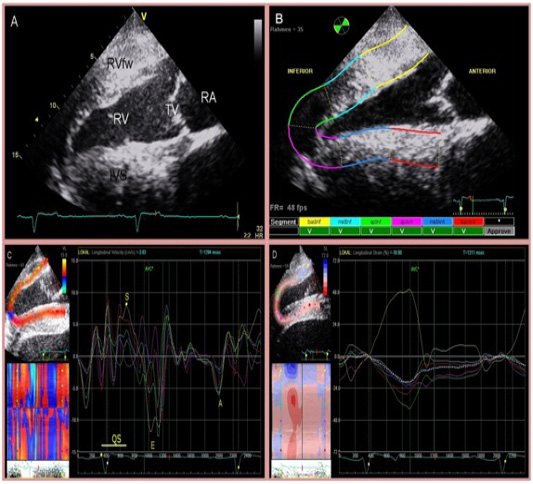
Figure 1: Four chamber view of the heart (A) and two-dimensional speckle tracking analysis (B). The right side of the image is cranial. Inferior is referred to as RV and anterior as IVS. The region of interest is manually divided into 6 segments starting at the IVS. Tracking quality is verified by the software and approved segments are marked with ‘V’. Segmental curves for long-axis images show the longitudinal velocity (C), and the longitudinal strain % (D). On the left, a greyscale image is displayed showing the tracked ROI. On the right, the segmental traces are displayed. The vertical axis represents values of the selected variable; the horizontal axis shows time (ms).

