Introduction
Adipose tissues produce the protein hormone leptin (LEP), which primarily controls hunger and energy usage by interacting with the leptin receptor (LEPR). Leptin plays a role in the abnormal functioning of energy metabolism ; . Leptin has a crucial role in regulating various processes like reproduction, bone formation, blood cell generation, blood vessel formation, and hormone production. Additionally, it also regulates blood pressure and reproductive functions. Leptin is mainly found in adipose tissue, although it has also been detected in the brain, muscles, and the gastrointestinal tract . Insulin, cortisol, and IL-1b regulate the expression of leptin in normal physiological conditions when there is inflammation. Leptin plays a crucial role in the healing process by restoring balance and normal functioning of the body. Leptin has a substantial impact on inflammation through a wide range of metabolic effects, such as enhancing the absorption of glucose and the oxidation of fatty acids . However, inflammation can often continue for a long time and might hinder the immune system’s functioning, leading to disturbances in homeostasis and the emergence of chronic pathogenic diseases such as chronic inflammation (Pérez et al., 2020). Prostate cancer (PCa) is widely reported as one of the most frequently diagnosed forms of cancer, accounting for 3.8% of cancer-related deaths worldwide and 7.1% of newly identified cases of all cancers. Prostate cancer (PCa) is associated with characteristics such as increasing age, elevated levels of androgens, being overweight or obese, and other risk factors . According to reports, the use of leptin treatment has been found to enhance the growth and spread of DU145 cells while reducing cell death through the activation of ERK1/2 signalling in prostate cancer . The influence of leptin on the advancement of prostate cancer was examined using the DU-145 and PC3 cell lines. Leptin therapy seems to enhance the movement and transformation of cancer cells by activating the STAT3 pathway . Studies on human gallbladder cancer have found that the development of the illness is greatly affected by the activation of the leptin-leptin receptor signalling pathway. Cell growth is stimulated by leptin through the activation of the leptin receptor, making this situation . Leptin reduced the harmful effects caused by bortezomib therapy in myeloma cells. Concurrently, there was an elevation in the levels of cyclin D1 and Bcl-2 proteins, whereas the activity of caspase 3 decreased. Leptin has been found to have a significant impact on the production and release of VEGF-C in chondrosarcoma. This, in turn, promotes the growth of lymphatic vessels in human lymphatic endothelial cells by blocking the action of miR-27b . A study on chondrosarcoma cells indicated the modulation of tube formation in endothelial progenitor cells through leptin-dependent mechanisms. The activation of the leptin-leptin receptor signalling pathway in cancer cells resulted in the stimulation of MAPK signalling. As a consequence, AP-1 was able to attach to the VEGF-A promoter and begin the process of transactivation . In addition, a correlation analysis demonstrated a substantial positive link between the concentrations of leptin and leptin receptors and the occurrence of lymph node metastases in individuals diagnosed with endometrial cancer. A study was conducted with the aim of reducing the spread of cancer through the action of leptin. Adiponectin was found to prevent the spread of SPEC-2 endometrial cancer caused by leptin by activating AMPK, which inhibits the JAK/STAT3 pathway .
Methodology
The research population consisted of seventy guys, all of whom were enrolled between January 2023 and August 2023. All participants were properly informed of the purpose of our research.The participants were categorised into two groups based on their BMI and age, and each group was assigned a specific diagnosis. The initial cohort, referred to as the PCa group, consists of 35 male patients who have received definitive confirmation of their condition. The control group, consisting of 35 healthy men, was recruited from the outpatient clinic by attending males who had the same ethnic background as the patients. Patients who were not included in our cohort were those who had acute urinary tract infections, chronic prostatitis, a previous history of urogenital malignancies, or chronic renal disease. All individuals had thorough history-taking as well as general and local clinical examinations. The study included patients who were diagnosed with prostate cancer using histology and were recruited through the urology department. Before any treatment interventions (such as surgery, hormone therapy, radiation, and others), blood samples were obtained. The BMI was calculated by dividing the weight in kilogrammes by the square of the height in metres. 10 mL of venous blood was taken into two tubes: one tube containing EDTA and one standard vacutainer tube. The two tubes were used to measure the levels of serum total PSA (TPSA) and leptin, respectively. The serum levels of leptin and tPSA were measured using an enzyme-linked immunosorbent assay (ELISA).
Statistical analysis
The data was gathered using Microsoft Excel and then analysed using version 26.0 of the Statistical Package for the Social Sciences Software (SPSS, Inc., IBM Corporation). A Shapiro-Wilk test was conducted to assess the normality of the data. An analysis of variance (ANOVA) was used to investigate the variation among different groups. Subsequently, Tukey’s post-hoc test was utilised to evaluate this variation. A p-value below the specified significance level of 0.05 was deemed statistically significant.
Results
Socio-demographic characteristics of the patient group and the control group
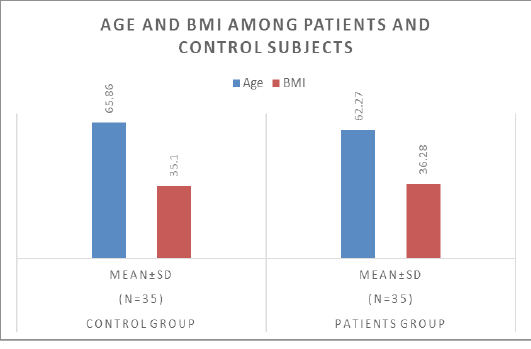
In the comparative study that dealt with the effect of specific variables between two groups, the results were as follows: Regarding age, the average age of the control group was 65.86 years with a standard deviation of 6.20, while the patient group recorded an average age of 62.27 years with a standard deviation of 6.48, and these differences did not show statistical significance. The P value was greater than 0.05. As for the body mass index (BMI), its average for the control group was 35.10 with a standard deviation of 6.77, compared to 36.28 with a standard deviation of 6.99 for the patient group. These results were also not statistically significant (P > 0.05). These data indicate that the difference in age and BMI between the two groups is not statistically significant in this research sample.
Table 1: Age and BMI among patients and control subjects
| Parameters | Control group (n=35) Mean±SD | Patients group (n=35) Mean±SD | P. value |
| Age | 65.86 ± 6.20 | 62.27 ± 6.48 | >0.05NS |
| BMI | 35.10 ± 6.77 | 36.28 ± 6.99 | >0.05NS |
Difference in levels of fasting glucose, prostate sensitive antigen, and leptin between patients and the control group.
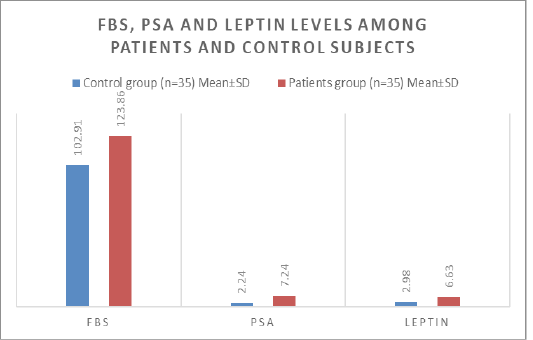
In analysing the results for the three variables included in the study, comparing the control group and the patient group, the following information is provided: The control group had a mean fasting glucose level (FBS) of 102.91 mg/dL, with a standard deviation of 9.30. Conversely, the group that was administered a dosage of 123.86 mg/dL exhibited a standard deviation of 17.66. In the patient group, this represented significant statistical significance (P < 0.001). As for the level of prostate-specific antigen (PSA), its average was 2.24 ng/ml with a standard deviation of 0.76 for the control group compared to 7.24 ng/ml with a standard deviation of 0.97 for the patient group, confirming statistical significance (P < 0.001). Finally, looking at leptin levels, a reading of 2.98 ng/ml with a standard deviation of 0.87 was recorded for the control group, compared to 6.63 ng/ml with a standard deviation of 1.18 for the patient group, with strong statistical significance (P < 0.001). These results show significant differences between the two groups in all three variables mentioned above.
Table 2: FBS, PSA and leptin levels among patients and control subjects
| Parameters | Control group (n=35) Mean±SD | Patients group (n=35) Mean±SD | P. value |
| FBS | 102.91 ± 9.30 | 123.86 ± 17.66 | <0.001 |
| PSA | 2.24 ± 0.76 | 7.24 ± 0.97 | <0.001 |
| Leptin | 2.98 ± 0.87 | 6.63 ± 1.18 | <0.001 |
Difference in lipid levels between patients and the control group.
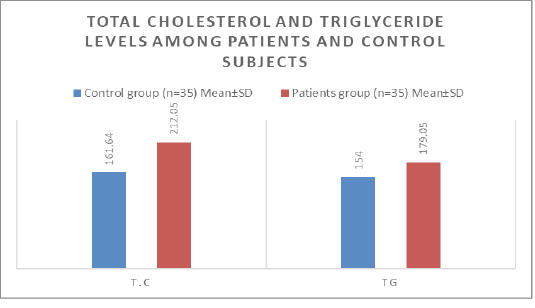
The obtained data show statistically significant differences between the control group and the patient group regarding the levels of total cholesterol (T.C.) and triglycerides (TG). For total cholesterol levels, the average in the control group was 161.64 mg/dL with a standard deviation of 23.08; on the other hand, the patient group had a measured value of 212.05 mg/dL with a standard deviation of 17.33. This result indicates a statistically significant difference (P < 0.001). The control group had a mean triglyceride level of 154.00 mg/dL, with a standard deviation of 28.38. Conversely, the group of patients had an average of 179.05 mg/dL with a standard deviation of 19.95. These differences represent statistical significance (P < 0.01). These differences reflect important and significant changes between the two segments studied in the study.
Table 3: Total cholesterol and triglyceride levels among patients and control subjects
| Parameters | Control group (n=35) Mean±SD | Patients group (n=35) Mean±SD | P. value |
| T.C | 161.64 ± 23.08 | 212.05 ± 17.33 | <0.001 |
| TG | 154.00 ± 28.38 | 179.05 ± 19.95 | <0.01 |
Difference in liver function (GPT, GOT) levels between patients and the control group.
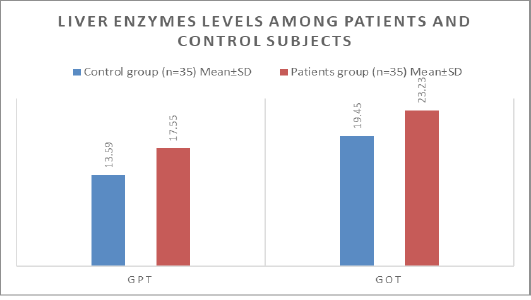
Results regarding levels of the liver enzymes glutamic pyruvate transaminase (GPT) and glutamic oxaloacetic transaminase (GOT) show that for the GPT enzyme, the mean in the control group is 13.59 U/L with a standard deviation of 3.59, while the mean in the patient group is 17.55 U/L with a standard deviation of 4.52. The differences between the two groups showed statistical significance (P < 0.01), which means that the increase in GPT levels for the patient group is considered statistically significant. For the GOT enzyme, the mean values in the control group were 19.45 U/L with a standard deviation of 6.55, while in the patient group it was 23.23 U/L with a standard deviation of 6.78. In this case, the statistical value (P value) was greater than 0.05 and was not marked as statistically significant (NS no significant), indicating that the observed differences were not statistically significant.
Table 4: Liver enzymes levels among patients and control subjects
| Parameters | Control group (n=35) Mean±SD | Patients group (n=35) Mean±SD | P. value |
| GPT | 13.59 ± 3.59 | 17.55 ± 4.52 | <0.01 |
| GOT | 19.45 ± 6.55 | 23.23 ± 6.78 | >0.05NS |
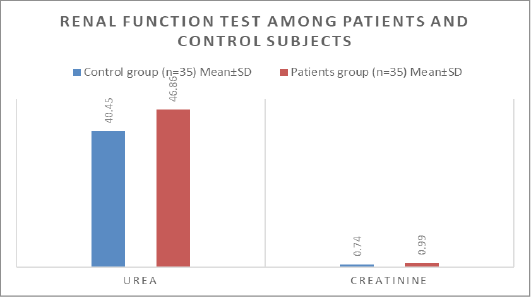
The difference in levels of kidney function (Urea, Creatinine) between patients and the control group.
The levels of urea and creatinine in the blood, which are important indicators of kidney function, were analyzed. The control group had a mean value of 40.45 mg/dL for urea, with a standard deviation of 5.83. Conversely, the group of patients obtained an average measurement of 46.86 mg/dL, accompanied by a standard deviation of 6.84. This difference in urea level is statistically significant (P < 0.01). As for creatinine levels, they had an average of 0.74 mg/dL with a standard deviation of 0.19 for the control group, while the patient group presented a higher average of 0.99 mg/dL with a standard deviation of 0.18. The difference here indicates very strong statistical significance (P < 0.001).
Table 5: Renal function test among patients and control subjects.
| Parameters | Control group (n=35) Mean±SD | Patients group (n=35) Mean±SD | P. value |
| Urea | 40.45 ± 5.83 | 46.86 ± 6.84 | <0.01 |
| Creatinine | 0.74 ± 0.19 | 0.99 ± 0.18 | <0.001 |
Pearson Corylation among all biomarkers included in the study.
The statistical relationships between the various variables in the study are shown through the Pearson correlation coefficient and the two-tailed indicative values (Sig. (2-tailed). The results show that the body mass index (BMI) was not statistically significantly associated (.269) with the age of the participants (P =.226). The values indicate a statistically significant inverse relationship between the body mass index (BMI) and the prostate-specific antigen (PSA) level (-.429, P=.046), which indicates an increase in the PSA value with a decrease in BMI. Fasting blood sugar (FBS) and total cholesterol (TC) values were not statistically significantly related to age (.172 and.262, respectively), with P values of.444 and.239. There was a statistically significant positive correlation between triglyceride (TG) levels and total cholesterol (.452, P=.035). The relationship between the liver enzymes GPT and GOT and the rest of the variables did not show significant statistical significance. As for creatinine, a statistically significant inverse relationship with BMI appeared (-.470, P=.027), which means that the level of creatinine decreased with an increase in BMI. Urea also showed a statistically significant positive relationship with both age and fasting blood sugar (FBS) levels (.478 and.536, respectively), with P values of.024 and.010. It was found that there was a statistically significant inverse relationship between leptin and PSA (-.436, P =.042) and a significant positive relationship between leptin and CREA
(.661, P =.001), while the relationship was stronger and inverse with GPT (-.555, P =.007).
Table 6: Correlation of study parameters with each other in patients group
| Parameters | Age | BMI | PSA | FBS | TC | TG | GPT | GOT | CREA | UREA | |
| BMI | Pearson Correlation | .269 | |||||||||
| Sig. (2-tailed) | .226 | ||||||||||
| PSA | Pearson Correlation | -.216 | -.429* | ||||||||
| Sig. (2-tailed) | .334 | .046 | |||||||||
| FBS | Pearson Correlation | .172 | -.278 | .328 | |||||||
| Sig. (2-tailed) | .444 | .211 | .136 | ||||||||
| TC | Pearson Correlation | .262 | .182 | -.458* | -.262 | ||||||
| Sig. (2-tailed) | .239 | .419 | .032 | .238 | |||||||
| TG | Pearson Correlation | -.023 | .375 | -.255 | -.195 | .452* | |||||
| Sig. (2-tailed) | .918 | .085 | .253 | .384 | .035 | ||||||
| GPT | Pearson Correlation | .146 | -.177 | .160 | -.147 | .241 | .354 | ||||
| Sig. (2-tailed) | .518 | .430 | .476 | .514 | .280 | .106 | |||||
| GOT | Pearson Correlation | .011 | .026 | .072 | -.134 | -.227 | .112 | .021 | |||
| Sig. (2-tailed) | .960 | .907 | .751 | .554 | .309 | .620 | .928 | ||||
| Creatinine | Pearson Correlation | .238 | -.470* | .152 | .385 | -.066 | -.151 | .067 | .064 | ||
| Sig. (2-tailed) | .287 | .027 | .500 | .077 | .770 | .504 | .767 | .776 | |||
| Urea | Pearson Correlation | .478* | -.085 | .153 | .536* | .033 | .123 | -.005 | .021 | .661** | |
| Sig. (2-tailed) | .024 | .708 | .496 | .010 | .885 | .586 | .982 | .927 | .001 | ||
| Leptin | Pearson Correlation | -.343 | .157 | -.436* | -.238 | .173 | -.250 | -.555** | -.232 | -.149 | -.226 |
| Sig. (2-tailed) | .119 | .486 | .042 | .286 | .442 | .261 | .007 | .299 | .508 | .311 | |
Discussion
The given input is a list containing the elements ; . Multiple studies have investigated the association between leptin, body fatness, and prostate cancer. An association has been found between higher levels of leptin, specific prostatic antigen, and testosterone in patients with CaP compared to the control group and individuals with benign prostate hyperplasia . Chang et al. discovered a positive connection between elevated leptin levels and the growth of bigger tumours. Empirical evidence suggests that the impact of leptin varies depending on the stages of CaP. Saglam et al. found a strong correlation between higher levels of leptin and a more advanced stage of the disease, as well as a poorly differentiated tumour. Leptin may impact the likelihood of clinically detectable CaP through factors associated with obesity . The research conducted by Hsing et al. found that there is a correlation between leptin levels and the risk of developing CaP. However, it should be noted that this correlation is exclusively apparent in males whose waist-to-hip ratio exceeds 0.87. This finding implies that leptin might interact with biomarkers in adipose tissue, including sexual hormones or IGF-1, in order to elevate the probability of developing this particular form of cancer . Theoretically, it is possible that increased amounts of leptin could impact the progression of latent CaP to clinically detectable CaP. Studies conducted in controlled laboratory settings (in vitro) and on living beings (in vivo) have shown that this specific adipokyne has the ability to induce angiogenesis, the biological process by which new blood vessels are created. This greatly enhances the growth and spread of various types of cancer, including CaP ; . Furthermore, leptin has the capacity to increase levels of cytokines and growth factors, such as vascular epithelial growth factor (VEGF), a protein associated with the formation of cancer. Freedland et al. , found that there is a positive correlation between high leptin concentrations and tumour volume. Saglam et al. , have found that higher levels of leptin are linked to a more advanced stage of the disease and a tumour that is not well differentiated. Our study confirmed prior studies by showing that individuals with advanced-stage cancer had higher levels of leptin and BMI compared to those with less advanced-stage cancer ; . Males observe a significant increase in blood leptin levels shortly before or during early puberty, which thereafter decrease to normal levels when testosterone levels rise. Leptin may influence the timing of gland reactivation that occurs just before the increase in testosterone. Prostate cancer (PCa) showed a significantly higher proportion of leptin expression compared to benign prostatic hyperplasia (BPh) and healthy prostatic tissue. Thus, prostate cancer cells can exploit the leptin receptor, which is normally found on prostatic epithelial cells, to promote their growth in obese men who have consistently elevated levels of leptin (hoon et al., 2008). There is a suggested link between the levels of leptin in the blood and both body mass index (BMI) and the amount of fat in the body in healthy males. This connection may explain why there is a relationship between prostate cancer (PCa) and obesity. The observed positive connection can be explained by the greater leptin secretion from larger adipocytes compared to smaller adipocytes. Obese individuals emit about eight times more leptin per fat cell compared to thin subjects .
Conclusion
Excessive fat tissue in the body and high levels of leptin in the blood are linked to the aggressiveness of prostate cancer, rather than being variables that increase the risk of developing the disease.
Ethical considerations
Each parent or guardian of the patients who took part in the trial provided a written consent form. The current investigation was carried out in accordance with the ethical principles specified in the Declaration of Helsinki (1964) for medical studies involving human subjects. The research and ethical committee of the Department of Chemistry and Biochemistry, College of Medicine, Al-Nahrain University, Baghdad, Iraq, approved the request.
Acknowledgements
Thanks and gratitude to all contributors to the research and to the Department of Clinical Chemistry at the College of Medicine, Al-Nahrain University, and to the professors who offered assistance in completing the research project.
conflict of interest
We declare that there is no conflict of interest between all researchers.
novelty statement
This study investigates the novel relationship between prostate-specific antigen (PSA) and leptin hormone levels in prostate cancer patients. While PSA is a well-known biomarker, the role of leptin in this context is underexplored. This research aims to uncover potential correlations between these markers, potentially enhancing diagnostic and prognostic insights into prostate cancer.
authors contribution
Nesreen Ahmed Nasser conceived the study, designed the methodology, and analyzed the data. Anas H. Sadek conducted data collection and statistical analysis, and drafted the manuscript. Bayader Abdul Hussan Muhameed assisted with data collection and manuscript preparation. Osama Akram Mohsein oversaw the project, provided guidance, and coordinated the research and writing process.