
Thryssa belongs to the Engraulidae family, which isdistributed across the Indian and Arabian seas. Fisheries and aquaculture involving Thryssa species have significant economic importance in many countries. The mitochondrial genome (mt genome) of Thryssa vitrirostris was sequenced in this study. Two ribosomal rRNAs, twenty-two tRNAs, and thirteen protein-coding genes (PCGs), along with a regulatory region (D-loop), were detected in T. vitrirostris. The whole mt genome was composed of 54.41% A+T and 45.59%G+C. The mt genome of T. vitrirostriswas compared with those of other teleost fishes. The heavy stand encoded 12 protein-coding genes and 14 tRNAs. The conventional cloverleaf structure was found in all tRNAs, except for serine AGY, without a D-arm. All the transferred RNA (tRNA) genes were folded into the standard cloverleaf. G-T pairs were observed to form weak links in the secondary structures of 12 genes. Mismatches of A-C, G-G, A-A, T-T, A-G and C- were also found in the secondary structure. The genetic links between T. vitrirostris and related members of the Engraulidae family were described via the ML and BI trees built viaMEGA11. Phylogenetic tree analysis revealed that T. vitrirostris was closely related to T. hamiltonii and T. setirostris and formed a strong monophyletic group among the 24 analysed species. Phylogenetic analysis revealed that the proposed PCGs were related to T. hamiltoni and T. setirostris.
Research Article · Volume 58, Issue 4, 5 May 2026 · Open Access
Structure and Phylogenetic Relationships of the Whole Mitochondrial Genome Sequence of Thryssa vitrirostris
·
Affiliations & Notes ⌄
- 1Department of Zoology, Nesamony Memorial Christian College, Marthandam, Affiliated to Manonmaniam Sundaranar University, Tirunelveli, Tamil Nadu, India. * Corresponding author: gdbiji66@yahoo.co.in
Article Info ⌄
- Journal:
- Pakistan Journal of Zoology
- Published:
- 5 May 2026

From the article
- Like other teleost mitogenomes, the mitogenome is 16808 bp long and contains 37 genes and a regulatory region.
- The usual cloverleaf secondary structure can be formed by folding any tRNA.
- T. vitrirostris was shown to be closely related to T. hamiltonii and T. setirostris, forming a strong monophyletic group in this study.
- The present findings revealed T. vitrirostris taxonomy, species evolution and genetic diversity.
Selected from the article's own text.
Abstract
INTRODUCTION
Strong data must support conservation strategies to address the ongoing global biodiversity threat . The entire mitochondrial genome of unidentified fish was employed to classify its species via a phylogenetic tree. Mitochondria are important in the context of invading species. One of the primary causes of biodiversity losses is invasive species. Invasive species are costly to manage and have increasingly significant economic impacts worldwide . Thryssa vitrirostris (Gilchrist and Thompson, 1908) is found in coastal and estuarine waters. It belongs to the family Engraulidae and order Clupeiformes . It is distributed in various regions, including Madagascar, the Indian Ocean, the African coast, lfredo Port to the Persian Gulf, and the coasts of Pakistan (Pawase et al., 2020). In India, 18 species of Thryssa and 37 species worldwide have been reported. It is small, slender, and elongated anchovies. Globally, it plays an important role in ecology and improves the income of fishers . The morphological characteristics of the T. vitrirostris maxilla are that it is lengthy, the base of the first pectoral finray is extended, and the first supramaxilla is slightly elliptical. A dark bloch was observed behind the upper portion of the gill aperture; bright orange was found inside the gill cavity, 34 anal fins were present, and 27 keeled scutes were observed from the isthmus to the anus. The total number of lower gill rakers was 24, and serrae were found on the edge .
Fish and other vertebrates have extranuclear, closed, circular, double-stranded DNA molecules that make up their mitochondrial DNA (Gao et al., 2024; . It is made up of heavy and light strands, 13 PCGs, two rRNAs, and twenty-two tRNAs. In addition, a control region was observed in fish mtDNA, which typically has a size of 15–18 kb ; . mtDNA differs from nuclear DNA because of its small size, lack of introns, rapid evolution rate, maternal inheritance, and number of copies. Consequently, it has emerged as a vital molecular marker in the fields of evolutionary genetics, species identification, molecular ecology, and fish conservation biology ; , 2022). In recent years, a growing number of fish mitochondrial genome studies have been performed due to rapid advancements in high-throughput DNA sequencing technology along with statistical analysis. Many countries have utilized the COI gene to study populations, construct phylogeographies, and analyse the genetic diversity of fish. In our study, we examined the structural features and gene composition of the whole mt genome of T. vitrirostrisvia Sanger sequencing. Together with the mitochondrial sequence analysis of similar species, the protein-coding genome sequence was utilized to evaluate the evolutionary relationships of fish in the Engraulidae family.
MATERIALS AND METHODS
Sample collection
Specimens of Thryssa vitrirostriswere collected from a fishing harbour in South Tamil Nadu, India, in June 2020. It was transported on ice and stored at -20 °C at the Department of Bioinformatics DNA Barcode Research Centre, NMC College, India. The frozen tissue was dissected and stored in (v/v) 95% ethanol. The DNeasyQiagen Kit (Qiagen, Germany) was used to extract DNA following the manufacturer’s protocol. The concentration of isolated DNA was measured via a NanoDrop 2000 spectrophotometer (W: NanoDrop Technology, Minton, NC, USA).
DNA extraction and amplification
To analyse the entire mitochondrial (mt) genome, a primer walking technique was employed. First, depending on the primer designed for the fragments, the entire sequence was broken into smaller pieces. The general primer design concept was used in the preparation of the primer (19–21 bp). The PCR-amplified product was 800 bp long, and the GC content ranged from 45 to 55%. The designed primers were further checked via primer stat. To prevent mismatch, the primer has no hairpin structure to avoid the formation of a dimer between the primer and itself . Amplifications were performed via a PCR gradient thermal cycler in 50 µL PCR mixture. A DNA purification kit was utilized to purify the PCR products as described in the manufacturer’s instructions (Qiagen, Germany). The PCR products were sequenced at Eurofins Scientific (Bangalore, India). Chromatographic analysis was performed with ABI Sequence Editor 3.3 (USA).
Annotation and genome assembly
The sequences were manually aligned, corrected, and assembled viaClustalW software. Following splicing of the entire mtDNA sequence, the total length of the mt genome was then calculated. The beginning and ending locations of each gene were compared to the whole mtDNA sequences of Thryssa balaema, which are accessible in GenBank (http://www.ncbi.nlm.nih.gov/genbank). The beginnings and ends of each location of the genes were compared. OGDRAW was employed to annotate the gene structure of the mitochondria . tRNA genes were identified, and a tRNA II hierarchical structure diagram was generated via the web application ARWEN . MEGA 6.0 software was used to calculate the base composition along with codon usage . In this study, “models-> Compute Codon Usage Bias” was used, and synonymous codon usage (RSCU) was computed. AClustal Omega online tool was employed, and the gene sequences were compared . A CAP3 genome assembly program was used to analyse the data as described previously (http://doua.prabi.fr/software/caps) . The different mitochondrial genes were identified in NCBI databases via BLAST analyses . All the mitochondrial DNA sequences were examined for base composition via the base manipulation suite (http://mobyle.Pasteur.fi-/cgibin/portal.py) . The AT and GC skews in the mtDNA, PCG, tRNA, rRNA, and control regions were calculated via the following formulae:
AT skew = (A−T)/(A+T); GC skew = (G−C)/(G+C)
Phylogenetic analysis
The evolutionary position of T. vitrirostris was investigated via 13 PCGs in the mitochondrial genomes of 24 fish species from various families, including Engraulidae, Prestigasteridae, and Clupeadae (Table I). The maximum likelihood method was used to construct a phylogenetic tree, and Chirocentrus dorab was used as the outgroup . The best alternative model derived from the phylogenetic tree dataset was GTR+I+G. The maximum likelihood (ML) method was used to construct a phylogenetic tree through 1000000 bootstrap generations via MEGA11 ; . We constructed a BI phylogenetic tree by discarding 25% of the ageing samples from the sequences, which were sampled and preserved every 500 generations for a total of 100,000 generations.
Table I. Complete mitochondrial genome of species used in this study.
| S. No | Taxon (Species) | Acc. No | Size (bp) |
| 1 | Thryssa vitrirostris | PQ385613 | 16808 |
| 2 | Thryssa mystax | NC_085785 | 17060 |
| 3 | Thryssa baelama | NC_01426 | 16865 |
| 4 | Thryssa hamiltonii | NC_036672 | 16737 |
| 5 | Thryssa dussumieri | NC_035065 | 16920 |
| 6 | Thryssa kammalensis | NC_029940 | 16968 |
| 7 | Thryssa setirostris | NC_038196 | 16923 |
| 8 | Coilia grayii | KP317088 | 16861 |
| 9 | Coilia nasus | AP009135 | 16897 |
| 10 | Coilia mystus | JX534238 | 17143 |
| 11 | Stolephorus chinensis | AP011566 | 16593 |
| 12 | Stolephorus commersonnii | NC_033521 | 16734 |
| 13 | Ilisha africana | AP009140 | 16642 |
| 14 | Pellona flavipinnis | AP009619 | 16742 |
| 15 | Ilisha elongata | AP009141 | 16809 |
| 16 | Sardinops melanostictus | AB032554 | 16881 |
| 17 | Amblygaster sirm | NC_035064 | 17049 |
| 18 | Escualosa thoracata | AP011601 | 16749 |
| 19 | Sardinella albella | NC_016726 | 16652 |
| 20 | Sardinella maderensis | AP009143 | 16651 |
| 21 | Nematalosa nasus | NC_023824 | 16674 |
| 22 | Nematalosa come | NC_021447 | 16644 |
| 23 | Nematalosa japonica | NC-009586 | 16665 |
| 24 | Chirocentrus dorab | AP006229 | 15989 |
RESULTS
Genome content
The whole mitogenome sequence of T. vitrirostris (accession number: PQ385613) was 16808 bp in length (Table II, Fig. 1). According to our findings, the A+T content of the whole mt genome was greater than the G+C content. A total of 13 PCGs were observed, and the longest gene was ND5 (1839 bp), whereas the smallest gene was the ATP8 (168 bp) gene. The length of the 12S rRNA was 951 bp, and the length of the 16S rRNA was1689 bp. The tRNA-Val gene separated the 12S and 16S rRNA genesand was positioned within tRNA-Phe and tRNA-Leu (Table II).
Protein-coding genes
The entire mt genome of T. vitrirostrisconsists of 22 tRNA genes, 13 PCGs, two rRNA genes, and one regulatory region (D-loop). The H-strand encodes all other
Table II. Gene profile and organization of the Thryssa vitrirostris.
| Genes | From | To | Size (bp) | Amino acid | Start | Stop | GAP | St-and |
| tRNAphe | 1 | 69 | 69 | 0 | H | |||
| 12S rRNA | 70 | 1020 | 951 | 0 | H | |||
| tRNA val | 1021 | 1092 | 72 | 0 | H | |||
| 16S rRNA | 1093 | 2781 | 1689 | 0 | H | |||
| tRNALeu | 2782 | 2856 | 75 | 0 | H | |||
| ND1 | 2858 | 3832 | 975 | 324 | ATG | TAA | 1 | H |
| tRNAIle | 3833 | 3904 | 72 | -1 | H | |||
| tRNAGln | 3904 | 3974 | 71 | 0 | L | |||
| tRNA Met | 3974 | 4042 | 69 | 0 | H | |||
| ND2 | 4043 | 5087 | 1045 | 348 | ATG | T-- | 2 | H |
| tRNA Trp | 5088 | 5159 | 72 | 1 | H | |||
| tRNA Ala | 5162 | 5230 | 69 | 1 | L | |||
| tRNA Asn | 5232 | 5304 | 73 | 31 | L | |||
| tRNACys | 5336 | 5401 | 66 | 0 | L | |||
| tRNA Tyr | 5402 | 5472 | 71 | 1 | L | |||
| CO1 | 5474 | 7018 | 1545 | 514 | GTG | TAA | 0 | H |
| tRNAser | 7019 | 7089 | 71 | 5 | L | |||
| tRNAASP | 7095 | 7163 | 69 | 11 | H | |||
| CO11 | 7175 | 7865 | 691 | 230 | ATG | T | 0 | H |
| tRNALys | 7866 | 7939 | 74 | 1 | H | |||
| ATP8 | 7941 | 8108 | 168 | 55 | ATG | TAA | 8 | H |
| ATP6 | 8099 | 8782 | 684 | 227 | ATG | TAA | -1 | H |
| CO111 | 8782 | 9566 | 785 | 261 | ATG | TA | 0 | H |
| tRNAGly | 9567 | 9638 | 72 | 0 | H | |||
| ND3 | 9639 | 9987 | 349 | 116 | ATG | T | 0 | H |
| tRNAArg | 9988 | 10056 | 69 | 0 | H | |||
| ND4L | 10057 | 10353 | 297 | 98 | ATG | TAA | 5 | H |
| ND4 | 10347 | 11727 | 1381 | 460 | ATG | T | 0 | H |
| tRNAHis | 11728 | 11796 | 69 | 1 | H | |||
| tRNAser | 11798 | 11864 | 67 | 0 | H | |||
| tRNALeu | 11865 | 11936 | 72 | 0 | H | |||
| ND5 | 11937 | 13772 | 1836 | 611 | ATG | TAA | 3 | H |
| ND6 | 13768 | 14289 | 522 | 173 | ATG | AGG | 0 | L |
| tRNAGlu | 14290 | 14358 | 69 | 5 | L | |||
| CYTB | 14364 | 15504 | 1141 | 380 | ATG | T | 0 | H |
| tRNAThr | 15505 | 15575 | 71 | -1 | H | |||
| tRNApro | 15575 | 15645 | 70 | 0 | L | |||
| Control region | 15646 | 16808 | 1163 |
|
|
| 0 | H |
mitochondrial genes except for ND6, which is encoded by eight tRNA genes (Cys, Pro, Ser, Tyr, Gln, Ala, Asn, and Glu). The mitogenome order, direction, position, and gene coding strands were analysed. A total of 13 PCGs, including 67.93% of the mitochondrial genome, were11419 bp long. The overall composition of the base of the mt genome was A-30.15%, T-24.26%, G-16.84%, and C-28.75%. The AT and GC contents were 54.41% and 45.59%, respectively. The overall base compositions of A, T, G, and C were 30.15%, 24.26%, 16.84%, and 28.75%, respectively. A total of six PCGs ended with a stop codon, TAA, ND6 ended with AGG, and the other genes were incomplete with T and TA (ND2, COII, CO111, ND3, ND4, and CYTB). The maximum distance between tRNA-Asn and tRNA-Cys was 31 bp. In addition, 13 bp overlapped between ATP8 and ATP6 and between ND4Land ND4 (Table II). In this study, most of the GCskews in the PCGs were negative, with the exception of ND6, and the ATskews of CO1, CO3, ND6, and CYTB were negative. The analysed skews ranged from -0.51 (ND6) to 0.15 (ND2) (Fig. 3; Table III).
rRNA region
Our results revealed that the 12S and 16S rRNA gene lengths were 951 bp and 1689 bp, respectively. These genes are located within tRNA-Phe and tRNA-Leu and are separated by tRNA-Val. In the rRNA, the base compositions of A, T, G, and C were 33.3%, 18.79%, 20.98%, and 26.73%, respectively. The A+T value of 52.08% was slightly greater than the G+C content (47.92%). The two rRNAs encoded on the H-stand presented a negative G+C skew (AT skew=0.54, GC skew=-0.12) and positive A+T skew (Table IV). The A+T content and length of the two rRNAs were similar to those of other Engraulidaemito genomes.
Codon usage and amino acid composition
In this study, the observed RSCU value of 13 PCGs of T. vitrirostriswas 27, a value >1indicated positive bias in codon usage and a value <1 indicated negativebias in codon usage. The 11419 bp sequence encoded 3797 amino acids. With a total concentration of genome. However, at a concentration of 0.8%, cysteine (Cys) was the minimum prevalent amino acid in the T. vitrirostris mitochondrial metagenome (Table V).
Table III. Nucleotide composition of Protein coding genes of T. vitrirostris.
| Gene | Length | A% | T% | G% | C% | AT% | GC% | ATskew | Gcskew |
| ND1 | 975 | 28.1 | 24.51 | 15.59 | 31.79 | 52.62 | 47.38 | 0.0682 | -0.34 |
| ND2 | 1045 | 29.86 | 22.01 | 12.82 | 35.31 | 51.87 | 48.13 | 0.1513 | -0.47 |
| CO1 | 1545 | 26.15 | 28.87 | 19.48 | 25.5 | 55.02 | 44.98 | -0.049 | -0.13 |
| CO2 | 691 | 29.23 | 25.33 | 17.51 | 27.93 | 54.56 | 45.44 | 0.0715 | -0.23 |
| ATP8 | 168 | 33.93 | 26.19 | 12.5 | 27.38 | 60.12 | 39.88 | 0.1287 | -0.37 |
| ATP6 | 684 | 30.12 | 25.73 | 13.3 | 30.85 | 55.85 | 44.15 | 0.0786 | -0.4 |
| CO3 | 785 | 27.01 | 27.39 | 17.32 | 28.28 | 54.39 | 45.61 | -0.007 | -0.24 |
| ND3 | 349 | 27.51 | 26.65 | 17.79 | 28.65 | 54.15 | 45.85 | 0.0159 | -0.24 |
| ND4L | 297 | 27.27 | 27.27 | 15.82 | 29.63 | 54.55 | 45.45 | 0 | -0.3 |
| ND4 | 1381 | 28.46 | 25.13 | 14.77 | 31.64 | 53.58 | 46.42 | 0.0622 | -0.36 |
| ND5 | 1836 | 31.54 | 23.97 | 13.94 | 30.56 | 55.5 | 44.5 | 0.1364 | -0.37 |
| ND6 | 522 | 13.22 | 41.19 | 32.57 | 13.03 | 54.41 | 45.59 | -0.514 | 0.429 |
| CYTB | 1141 | 26.56 | 26.91 | 16.3 | 30.24 | 53.46 | 46.57 | -0.007 | -0.3 |
Table IV. Nucleotide composition and codon position of the T. vitrirostris mitochondrial genome.
|
| Length | A% | T% | G% | C% | AT% | GC% | ATskew | GCskew |
| Genome | 16808 | 30.15 | 24.26 | 16.84 | 28.75 | 54.4 | 45.59 | 0.11 | -0.261 |
| PCG | 11419 | 27.92 | 26.34 | 16.46 | 29.28 | 54.3 | 45.74 | 0.03 | -0.28 |
| 1st codon position | 3807 | 27 | 26 | 19.4 | 27.4 | 53 | 46.8 | 0.02 | -0.171 |
| 2nd codon position | 3806 | 26.2 | 29 | 15.4 | 29.6 | 55.2 | 45 | -0.05 | -0.356 |
| 3rd codon position | 3806 | 30.6 | 24 | 14.6 | 30.6 | 54.6 | 45.2 | 1 | -0.354 |
| rRNAs | 2640 | 33.3 | 18.79 | 20.98 | 26.93 | 52.1 | 47.92 | 0.54 | -0.124 |
| tRNAs | 1482 | 30.09 | 23.41 | 20.38 | 26.11 | 53.5 | 46.49 | 0.12 | 0.1437 |
| D-Loop | 1163 | 31.99 | 31.04 | 15.74 | 21.24 | 63 | 36.97 | 0.02 | -0.149 |
Table V. Codon usage of Thryssa vitrirostris.
| Codon | Count | RSCU | Codon | Count | RSCU | Codon | Count | RSCU | Codon | Count | RSCU |
| UUU(F) | 94 | 0.8 | UCU(S) | 29 | 0.78 | UAU(Y) | 39 | 0.7 | UGU(C) | 10 | 0.69 |
| UUC(F) | 133 | 1.2 | UCC(S) | 61 | 1.63 | UAC(Y) | 75 | 1.3 | UGC(C) | 19 | 1.31 |
| UUA(L) | 99 | 1 | UCA(S) | 73 | 1.96 | UAA(*) | 6 | 3.7 | UGA(W) | 96 | 1.63 |
| UUG(L) | 25 | 0.3 | UCG(S) | 6 | 0.16 | UAG(*) | 0 | 0 | UGG(W) | 22 | 0.37 |
| CUU(L) | 97 | 1 | CCU(P) | 37 | 0.69 | CAU(H) | 18 | 0.4 | CGU(R) | 4 | 0.21 |
| CUC(L) | 121 | 1.2 | CCC(P) | 77 | 1.43 | CAC(H) | 84 | 1.7 | CGC(R) | 16 | 0.85 |
| CUA(L) | 198 | 2 | CCA(P) | 92 | 1.7 | CAA(Q) | 94 | 1.8 | CGA(R) | 43 | 2.29 |
| CUG(L) | 66 | 0.7 | CCG(P) | 10 | 0.19 | CAG(Q) | 8 | 0.2 | CGG(R) | 12 | 0.64 |
| AUU(I) | 138 | 1 | ACU(T) | 43 | 0.52 | AAU(N) | 31 | 0.5 | AGU(S) | 12 | 0.32 |
| AUC(I) | 148 | 1 | ACC(T) | ## | 1.7 | AAC(N) | 97 | 1.5 | AGC(S) | 43 | 1.15 |
| AUA(M) | 116 | 1.4 | ACA(T) | ## | 1.54 | AAA(K) | 68 | 1.7 | AGA(*) | 0 | 0 |
| AUG(M) | 52 | 0.6 | ACG(T) | 19 | 0.23 | AAG(K) | 13 | 0.3 | AGG(*) | 1 | 0.31 |
| GUU(V) | 43 | 0.8 | GCU(A) | 61 | 0.69 | GAU(D) | 20 | 0.6 | GGU(G) | 29 | 0.49 |
| GUC(V) | 54 | 1 | GCC(A) | ## | 1.43 | GAC(D) | 53 | 1.5 | GGC(G) | 49 | 0.82 |
| GUA(V) | 86 | 1.5 | GCA(A) | ## | 1.65 | GAA(E) | 74 | 1.5 | GGA(G) | 113 | 1.89 |
| GUG(V) | 40 | 0.7 | GCG(A) | 21 | 0.24 | GAG(E) | 27 | 0.5 | GGG(G) | 48 | 0.8 |
tRNAs of the genome
In this study, 22 tRNA genes were detected in T. vitrirostris mt genes, which are commonly found in metazoans and range in length from 66 bp (tRNAcys) to 75 bp (tRNALeu). Fourteen tRNA genes were transcribed on the H-stand, whereas eight tRNA genes were directed to the L-stand. 26 G-U mismatches in the secondary structure of all arms of 12 of 22 tRNA genes, including RNA-Ala, tRNA-Tyr, tRNA-Gln, tRNA-Asn, tRNA-Trp, tRNA-Cys, tRNA-Asp, tRNA-SerUCN, tRNA-LeuCUN, tRNA-Lys, tRNA-Glu, and tRNA-Pro, created a weak link. A-C mismatches were discovered in the acceptor arm, TφC loop, and aniticodon arm of 11tRNAs, including tRNA-Phe, tRNA-LeuUUR, tRNA-Trp, tRNA-Ile, tRNA-His, and tRNA-LeuCUN, along with tRNA-Thr. In every arm, there were seven T-T mismatches (tRNA-Met, tRNA-Tyr, tRNA-Asn, tRNA-Thr, and tRNA-SerUCN) and four G-A mismatches in the acceptor arm (DHU) and anticodon arms (tRNA-Val, tRNA-Leu UUR, and tRNA-Tyr). One tRNA-Trp U-C mismatch was found in the anticodon arm. In the acceptor arm, DHU arm, TφC loop, and anticodon arm, there were five A-A mismatches of the tRNA-Ile, tRNA-Ser-AGY, tRNA-Thr, and tRNA-Met genes. The acceptor arm (tRNA-SerUCN) was 6 bp in length, and the other 21 tRNAs were 7 bp in length.The DHU arm was 4 bp long, and tRNA-Ile, tRNA-SerUCN, tRNA-Arg and tRNA-Ser-AGY were 3 bpin length. The TφCloops of tRNA-pheand tRNA-Lys were 4 bp in length. Ser-AGY was 6 bp in length, and the other tRNAs were 5 bp in length. The anticodon arm was 5 bp in length in all tRNAs (Fig. 4).
Noncoding regions
The origin of light stand replication (OL) was found inside the WANCY region of tRNAs (tRNA-Trp, tRNA-Asn, tRNA-Ala, tRNA-Cys, and Tyr). The AT content of the OL region was 32.26%, while its GC content was 68.42%, indicating a clear preference for GCs.The control region of T. vitrirostris mito genome was located between tRNAProand tRNAPhe. The length of the D-loop1163bp. The overall nucleotide composition of G, A, T, and C were 31.99%, 31.04%, 17.74%, and 21.24%, respectively. It was rich in A+T (63.5%) than G+C content (36.5 %).
Phylogenetic relationships
Topological structures were generated via phylogenetic relationship analysis (Figs. 5, 6). The 13 PCGs of 24 Clupeoidei species, including three families (Engruulidae, Pristigasterridae, and Clupeidae), were constructed. For every internode, the topological relationships of the two phylogenetic analyses yielded high bootstrap support levels. We anticipate that the current findings will make research on the genetic structure, taxonomy and evolutionary relationships of Clupeoide much easier.
DISCUSSION
In the present study, Sanger sequencing was used to identify the mt genome of T. vitrirostris. The variation in mitochondrial DNA length is based on the varying lengths of regulatory regions generally found in the majority of vertebrates ; ; . Each tRNA was able to fold into a typical cloverleaf secondary structure, in addition totRNA-Ser (AGY), which lacked the dihydrouracil arm. Consistent with other teleost mitogenomes, the 16,808 bp genome of T. vitrirostris contains 37 genes and a single control region. With the exception of ND6, all twelve GCskews and four ATskews were negative, suggesting that the H-strand had an excess of cytosine and adenine and that the nucleotide composition was asymmetrical. Combining DNA barcoding with phylogenetic analysis has been widely used to increase species identification and understand evolutionary relationships . In addition to enhancing species variation and evolutionary biology, the combination of DNA barcoding and phylogenetic analysis also increases the accuracy of species identification. The mitochondrial genome contains nucleotide insertions, deletions, and tandem repetitions, and this show species variation . The phylogenetic construction of Thryssa revealed that several clusters were formed by members of the same species .
The mitogenome order, direction, positions, and gene coding strands observed in this study were similar to those of the Engraulidae family (Zhanga et al., 2019; ; . The A+T content of the mt genome of Engraulidae observed in this study was greater than the G+C content reported previously ; . The starting codons of PCGs (ATG and GTG) observed in this study were similar to those reported in other fish species ; ; ; . In this study, some of the incomplete codons were observed, and this finding was corroborated by Ojala et al. (1981), who reported that posttranscriptional polyadenylation can transform such noncanonical stop codons into fully functional TAA stop codons. The RSCU value of 13 PCGs of T. vitrirostris was 27, with a value >1 indicating positive biases in codon usage, and no bias was observed, which was similar to the findings of a previous report . The nucleotide composition of metazoan genomes typically exhibits a pronounced strand bias that may be quantified as ATand GC skews ; . Important indicators of nucleotide variations between the heavy and light chains were AT skew and GC skew values. The greater the variance between AT skew and GC skew is, the greater the absolute value . In this study, most ATskews were negative. Since most mitogenomes have a conventional preference for positive ATskews and negative GCskews, the former is typically smaller in size than the latter .
In addition, totRNASer (AGY), twenty-one tRNA genes presented cloverleaf secondary structures . Partial mismatches of RNA genes were observed in this study, and these results corroborated those of previous reports. These partially mismatched RNA genes are used to eliminate mutations and may be corrected through subsequent RNA editing without interfering with the transfer of amino acids ; . In this study, tRNA-Asn and tRNA-Cys were separated by 31 bp, similar to other vertebrates ; . The control region of mtDNA is the quickest evolutionary sequence and has been used to study molecular systematics and population genetics ; .
CONCLUSION
This research analysed the sequences of the entire mitogenome of T. vitrirostris (accession number: PQ385613), which was collected from the southern coast of India. The organization of the mitogenome structure and gene arrangement resembled those ofother fishes in the Engraulidae family. Like other teleost mitogenomes, the mitogenome is 16808 bp long and contains 37 genes and a regulatory region. The usual cloverleaf secondary structure can be formed by folding any tRNA. T. vitrirostris was shown to be closely related to T. hamiltonii and T. setirostris, forming a strong monophyletic group in this study. The present findings revealed T. vitrirostris taxonomy, species evolution and genetic diversity.
Declarations
Acknowledgement
Authors gratefully acknowledge Department of Zoology, Nesamony Memorial Christian College, Marthandam for laboratory facilities.
Funding
The study received no external funding.
IRB approval
Not applicable.
Ethical Statement
No live samples were used in the present investigation.
Generative AI or AI-assisted technology statement
The authors have declared that no generative AI or AI-assisted technologies were used to create this manuscript.
Statement of conflict of interest
The authors have declared no conflict of interest.
Figures
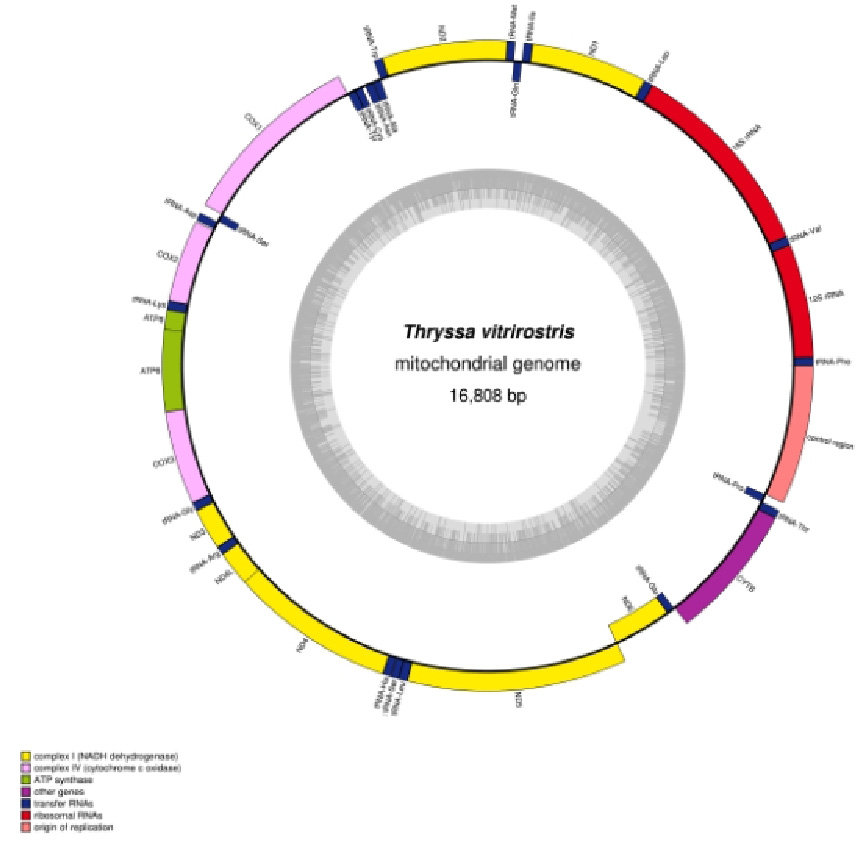
Structure of the mitochondrial genome of Thryssa vitrirostris.
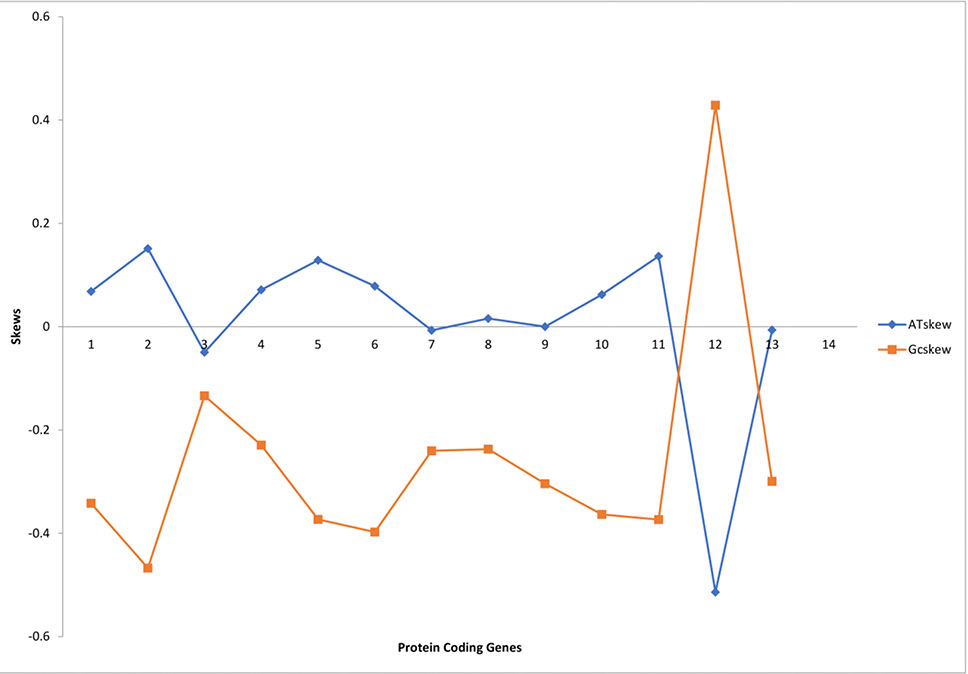
Relative synonymous codon usage in the mitochondrial protein-coding genes of Thryssa vitrirostris.
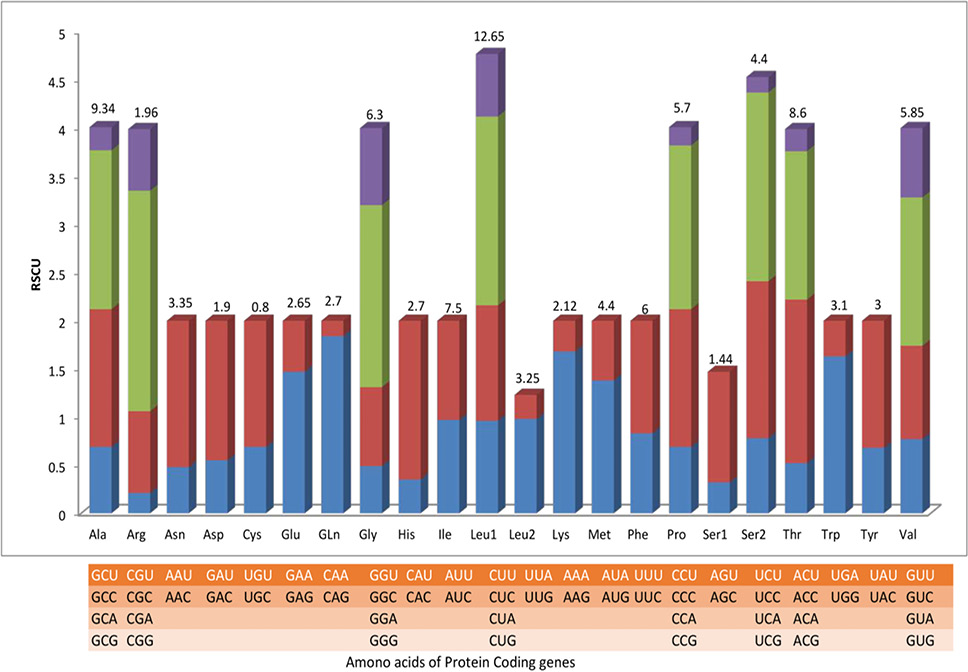
AT skews and GC skews of protein-coding genes in the mitogenome of Thryssa vitrirostris.
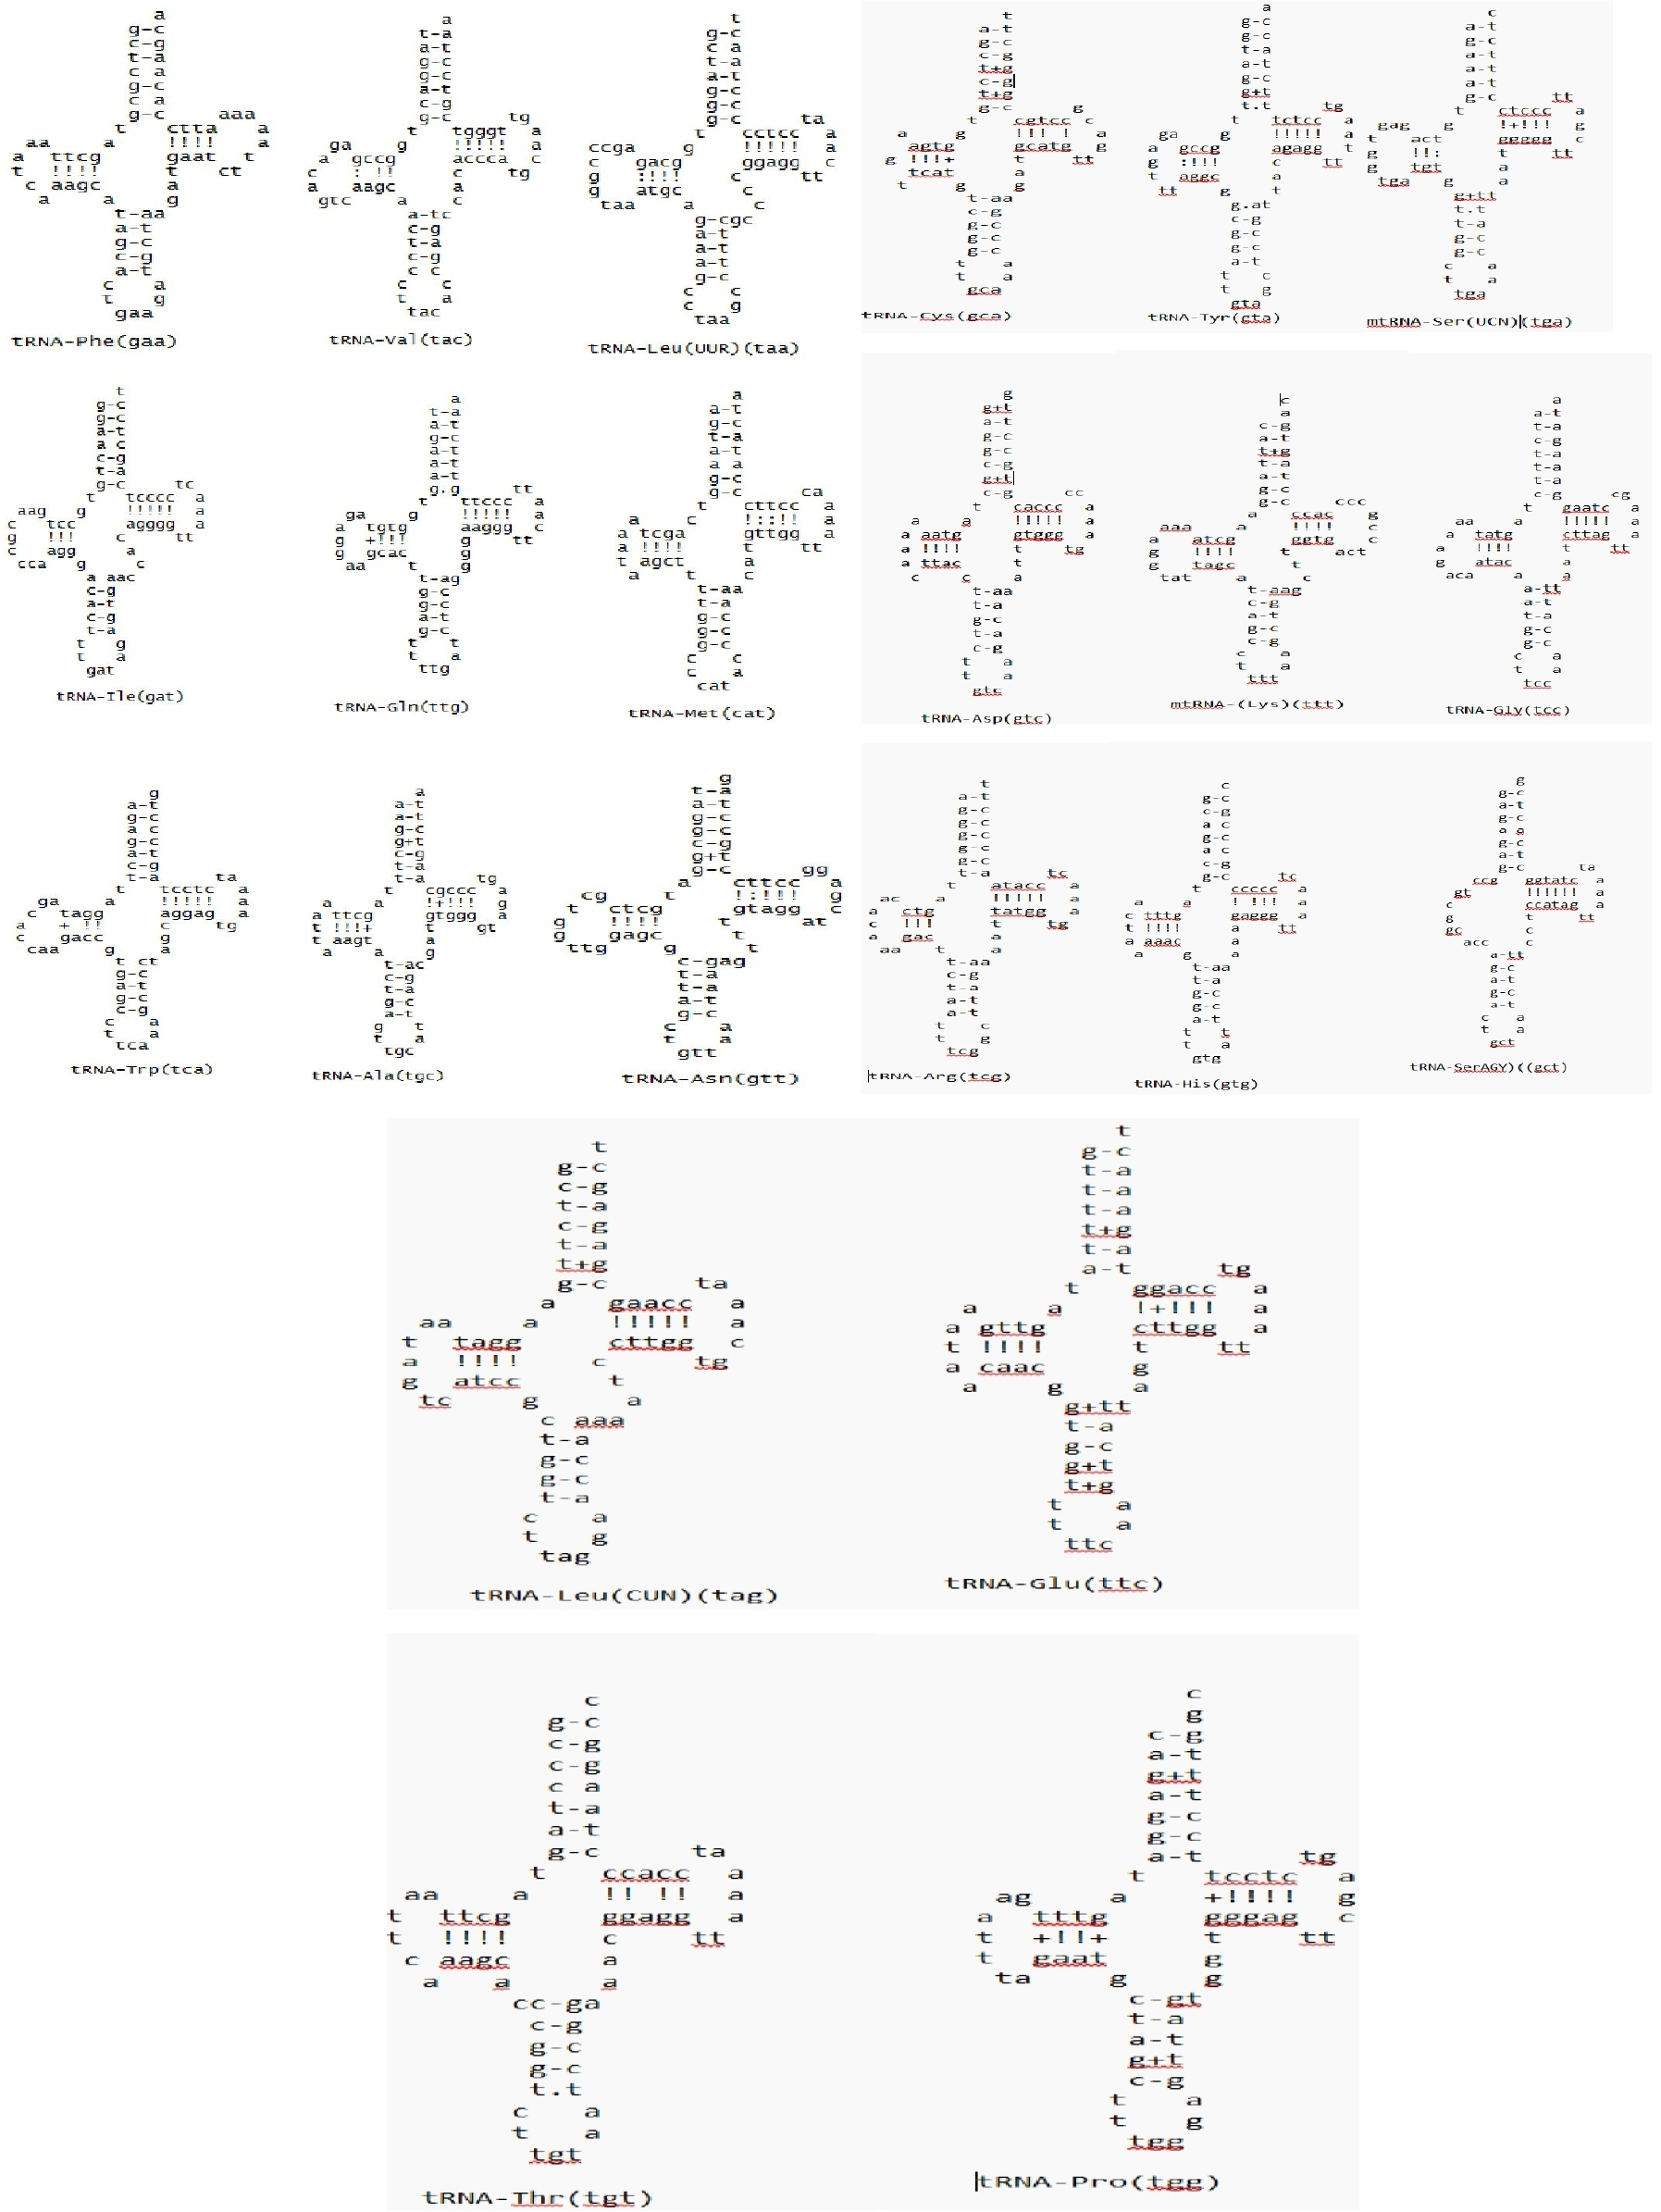
Putative secondary structure of the 22 tRNA genes found in the Thryssa vitrirostris mitochondrial genome. The tRNA is labelled with the relevant amino acid abbreviations. The amino acid arm, acceptor arm, TφC arm, anticodon arm, and dihyrouridine arm are arranged clockwise from the top.
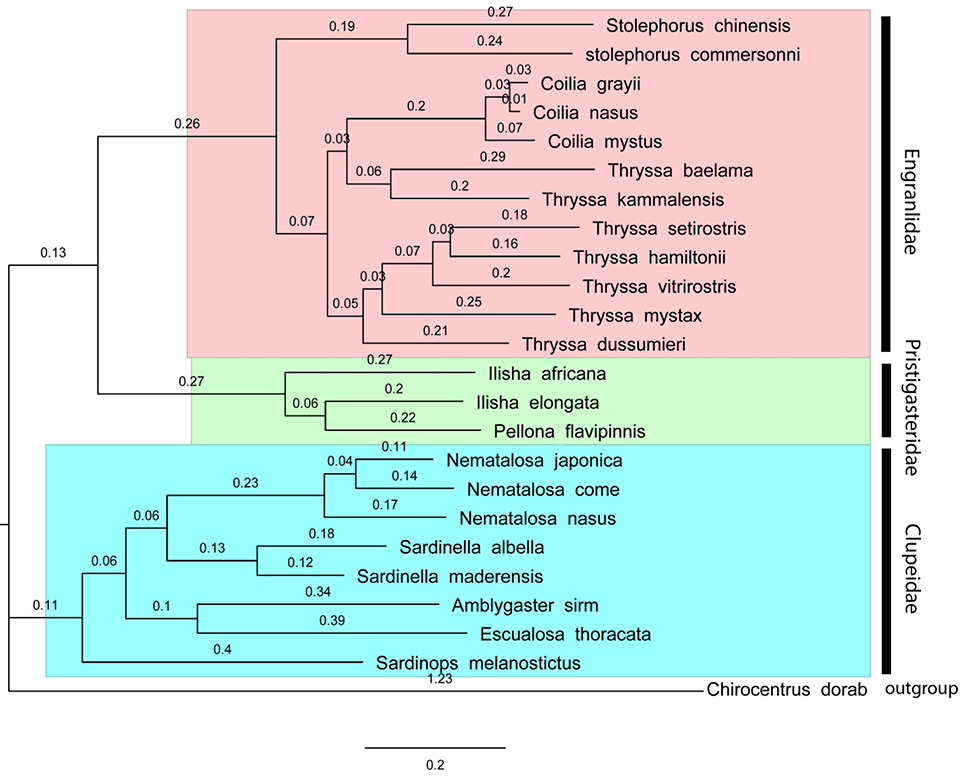
Nucleotide information for 13 protein-coding genes from the mitogenomes of 24 fishes was used to create maximum likelihood phylogenetic trees. ML bootstrap values are indicated by the numbers along the branches.
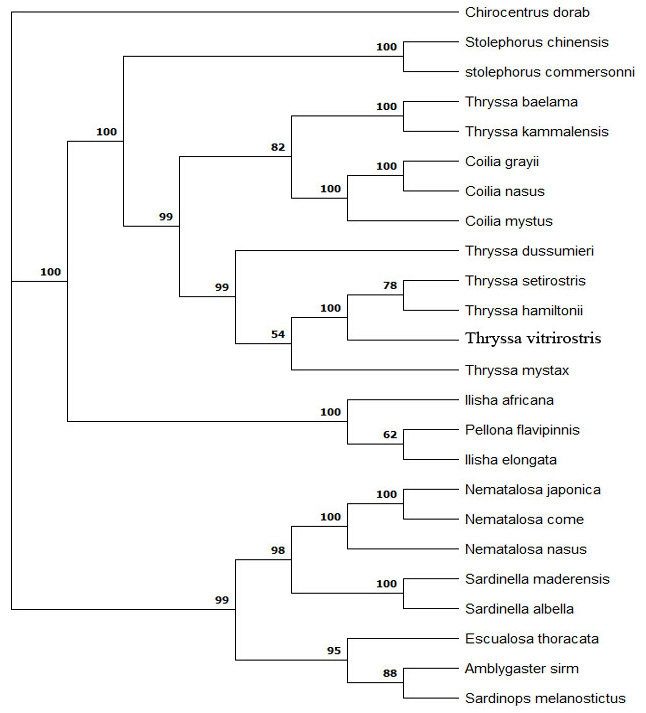
Bayesian inference phylogenetic trees were constructed from the nucleotide sequences of 13 protein-coding genes from the mitogenomes of 24 fishes. The Bayesian posterior probability value is indicated by the numbers along the branches.
References
- Altschul, S.F., Gish, W., Miller, W., Myers, E.W. and Lipman, D.J., 1990. Basic local alignment search tool. J. mol. Biol., 215: 403-410. https://doi.org/10.1016/S0022-2836(05)80360-2[CrossRef]
- Bo, Z., Xu, T., Wang, R., Jin, X. and Sun, Y., 2013. Complete mitochondrial genome of the Osbeck’s grenadier anchovy Coiliamystus (Clupeiformes, Engraulidae). Mitochond. DNA, 24: 657-659. https://doi.org/10.3109/19401736.2013.772599[CrossRef]
- Brown, K.H., 2008. Fish mitochondrial genomics: sequence, inheritance and functional variation. J. Fish Biol., 72: 355-374. https://doi.org/10.1111/j.1095-8649.2007.01690.x[CrossRef]
- Buxton, R.T., Bennett, J.R., Reid, A.J., Shulman, C., Cooke, S.J., Francis, C.M., Nyboer, E.A., Pritchard, G., Binley, A.D., Avery-Gomm, S. and Ban, N.C., 2021. Key information needs to move from knowledge to action for biodiversity conservation in Canada. Biol. Conserv., 256: 108983. https://doi.org/10.1016/j.biocon.2021.108983[CrossRef]
- Chen, W., Jiang, H., Du, X., Gong, L., Liu, L., Liu, B. and Lü, Z., 2018. The complete mitochondrial genome of Thryssasetirostris (Engraulinae, Engranlidae, Clupeoidei) and phylogenetic studies of Clupeoidei. Mitochond. DNA Part B, 3: 326-327. https://doi.org/10.1080/23802359.2018.1437807[CrossRef]
- Diagne, C., Leroy, B., Vaissière, A.C., Gozlan, R.E., Roiz, D., Jarić, I., Salles, J.M., Bradshaw, C.J. and Courchamp, F., 2021. High and rising economic costs of biological invasions worldwide. Nat., 592: 571-576. https://doi.org/10.1038/s41586-021-03405-6[CrossRef]
- Fonseca, M.M., Harris, D.J. and Posada, D., 2014. The inversion of the control region in three mitogenomes provides further evidence for an asymmetric model of vertebrate mtDNA replication. PLoS One, 9: e106654. https://doi.org/10.1371/journal.pone.0106654[CrossRef]
- Gao, X., Li, Y., Zhang, R., Lv, Y., Wang, Y., Shi, J., Xie, J., Kong, C. and Li, L., 2024. The complete mitochondrial genome of a rare cavefish (Sinocyclocheilus cyphotergous) and comparative genomic analyses in Sinocyclocheilus. Pakistan J. Zool., 56: 2245. https://doi.org/10.17582/journal.pjz/20230213080243[Full text][CrossRef]
- Gong, Y., Yang, T., Su, C., Zhao, L. and Li, F., 2023. The complete mitochondrial genome of the Tanichthys flavianalis (Cypriniformes: Tanichthyidae) and its phylogeny. Mitochond. DNA Part B, 8: 1325-1329. https://doi.org/10.1080/23802359.2023.2282794[CrossRef]
- Gopinath, A. and Abdussamad, E.M., 2024. Phylogenetic analysis and redescription of the specimen of Thryssa stenosoma (Teleostei: Clupeiformes: engraulidae) collected from Puri, Odisha, Bay of Bengal. Int. Educ. Res., 10: 19-22.
- Gopinath, A., Abdussamad, E.M., Tomy, E., Thomas, T. and Retheesh, T.B., 2024. Length-weight relationship of six species of Thryssa with emphasis on the biology of Thryssa mystax from Indian waters. J. Mar. Biol. Assoc., 66: 66-71. https://doi.org/10.6024/jmbai.2024.66.1.2439-10[CrossRef]
- Greiner, S., Lehwark, P. and Bock, R., 2019. Organellar Genome DRAW (OGDRAW) version 1.3. 1: expanded toolkit for the graphical visualization of organellar genomes. Nucl. Acids Res., 47: W59-W64. https://doi.org/10.1093/nar/gkz238[CrossRef]
- Hassanin, A., Leger, N.E.L.L.Y. and Deutsch, J., 2005. Evidence for multiple reversals of asymmetric mutational constraints during the evolution of the mitochondrial genome of Metazoa, and consequences for phylogenetic inferences. Syst. Biol., 54: 277-298. https://doi.org/10.1080/10635150590947843[CrossRef]
- Hata, H. and Lavoué, S., 2024. Resurrection and redescriptions of nominal species previously regarded as synonyms of Thrissina mystax (Bloch and Schneider, 1801) (Teleostei: Clupeiformes: Engraulidae). J. Fish Biol., 104: 1445-1467. https://doi.org/10.1111/jfb.15684[CrossRef]
- Huang, X. and Madan, A., 1999. CAP3: A DNA sequence assembly program. Genome Res., 9: 868-877. https://doi.org/10.1101/gr.9.9.868[CrossRef]
- Jo, T., Takao, K. and Minamoto, T., 2022. Linking the state of environmental DNA to its application for biomonitoring and stock assessment: Targeting mitochondrial/nuclear genes, and different DNA fragment lengths and particle sizes. Environ. DNA, 4: 271-283. https://doi.org/10.1002/edn3.253[CrossRef]
- Junqueira, A.C.M., Lessinger, A.C., Torres, T.T., da Silva, F.R., Vettore, A.L., Arruda, P. and Espin, A.M.L.A., 2004. The mitochondrial genome of the blowfly Chrysomya chloropyga (Diptera: Calliphoridae). Gene, 339: 7-15. https://doi.org/10.1016/j.gene.2004.06.031[CrossRef]
- Ketmaier, V. and Bernardini, C., 2005. Structure of the mitochondrial control region of the Eurasian otter (Lutralutra; Carnivora, Mustelidae): Patterns of genetic heterogeneity and implications for conservation of the species in Italy. J. Hered., 96: 318-328. https://doi.org/10.1093/jhered/esi037[CrossRef]
- Laslett, D. and Canbäck, B., 2008. ARWEN: A program to detect tRNA genes in metazoan mitochondrial nucleotide sequences. Bioinformatics, 24: 172-175. https://doi.org/10.1093/bioinformatics/btm573[CrossRef]
- Liu, H.Y., Yu, L.N. and Zhang, F.R., 2008. Molecular structure and application progress of fish mitochondrial DNA control region. Reservoir. Fish, 28: 4-8.
- Lynch, M., 1997. Mutation accumulation in nuclear, organelle, and prokaryotic transfer RNA genes. Mol. Biol. Evol.,14: 914-925. https://doi.org/10.1093/oxfordjournals.molbev.a025834[CrossRef]
- Macey, J.R., Larson, A., Ananjeva, N.B., Fang, Z. and Papenfuss, T.J., 1997. Two novel gene orders and the role of light-strand replication in rearrangement of the vertebrate mitochondrial genome. Mol. Biol. Evol., 14: 91-104. https://doi.org/10.1093/oxfordjournals.molbev.a025706[CrossRef]
- Madeira, F., Madhusoodanan, N., Lee, J., Eusebi, A., Niewielska, A., Tivey, A.R., Lopez, R. and Butcher, S., 2024. The EMBL-EBI job dispatcher sequence analysis tools framework in 2024. Nucl. Acids Res., 52: W521-W525. https://doi.org/10.1093/nar/gkae241[CrossRef]
- Néron, B., Ménager, H., Maufrais, C., Joly, N., Maupetit, J., Letort, S., Carrere, S., Tuffery, P. and Letondal, C., 2009. Mobyle: A new full web bioinformatics framework. Bioinformatics, 25: 3005-3011. https://doi.org/10.1093/bioinformatics/btp493[CrossRef]
- Nguyen, P.T., Lee, S., Jeong, J., Kim, J., Han, D.W., Kim, I.C., Lee, J.H., Park, J. and Kim, J.H., 2023. Complete mitochondrial genome of Trematomus newnesi (Perciformes, Nototheniidae). Mitochond. DNA B, 8: 1196-1199. https://doi.org/10.1080/23802359.2023.2194456[CrossRef]
- Ojala, D., Montoya, J. and Attardi, G., 1981. tRNA punctuation model of RNA processing in human mitochondria. Nature, 290: 470-474. https://doi.org/10.1038/290470a0[CrossRef]
- Pawase, S.V., Nirmale, V.H., Bhosale, B.P., Pawar, R.A., Sawant, M.S. and Kende, D.R., 2020. Study on biology of Thryssa dussumieri (Valenciennes, 1848) from the coast of Ratnagiri, Maharashtra, India. Int. J. mol. Sci., 49: 87-94. https://doi.org/10.1016/j.gene.2006.04.014[CrossRef]
- Peng, Z., Wang, J. and He, S., 2006. The complete mitochondrial genome of the helmet catfish Cranoglanis bouderius (Siluriformes: Cranoglanididae) and the phylogeny of otophysan fishes. Gene, 376: 290-297.
- Perna, N.T. and Kocher, T.D., 1995. Patterns of nucleotide composition at fourfold degenerate sites of animal mitochondrial genomes. J. mol. Evol., 41: 353-358. https://doi.org/10.1007/BF01215182[CrossRef]
- Randi, E. and Lucchini, V., 1998. Organization and evolution of the mitochondrial DNA control region in the avian genus Alectoris. J. mol. Evol., 47: 449-462. https://doi.org/10.1007/PL00006402[CrossRef]
- Ronquist, F., Teslenko, M., Van Der Mark, P., Ayres, D.L., Darling, A., Höhna, S., Larget, B., Liu, L., Suchard, M.A. and Huelsenbeck, J.P., 2012. MrBayes 3.2: Efficient Bayesian phylogenetic inference and model choice across a large model space. Syst. Boil., 61: 539-542. https://doi.org/10.1093/sysbio/sys029[CrossRef]
- Saha, S., haoJia, C., Song, N., Suzuki, T., Baki, M.A., Yang, T. and Gao, T., 2024. Comparative analyses of complete mitochondrial genomes of four sillaginids fish (Perciformes: Sillaginidae) and phylogenetic implications. Bangladesh J. scient. indust. Res., 59: 87-104. https://doi.org/10.3329/bjsir.v59i2.71326[CrossRef]
- Satoh, T.P., Miya, M., Mabuchi, K. and Nishida, M., 2016. Structure and variation of the mitochondrial genome of fishes. BMC Genom., 17: 1-20. https://doi.org/10.1186/s12864-016-3054-y[CrossRef]
- Sheikh, A., Al-Taher, A., Al-Nazawi, M., Al-Mubarak, A.I. and Kandeel, M., 2020. Analysis of preferred codon usage in the coronavirus N genes and their implications for genome evolution and vaccine design. J. Virol. Methods, 277: 113806. https://doi.org/10.1016/j.jviromet.2019.113806[CrossRef]
- Skorupski, J., 2022. Characterisation of the complete mitochondrial genome of critically endangered Mustelal utreola (Carnivora: Mustelidae) and its phylogenetic and conservation implications. Genes, 13: 125. https://doi.org/10.3390/genes13010125[CrossRef]
- Tamura, K., Stecher, G. and Kumar, S., 2021. MEGA11: Molecular evolutionary genetics analysis version 11. Mol. Biol. Evol., 38: 3022-3027. https://doi.org/10.1093/molbev/msab120[CrossRef]
- Tamura, K., Stecher, G., Peterson, D., Filipski, A. and Kumar, S., 2013. MEGA6: Molecular evolutionary genetics analysis version 6.0. Mol. Biol. Evol., 30: 2725-2729. https://doi.org/10.1093/molbev/mst197[CrossRef]
- Tomita, K., Ueda, T. and Watanabe, K., 1996. RNA editing in the acceptor stem of squid mitochondrial tRNATyr. Nucl. Acids Res., 24: 4987-4991. https://doi.org/10.1093/nar/24.24.4987[CrossRef]
- Xiao, W.H. and Zhang, Y.P., 2000. Genetics and evolution of mitochondrial DNA in fish. Acta Hydrobiol. Sin., 24: 384-391. https://doi.org/10.3724/issn1000-3207-2000-4-384-v[CrossRef]
- Xu, C.H., Song, L., Wang, Q. and Chen, X.J., 2024. Complete mitochondrial genome of Devarios hanensis (Cypriniformes: Danionidae: Danioninae): Genome characterization and phylogenetic consideration. Mitochond. DNA B, 9: 797-801. https://doi.org/10.1080/23802359.2024.2363367[CrossRef]
- Zeng, Q., Chen, Y.J., Liu, M. and Wang, C., 2024. Characteristics of the complete mitochondrial genome of Gerres limbatus (Cuvier, 1830) (Perciformes: Gerreidae). Mitochond. DNA B, 9: 419-422. https://doi.org/10.1080/23802359.2024.2333571[CrossRef]
- Zhang, B., Sun, Y. and Shi, G., 2014. The complete mitochondrial genome of the four finger threadfin Eleutheronema tetradactylum (Perciforms: Polynemidae) and comparison of light strand replication origin within Percoidei. Mitochond. DNA, 25: 411–413. https://doi.org/10.3109/19401736.2013.809433[CrossRef]
- Zhang, H. and Xian, W., 2016. The complete mitochondrial genome of the larvae Osbeck’s grenadier anchovy Coilia mystus (Clupeiformes, Engraulidae) from Yangtze estuary. Mitochond. DNA A, 27: 966-967. https://doi.org/10.3109/19401736.2014.926508[CrossRef]
- Zhang, J., Zhang, N., Li, Y., Zhang, R. and Lin, L., 2019. Complete mitochondrial DNA genome of Thryssa dussumieri (Valenciennes, 1848). Mitochond. DNA B, 4: 1314-1315. https://doi.org/10.1080/23802359.2019.1591208[CrossRef]
- Zhang, R., Deng, L., Lv, X. and Tang, Q., 2022. Complete mitochondrial genomes of two catfishes (Siluriformes, Bagridae) and their phylogenetic implications. Zookeys, 1115: 103. https://doi.org/10.3897/zookeys.1115.85249[CrossRef]
- Zhang, R., Tang, Q. and Deng, L., 2021. The complete mitochondrial genome of Microphysogobio elongatus (Teleostei, Cyprinidae) and its phylogenetic implications. ZooKeys, 1061: 57. https://doi.org/10.3897/zookeys.1061.70176[CrossRef]
- Zhao, L. and Liu, Q., 2016. Complete mitochondrial genome sequence of Thryssa kammalensis (Clupeiformes, Engraulidae). Mitochond. DNA B, 1: 302-303. https://doi.org/10.1080/23802359.2016.1167637[CrossRef]
Services
Article usage statistics
Loading…