
Iraq’s date palm groves are seeing a resurgence due to their economic value and the export of premium date varieties worldwide. High date production led to the selection of Babylon Governorate as the study area, providing an ideal environment for observing and monitoring the spread of the Dubas bug and assessing its impact. This study aimed to identify the locations of this pest and its spread, as well as analyze its presence in agricultural lands. Modern monitoring methods were employed, including remote sensing and Geographic Information System (GIS) data, owing to their capacity to precisely locate infestation sites and track insect movements in both space and time. Fifteen sites within the governorate’s densely cultivated date palm areas were included in the research. For spring 2022, the highest combined infestation rates were observed and categorized into two severity groups: 5-6 and 7-12. That autumn, the rates varied between 4 and 12. During spring 2023, infestation levels fell into the 2.1–5 and 5.1–8 ranges. In contrast, autumn 2023 saw considerably lower infestation levels, between 0–2 and 0–4.9 . In spring 2024, these patterns persisted, showing infestation levels ranging from 2.1–5 and 0–6. Autumn 2024 saw a substantial reduction in infestation, with levels not surpassing 0–2, deemed very low. The results indicated that the highest infestation rates were concentrated in the districts of Al-Hamza Al-Gharbi, Al-Hashimiya, Al-Qasim, Al-Sadda, Al-Tala’i, Al-Kifl, and Abu Gharaq. It can be concluded that Dubas bug infestation was clearly present in Babylon Governorate during most seasons from 2022 to 2024, except autumn 2024, which saw a significant decline in infestation levels. This marks the commencement of a large-scale control campaign that helped limit the pest’s spread. This study is important because it builds a knowledge base to help decision-makers understand why the Dubas bug spreads in Babylon, evaluate its effects on date output, and develop effective plans to manage it and prevent it from reaching adjacent regions.
Research Article · Volume 39, Issue 3, 8 September 2026 · Open Access
Spatial Analysis in Monitoring and Identifying Areas of Spread of the Dubas Insect in Palm Groves of Babylon Governorate for Spatial Using Geographic Information Systems
· ·
Affiliations & Notes ⌄
- 1Biological Control Department, Al-Mussaib Technical College Al-Furat Al-Awsat Technical University, 51006 Al-Mussaib, Babylon, Iraq
- 2Remote Sensing Unit, College of Science, College of Science, University of Baghdad, Baghdad, Iraq. *Correspondence | Yousif Dakheel Rashid, Biological Control Department, Al-Mussaib Technical College Al-Furat Al-Awsat Technical University, 51006 Al-Mussaib, Babylon, Iraq
- 3Email: Com.usfdr@atu.edu.iq
Article Info ⌄
- Journal:
- Pakistan Journal of Agricultural Research
- Published:
- 8 September 2026
From the article
- The remaining areas, Al-Sadda, Al-Mahawil, Al-Qasim, and Al-Tali’a, were considered severe, with infestations ranging from 2780 to 4999.
- The second group (5.1-8) consisted of mild infestations, indicated by the blue gradient, distributed across all areas of Babylon Governorate except for Al-Hamza Al-Gharbi, with infestations ranging from 492 to 999.
- The other locations in this group showed slight to moderate infections, between 1,000 and 2,330, across all areas except Al-Musayyib, Al-Shumali, Abu Gharq, and Al-Kifl.
- The study concludes that the Dubas bug infestation in Babylon Governorate affected almost all areas except for a very small portion.
Selected from the article's own text.
Abstract
Introduction
In Iraq, the common date palm weevil (Ommatissus binotatus lybicus) is a prevalent pest affecting both fruit-bearing and non-fruit-bearing date palms. This insect consumes leaf sap, leading to decreased chlorophyll, biomass, and nutrient content in the palm. When nymph populations surpass 300 per leaf, studies show a chlorophyll content decrease of 8–11%, and biomass may drop by as much as 34%. Because of these changes, photosynthesis is significantly impaired as the leaves transform from green to yellow and dry up .
In addition, the honeydew from the insect encourages sooty mold, a black fungus that covers the plant’s surface. The leaves, fruits, and fronds are covered by a fungal growth, which inhibits photosynthesis, has a detrimental effect on plant health and growth, thereby directly threatening the economic viability of date palm farming . Successful pest control programs depend on understanding the pest’s biology, monitoring its seasonal numbers, and identifying appropriate control strategies. This includes the use of integrated pest management (IPM) techniques, particularly in the orchards of Babylon Governorate and other affected areas . To assess the severity of date palm infestation, we need to estimate the number and density of nymphs and determine the egg-laying sites on the fronds. This enables direct assessment of affected areas through field experience to find out infestation levels and density .
Field studies have shown that nymphs are often concentrated in the fourth row of fronds, while eggs are most abundant in the fifth row, and honeydew accumulates most heavily in the seventh row of fronds . Climatic factors are among the most significant influences on the activity and spread of the dubas bug. Temperature, relative humidity, wind and its direction, as well as dust and sandstorms, all contribute to changes in infestation levels. The pest’s activity increases with rising temperatures and humidity, while it decreases when these levels decrease .Dust storms help control the insect by spreading it to other locations. If the area is a palm grove, they contribute to its infestation. If the area is barren or contains different plants, these insects die due to the lack of a suitable breeding environment. Wind speed also plays a major role, either in the spread of the insect or in its destabilization and environmental death .
Mokhtar and Al Nabhani (2010) conducted a laboratory study on the developmental stages of the dubas beetle (Ommatissus lybicus Bergevin) and the effect of temperature (nine degrees) on the insect’s developmental stages, which temperatures favor its growth and spread, and which temperatures favor its death. They found that the optimum temperatures for its growth were 15–35°C for all stages (breeding, growth, eggs, and nymphs), with the optimal temperatures being ٣3.4°C, 34.5°C, and 3٥.6°C.
In their study of the relationship between the dubas beetle and fungal spot (Phoenix dactylifera), the study demonstrated that the dubas beetle causes numerous diseases in palm leaves caused by various fungi, such as Cladosporium pseudochalastosporoides, C. endophyticum, Fusarium fujikuroi species complex, F. humuli, F. microconidium, Quambalaria cyanescens, Phaeoacremonium krajdenii, and P. venezuelense. They therefore emphasized the need to address these diseases because they cause damage to date production and weaken its components. Countries are paying great attention to the process of limiting the spread of this insect and combating it, as well as monitoring the impact of control methods and techniques, their effectiveness, the appropriate conditions for them, and their impact on the environment and human health (van den Berg et al., 2021). Publications have contributed to increasing awareness and cooperation to preserve palm tree production and exchange information.
Using effective pesticides, both chemical and biological, can help decrease the dubas bug population and control its spread, according to research . However, the effectiveness of controls is influenced by environmental factors, especially climate, which has the greatest impact because of its detrimental effects on living organisms and public well-being. Vigilant observation and practical expertise are essential to find out the correct pesticide amounts and the best application schedule . Using integrated pest management frameworks, which combine traditional methods with chemical, biological, and agricultural control techniques to reduce the risk of insect spread and prevent and minimize their ability to reproduce and lay eggs . Crucially, remote sensing and GIS enable the monitoring of color changes in date palm groves. Limiting the spread of agricultural pests was achieved by accelerating field surveys and rapidly putting preventive measures in place . All field data and satellite imagery were used in the spatial analysis to determine the distribution and breeding sites of the Dubas bug. Al-Kindi et al. (2022) classified and monitored insect populations in the region by applying hot and cold spot analysis with particular spatial autocorrelation indices. To pinpoint areas containing date palm trees, vegetation cover index analyses were performed , 2023). The Dubas bug sites were sampled, and their presence and coordinates were identified using GPS. Their distribution analysis was then conducted by linking remote sensing and geographic information systems. This study aims to monitor and identify the locations and distribution patterns of the Dubas bug within the orchards of Babylon Governorate, focusing on the causes of its activity and its relationship to climate change.
Materials and Methods
Description and nature of the region
Babylon Governorate has a semi-desert climate characterized by dry weather and extreme In summer, temperatures range between 40 and 50 °C. The winters are quite moderate, experiencing temperatures from 8 to 16 degrees Celsius and minimal precipitation. The average rainfall over the past 25 years has been 80-120 mm, a very low rate. Euphrates River is the primary irrigation source for the Babil Governorate.
It divides into several branches and canals that feed the city and surrounding areas. The most prominent of these branches is the Hilla River, one of the most important rivers in Iraq. It is used for agriculture and drinking water and is considered an important tourist attraction. There are several swamps or dams used for water storage, such as the Hindiya Dam, a historic dam located on the Euphrates River south of the city of Musayyib and considered one of the most important water projects in Iraq. This dam distributes water to various streams in the governorate to serve agriculture, which has facilitated the spread of palm groves and rain-fed agriculture for other crops, as shown Figure 1.
Data acquisition
Field sample data were obtained from the Babylon Agriculture Directorate and its affiliated branches in 15 districts and sub-districts. Fixed tables were prepared for the surveys, including (total area/dunum, surveyed area/dunum, and specific egg rates/leaf, classified from 0-١٢), for three years and two seasons, spring and fall. Data collection relied on the expertise of farmers and agricultural engineers from the agricultural branches to be scientifically tabulated according to international methods. Surveyed areas were selected based on egg infestations in the spring season and monitored in the fall, the breeding season, and fungal residues. The ArcMap v10.4 GIS software package was used to manage and process field data, store it in a database, manipulate and analyze it, and produce maps using modern technologies.
Multiple satellite images with spatial resolution according to the type of geostationary satellite were used to control the study area, which includes Babil Governorate and 15 sites representing the study area, in addition to the rivers on which the governorate’s agriculture depends, according to the Iraqi coordinate systems Universal Transfers Mercoter (UTM), Zone 38, see Tables 1, 2, 3, 4, 5 and 6.
Table 1: Field sample data for the spring of 2022 for 15 districts and sub-districts, according to the scientific standards of international curricula.
|
Spring 2022 |
|||||
|
No |
The Division |
All area |
Survey area |
Agg. rate |
Agg. rate |
|
Region Name E |
(7-12) |
(5-6) |
|||
|
1 |
The Center |
23800 |
6٠٠٠ |
0 |
0 |
|
2 |
Abigharaq |
11500 |
4000 |
0 |
2000 |
|
3 |
Al-kifel |
13000 |
4000 |
0 |
2000 |
|
4 |
Al-Hashimyiea |
16000 |
4000 |
0 |
3000 |
|
5 |
Al-Qasim |
5500 |
2000 |
0 |
2000 |
|
6 |
Al-Taliha |
4000 |
2000 |
0 |
2000 |
|
7 |
Al-Shomily |
10000 |
6000 |
0 |
3000 |
|
8 |
Al-Hamza Algharby |
8000 |
8000 |
6000 |
2000 |
|
9 |
Al-Alnil |
6000 |
2000 |
0 |
0 |
|
10 |
Al-Amam |
1750 |
1000 |
0 |
0 |
|
11 |
Al-Mahawel |
9500 |
4000 |
0 |
3000 |
|
12 |
Al-Mashroa |
4000 |
2000 |
0 |
0 |
|
13 |
Al-Askandyriea |
4500 |
2000 |
0 |
2000 |
|
14 |
Al-Musaieb |
7500 |
3000 |
0 |
0 |
|
15 |
Al-Sada |
16000 |
5000 |
0 |
3000 |
|
Total |
141050 |
55000 |
6000 |
24000 |
|
Table 2: Field sample data for the Autumn of 2022, including (total area/dunum, area covered by survey/dunum, and egg quality rates/leaf, classified from 0 to 12) for 15 districts and sub-districts, according to the scientific standards of international curricula.
|
Autumn 2022 |
||||
|
No |
The Division |
All area |
Survey area |
Agg. rate |
|
Region Name E |
||||
|
1 |
The Center |
23800 |
8000 |
٨٠٠٠ |
|
2 |
Abigharaq |
11500 |
5000 |
٥٠٠٠ |
|
3 |
Al-kifel |
13000 |
3000 |
٣٠٠٠ |
|
4 |
Al-Hashimyiea |
16000 |
4000 |
٤٠٠٠ |
|
5 |
Al-Qasim |
5500 |
2000 |
٢٠٠٠ |
|
6 |
Al-Taliha |
4000 |
2000 |
٢٠٠٠ |
|
7 |
Al-Shomily |
10000 |
5000 |
٥٠٠٠ |
|
8 |
Al-Hamza Algharby |
8000 |
5000 |
٥٠٠٠ |
|
9 |
Al-Alnil |
6000 |
1000 |
١٠٠٠ |
|
10 |
Al-Amam |
1800 |
1000 |
١٠٠٠ |
|
11 |
Al-Mahawel |
9500 |
3000 |
٣٠٠٠ |
|
12 |
Al-Mashroa |
4000 |
1000 |
١٠٠٠ |
|
13 |
Al-Askandyriea |
4500 |
2000 |
٢٠٠٠ |
|
14 |
Al-Musaieb |
7500 |
2000 |
٢٠٠٠ |
|
15 |
Al-Sada |
16000 |
5000 |
٥٠٠٠ |
|
Total |
141100 |
49000 |
49000 |
|
Table 3: Field sample data for the spring of 2023, including (total area/dunum, area covered by survey/dunum, and egg quality rates/leaf, classified from 0 to 12) for 15 districts and sub-districts, according to the scientific standards of international curricula.
|
Spring 2023 |
|||||
|
No |
The Division |
All Area |
Survey area |
Agg rate |
Agg. rate |
|
Region Name E |
(5.1-8) |
(2.1-5) |
|||
|
1 |
The Center |
23800 |
8٠٠٠ |
١٠٠٠ |
0 |
|
2 |
Abigharaq |
11500 |
5000 |
0 |
0 |
|
3 |
Al-kifel |
13000 |
3000 |
0 |
1000 |
|
4 |
Al-Hashimyiea |
16000 |
4000 |
0 |
1000 |
|
5 |
Al-Qasim |
5500 |
2000 |
0 |
2000 |
|
6 |
Al-Taliha |
4000 |
2000 |
0 |
2000 |
|
7 |
Al-Shomily |
10000 |
5000 |
0 |
0 |
|
8 |
Al-Hamza Algharby |
8000 |
5000 |
٨000 |
1000 |
|
9 |
Al-Alnil |
6000 |
2000 |
0 |
0 |
|
10 |
Al-Amam |
1750 |
2000 |
0 |
0 |
|
11 |
Al-Mahawel |
9500 |
3000 |
0 |
3000 |
|
12 |
Al-Mashroa |
4000 |
1000 |
0 |
0 |
|
13 |
Al-Askandyriea |
4500 |
2000 |
0 |
0 |
|
14 |
Al-Musaieb |
7500 |
2000 |
0 |
0 |
|
15 |
Al-Sada |
16000 |
5000 |
0 |
5000 |
|
Total |
141050 |
51000 |
9000 |
15000 |
|
Table 4: Field sample data for the Autumn of 2023, including (total area/dunum, area covered by survey/dunum, and egg quality rates/leaf, classified from 0 to 12) for 15 districts and sub-districts, according to the scientific standards of international curricula.
|
Autumn 202٣ |
|||||
|
No |
The Division |
All area |
Survey area |
Agg. rate |
Agg. rate |
|
Region Name E |
(0-4.9) |
(0-2) |
|||
|
1 |
The Center |
23800 |
5٠٠٠ |
5٠٠٠ |
1000 |
|
2 |
Abigharaq |
11500 |
2000 |
2٠٠٠ |
- |
|
3 |
Al-Kifel |
13000 |
5٠٠٠ |
5٠٠٠ |
- |
|
4 |
Al-Hashimyiea |
16000 |
2000 |
2٠٠٠ |
- |
|
5 |
Al-Qasim |
5500 |
1٠٠٠ |
1٠٠٠ |
- |
|
6 |
Al-Taliha |
4000 |
2000 |
٢٠٠٠ |
- |
|
7 |
Al-Shomily |
10000 |
1٠٠٠ |
1٠٠٠ |
- |
|
8 |
Al-Hamza Algharby |
8000 |
3٠٠٠ |
2٠٠٠ |
2000 |
|
9 |
Al-Alnil |
6000 |
1000 |
١٠٠٠ |
- |
|
10 |
Al-Amam |
1800 |
1000 |
١٠٠٠ |
- |
|
11 |
Al-Mahawel |
9500 |
2٠٠٠ |
2٠٠٠ |
- |
|
12 |
Al-Mashroa |
4000 |
1000 |
١٠٠٠ |
- |
|
13 |
Al-Askandyriea |
4500 |
2000 |
٢٠٠٠ |
- |
|
14 |
Al-Musaieb |
7500 |
2000 |
٢٠٠٠ |
- |
|
15 |
Al-Sada |
16000 |
5000 |
٥٠٠٠ |
- |
|
Total |
141100 |
35000 |
34000 |
1000 |
|
Table 5: Field sample data for the spring of 2024, including (total area/dunum, area covered by survey/dunum, and egg quality rates/leaf, classified from 0 to 12) for 15 districts and sub-districts, according to the scientific standards of international curricula.
|
Spring 2024 |
|||||
|
No |
The Division |
All area |
Survey area |
Agg. rate |
Agg. rate |
|
Region Name E |
(0-6) |
2.1-5 |
|||
|
1 |
The Center |
22000 |
8٠٠٠ |
5000 |
3000 |
|
2 |
Abigharaq |
11000 |
3000 |
0 |
3000 |
|
3 |
Al-kifel |
13000 |
3000 |
3000 |
0 |
|
4 |
Al-Hashimyiea |
15000 |
6000 |
6000 |
0 |
|
5 |
Al-Qasim |
8000 |
4000 |
1000 |
3000 |
|
6 |
Al-Taliha |
5000 |
2000 |
2000 |
0 |
|
7 |
Al-Shomily |
4000 |
2000 |
2000 |
0 |
|
8 |
Al-Hamza Algharby |
10000 |
8000 |
3000 |
5000 |
|
9 |
Al-Alnil |
9000 |
3000 |
3000 |
0 |
|
10 |
Al-Amam |
6000 |
2000 |
2000 |
0 |
|
11 |
Al-Mahawel |
2000 |
2000 |
1000 |
1000 |
|
12 |
Al-Mashroa |
4000 |
1000 |
1000 |
0 |
|
13 |
Al-Askandyriea |
15000 |
5000 |
2000 |
3000 |
|
14 |
Al-Musaieb |
7000 |
2000 |
0 |
2000 |
|
15 |
Al-Sada |
4000 |
2000 |
2000 |
0 |
|
Total |
135000 |
53000 |
33000 |
20000 |
|
Table 6: Field sample data for the Autumn of 2024, including (total area/dunum, area covered by survey/dunum, and egg quality rates/leaf, classified from 0 to 12) for 15 districts and sub-districts, according to the scientific standards of international curricula.
|
Autumn 202٤ |
|||||
|
No |
The Division |
All area |
Survey area |
Agg. rates |
Agg. rate |
|
Region Name E |
(0-3) Thin |
(0-3) |
|||
|
1 |
The Center |
23800 |
2٠٠٠ |
1.2 |
1000 |
|
2 |
Abigharaq |
11500 |
2000 |
1-0.9 |
900 |
|
3 |
Al-kifel |
13000 |
1٠٠٠ |
0.9 |
900 |
|
4 |
Al-Hashimyiea |
16000 |
2000 |
0.3 |
300 |
|
5 |
Al-Qasim |
5500 |
15٠٠ |
0.6 |
600 |
|
6 |
Al-Taliha |
4000 |
1٠٠٠ |
2-0.3 |
1700 |
|
7 |
Al-Shomily |
10000 |
1٠٠٠ |
0.8 |
800 |
|
8 |
Al-Hamza Algharby |
8000 |
2٠٠٠ |
0.51-1.01 |
750 |
|
9 |
Al-Alnil |
6000 |
0 |
0 |
0 |
|
10 |
Al-Amam |
١75٠ |
2٠٠٠ |
2.1-0.4 |
1500 |
|
11 |
Al-Mahawel |
9500 |
1٠٠٠ |
0.7 |
700 |
|
12 |
Al-Mashroa |
4000 |
0 |
0 |
0 |
|
13 |
Al-Askandyriea |
4500 |
2000 |
1.2-1.8 |
1500 |
|
14 |
Al-Musaieb |
7500 |
1٠٠٠ |
0.19 |
200 |
|
15 |
Al-Sada |
١4٠٠٠ |
2٠٠٠ |
1.9-1.7 |
1800 |
|
Total |
139050 |
20500 |
|||
Table 7: A simple explanation of how to classify the injury and its severity when observing a date palm infestation.
|
No. |
Meaning |
Measurement Method |
|
0 |
No visible injury (Negligible) |
No adult or mature insects are found on palm trees. |
|
1 |
Low-moderate injury |
Insects are present, but at low densities, i.e., few in number or limited infestation on palm trees. |
|
2 |
High injury |
High insect densities, clear infestations, and widespread infestation on the farm, with bacterial residues and visible damage to the palm trees. |
Table ٨: Classification of the collection rate and level of damage to palm groves caused by infestation.
|
Agg. Rate |
Infestation level |
|
0 – 2 |
Very low infestation (may be neglected or not require treatment) |
|
2.1 – 5 |
Mild infestation |
|
5.1 – 8 |
Moderate infestation |
|
7 – 12 |
High infestation |
|
> 12 |
Very severe/ Epidemic infestation |
Classification samples
The term “egg/frond ratio” (Agg. rate) is a descriptive and estimative measure of the presence of the dubas insect on palm leaves (fronds) .
If the egg/frond ratio is (0-2), this means:
- 0= No dubas insect infestation.
- 1= Slight infestation, meaning there are limited numbers on the palm leaves.
- 2= Severe infestation, occupying a visible area on a single palm or group.
If the scale is at 1, it is called a qualitative (estimated) scale, as the insect infests a clean field for the first time and in scattered numbers here and there. Experience plays a significant role here. If the scale is at 2 and above, it is a numerical aggregation rate, indicating “number of insects/leaf,” “insect/palm,” or “unit area.” The results are then classified into categories, as in Table 1.
Sample collection
How is the agg. rate calculated, collected, and classified practically in orchards of different sizes? .
- Sampling: A random number of palm trees is selected, for example, 1–30 palm trees in each orchard.
- Specific leaflets are identified by base, middle, and tip.
- Counting insects: Nymphs or adults are counted on each leaf (the lower surface).
- Calculating the aggregation rate: Agg. rate = total number of insects ÷ number of leaves or samples examined.
- This gives the insect rate in the sample.
- Classification: A calculated rate is calculated within each class, as shown in Table 2:
Therefore, field collection rates vary and can be understood by applying the equation and knowing the extent of infestation. Field experience plays a significant role in monitoring, control, and situation assessment from one study to another .
Researchers and agricultural engineers report the collection rate using simple scales in certain orchards (for example, 0-2), while in other orchards, they classify it into broader ranges, such as in our current study, as shown in the sequence:
- (0–2)
- (0–3)
- (2-3)
- (3.1–5)
- (5–6)
- (5.1–8)
- (4–9)
- (7–12)
Remote sensing (RS)
Remote sensing is the practice of gathering and examining data about objects, places, or events from afar, without physical interaction. According to Athraa and Fouad (2025), this process involves measuring and recording the energy reflected or emitted by them in different spectral bands. Therefore, remote sensing techniques allow us to extract information that cannot be obtained through traditional imaging methods, which can help us understand the Earth’s surface changes better. Using these techniques, we can track vegetation cover and agricultural land use and study all the environmental and geological connections in a region . Remote sensing from satellites is notable because it can be used on various platforms. We can use sensors thanks to their advanced temporal and spatial accuracy, enabling precise monitoring and analysis in environmental surveillance . Remote sensing data can be used in environmental monitoring applications and vegetation cover assessment, where important climate data is recorded .
Geographic information systems (GIS)
Geographic Information Systems (GIS) software creates a unified system for modeling reality and is used to collect, analyze, and manage geographic data. This allows for the linking of spatial data (related to geographic location) with metadata. With it, you can create maps, analyze environmental phenomena, identify climate hazards, and plan land use. It is designed to collect, analyze, and oversee geographic data. It stands out because of its distinctive traits, delivering a complete answer to various issues and thus offering prompt resolutions .
GIS operates using diverse sources of information, which may be collected manually through field samples or automatically via aerial and satellite imagery, with the With GIS, results can be displayed instantly in various formats, including on-screen, maps, posters, or statistical reports, distinguishing them from many other software programs available on the market. These tools are standard for both research and academic pursuits. This is beneficial when studying data that includes coordinates, sample locations, and satellite imagery, enabling researchers to conduct precise spatial analysis and make better decisions .
Spatial interpolation technique
Interpolation, a statistical and mathematical method, It is used to estimate the values of unmeasured locations using specific data from locations within the study area. This allows us to compare spatial relationships between different geographical elements. The idea behind spatial interpolation is that nearby places exhibit greater similarity than remote ones .
Inverse distance weighted (IDW)
It is a statistical tool that’s part of the GIS software package. We used this tool with real-world geographic coordinates represented by points and lines. In the program, these coordinates are shown as (x, y) point locations.
It is used to calculate and interpolate inverse distances between neighboring areas, starting from the shortest inverse distance (the two farthest real areas) . It is a predictive method used in studies to find unknown geographic areas from known geographic areas. It is presented in the form of a progressive visual map based on known values .
Results and Discussion
Controlling the spread of the Dubas insect and the strategic economic threat it poses to the important province of Babylon, which has a large area and borders five provinces, and where date orchards are the main source of income for its residents. Neglecting to monitor and combat this insect increases the possibility of its rapid transfer and spread to these provinces or knowing from which province the insect was transferred. By using the interpolation technique and applying the IDW method, and producing predictive maps, we can monitor and control the spread of the Dubas insect, thus providing a GIS model to researchers and beneficiaries to find quick solutions and identify the locations of infestations with this insect.
We will display the results for the years 2022, 2023, and 2024, with the spring season first and the Autumn season second.
Results and Discussion
In the discussion, we will focus on classifying Dubas insect infestations in the surveyed areas and the total areas only, due to the similarity in the quantity of total areas and surveyed areas. The reason is that the infested areas do not need to exert effort to spread due to the suitable conditions of humidity and appropriate temperatures. So, whether the surveyed area is small or large, an actual infestation has been recorded for all areas in the Babylon Governorate.
From Figures 2 and 3, we observe a continuous increase in infections. After classifying the infections, the highest number of infections, ranging from (5-6) and (7-12), occurred in the spring of 2022 and are considered moderate to severe. These infections were concentrated in the Al-Hamza Al-Gharbi district. In the autumn, the number of infections ranged from (4-12), which is also the highest and is considered severe. According to the surveyed areas, the number of infections ranged from 1000 to 1780, the lowest, and is shown in blue to light blue. These infections were concentrated in the Al-Mashrou’ sub-district, with higher concentrations in the Al-Sadda and Jurf Al-Nasr districts, ranging from 1790 to 2560. In Al-Hashimiya and Al-Qasim, the Agg. Rate from 1790 to 3330. The highest number of infections was in Agg.Rate of 4900 to 8000, shown in orange, gradually turning to deep red. These are considered very severe infections and are found in the central areas and a very small part of the Abi Gharq area, and it was focused very much in Al-Hamza Al-Gharbi and Al-Shoumali.
In the spring of 2023, there were also two groups of infestations, the first group being (2.1-5) and (5.1-8), which are considered moderate to severe. The first group (2.1-5) was distributed across all areas of Babylon Governorate except for Al-Sadda, Al-Mahawil, Al-Qasim, and Al-Tali’a, with infestations ranging from 178 to 1660, considered mild. The remaining areas, Al-Sadda, Al-Mahawil, Al-Qasim, and Al-Tali’a, were considered severe, with infestations ranging from 2780 to 4999. The second group (5.1-8) consisted of mild infestations, indicated by the blue gradient, distributed across all areas of Babylon Governorate except for Al-Hamza Al-Gharbi, with infestations ranging from 492 to 999. The remaining severe infestations were in Al-Hamza Al-Gharbi, with infestations ranging from 888 to 7990.
We recorded two infection groups in autumn 2023. In Al-Hamza Al-Gharbi, Al-Hashimiya, Al-Qasim, and Al-Shumali, infections were mild to moderate (0–2), affecting 667 to 2,000 individuals.
Other areas within this group exhibited very mild infections, ranging from 222 to 666.
Infection rates between 2,340 and 5,000, classified as severe, were observed in the second group (0–4.9) across Al-Musayyib, Al-Shumali, Abu Gharq, and Al-Kifl.
The other locations in this group showed slight to moderate infections, between 1,000 and 2,330, across all areas except Al-Musayyib, Al-Shumali, Abu Gharq, and Al-Kifl.
From Figure 4, Alternatively, two infection groups were found in spring 2024: group one (2.1–5) and group two (0–6), both considered moderate to severe.
The first group was distributed across Al-Hamza Al-Gharbi, Al-Hashimiya, Al-Qasim, Al-Shumali, Al-Tali’a, Al-Sadda, and Al-Imam, with aggregate infection rates covering the range of 2,220 to 5,000, this signifies a serious outbreak across a broad region.
The rest of the locations were classified as mild, showing infection rates from 555 to 1,680.
During the autumn of 2024, a single infection cluster (0–3) was recorded, ranging from mild to severe. These cases affected all areas of Babil Governorate except the Project area, Imam area, and the southern part of Al-Sadda district. Moderate to severe infections in this cluster were between 800 and 2,000, with all other cases being very mild, from 200 to 799.
The effective control of the epidemic during this period is significant, showcasing the success of the management strategies employed.
Contour lines
Figure 5 represents the spatial boundaries, represented by contour lines that correspond to the color gradients in Figure 4. These are time intervals used in the prediction process for hard-to-reach or potentially affected areas, based on real data from actual samples taken during surveys. These boundaries are useful for tracking the spread of the dubas bug infestation and monitoring its spatial expansion in all directions, whether positive or negative, as well as for assessing the effectiveness of control and eradication efforts.
The contour line technique is a predictive process where the lines represent the predictive boundaries, and the area between them represents the predicted range or forecast zone for the spread of the dubas bug.
Conclusions
The study concludes that the Dubas bug infestation in Babylon Governorate affected almost all areas except for a very small portion. We can say that the infestation struck Babylon Governorate, peaking in the spring and autumn seasons of 2022 and 2023, and again in the spring of 2024. Infestations ranged from moderate to severe. The Agg. Rate was classified as (5-6) and (7-12), representing two groups, in the spring of 2022. In the autumn, it was (4-12), and in the spring of 2023, it was (2.1-5) and (5.1-8), again representing two groups. In the autumn, it was (0-2) and (0-4.9), again representing two groups. Finally, in the spring of 2024, there were two groups of severe infestations: (2.1-5) and (0-6).
We present subjective experimental findings to highlight that this concern is amplified by the Babylon Governorate’s central location, bordering five other governorates abundant with date palm orchards, which is strategically important. Hence, the accurate identification of individual date palm trees, the determination of their insect infestation levels, and the mitigation of adverse effects on date palm production are crucial.
Acknowledgments
We would like to express our sincere gratitude to the Department of Biological Control Technologies at Al-Musayyib Technical College for their valuable support and assistance in completing this research and fulfilling all its requirements.
We also thank the Babil Governorate Agriculture Directorate, Dubas Bug Control Division, for providing us with sample data for the years 2022-2024, covering both the spring and autumn seasons. Finally, we thank the Remote Sensing Unit at the College of Science, University of Baghdad, for providing us with remote sensing data and profile files, which greatly facilitated the completion of this research.
Novelty Statement
The study’s novelty lies in its comparative assessment of field data and satellite imagery for spatial analysis to pinpoint the Dubas bug’s range and breeding grounds. Dubas bug sites are monitored for insect populations in the region using hot- and cold-spot analyses, along with specific spatial autocorrelation indices, to assess their activity relationship to climate change.The study’s novelty lies in its comparative assessment of field data and satellite imagery for spatial analysis to pinpoint the Dubas bug’s range and breeding grounds. Dubas bug sites are monitored for insect populations in the region using hot- and cold-spot analyses, along with specific spatial autocorrelation indices, to assess their activity relationship to climate change.The study’s novelty lies in its comparative assessment of field data and satellite imagery for spatial analysis to pinpoint the Dubas bug’s range and breeding grounds. Dubas bug sites are monitored for insect populations in the region using hot- and cold-spot analyses, along with specific spatial autocorrelation indices, to assess their activity relationship to climate change.
Author’s Contribution
HYM, YDR Writing original draft. HYM, YDR, and FKMA design of methodology, YDR, and FKMA Project administration, HYM, YDR, and FKMA conducted laboratory analyses, whereas HYM, YDR, and FKMA conceived the idea and supervised the work. YDR and FKMA Writing review and editing.
Funding
No grants from public, commercial, or not-for-profit funding bodies supported this research.
Ethical clearance
No ethical approval was needed for this research because it did not involve any human participants or animals.
Generative AI and AI assisted technology statement
The authors declare that no generative AI and AI assisted technology was used in the creation of this manuscript.
Conflict of interest
The authors have declared no conflict of interest.
Figures
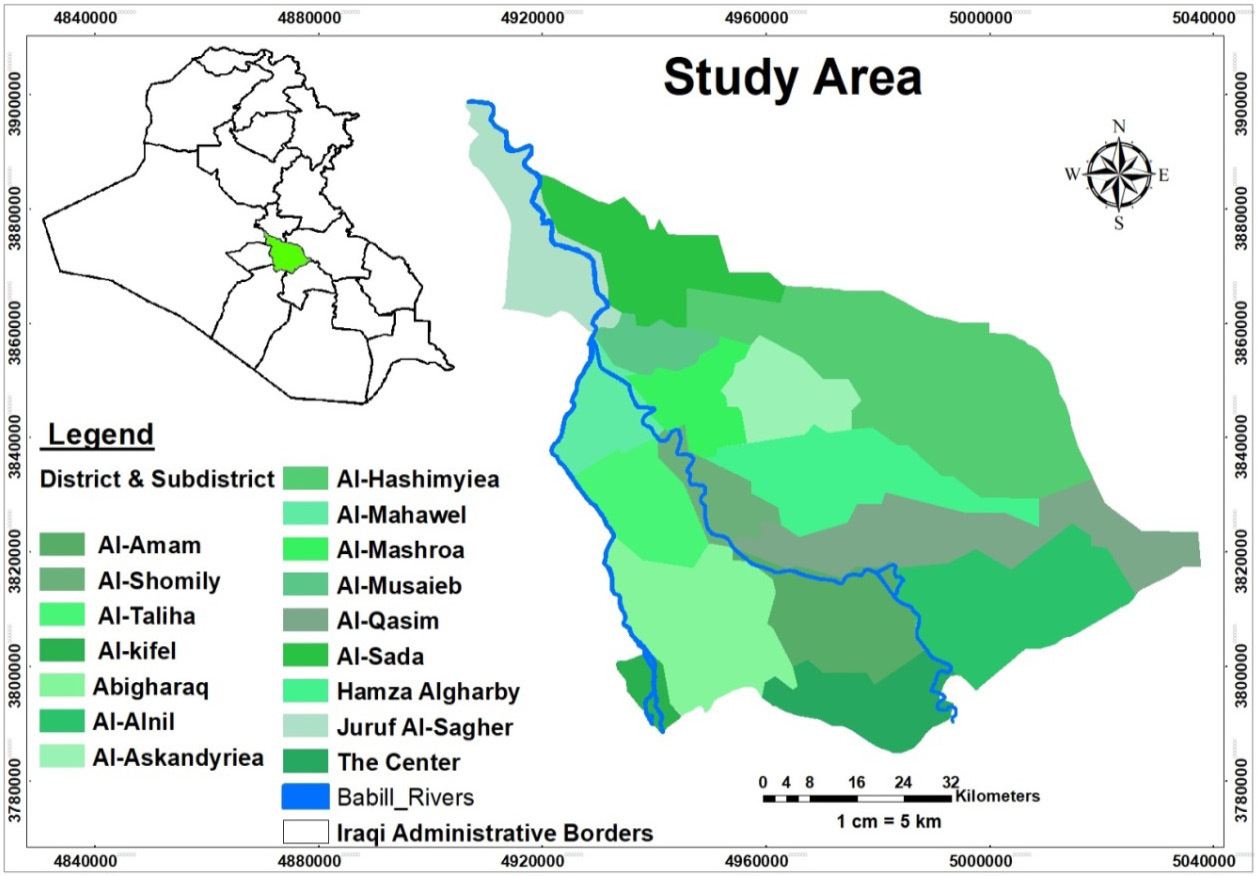
Study Area, Represents the districts and regions that include orchards infected with the Dubas insect.
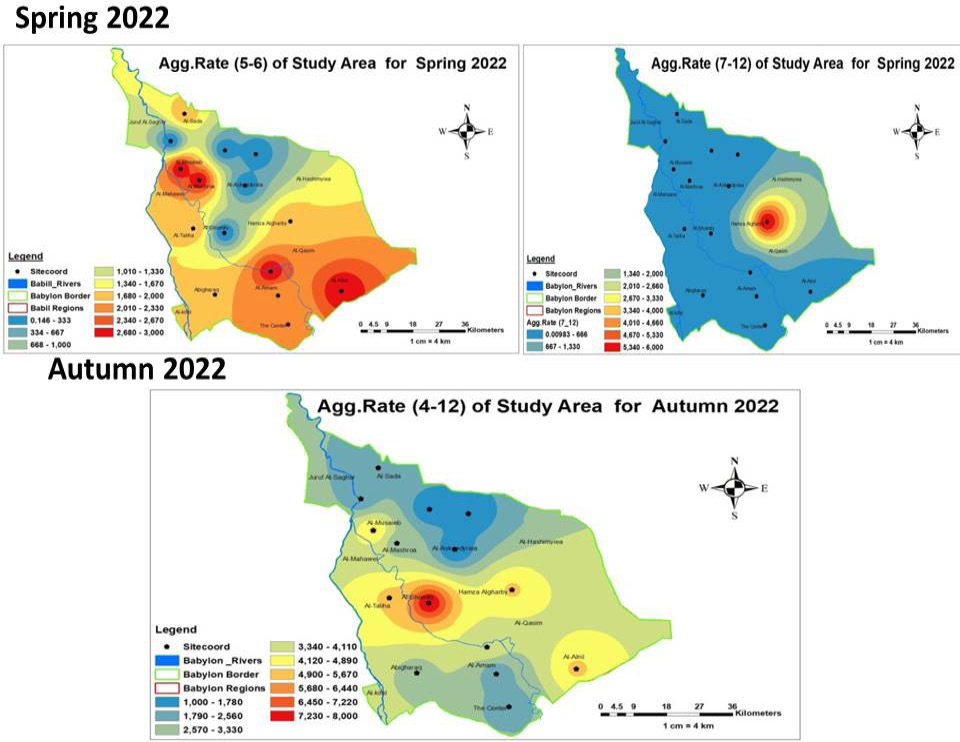
Spatial distribution of the Dubas insect using the IDW method of interpolation for the Spring and Autumn of 2022 in Babylon Governorate. Spring has two aggregation classifications, and Autumn has one aggregation.
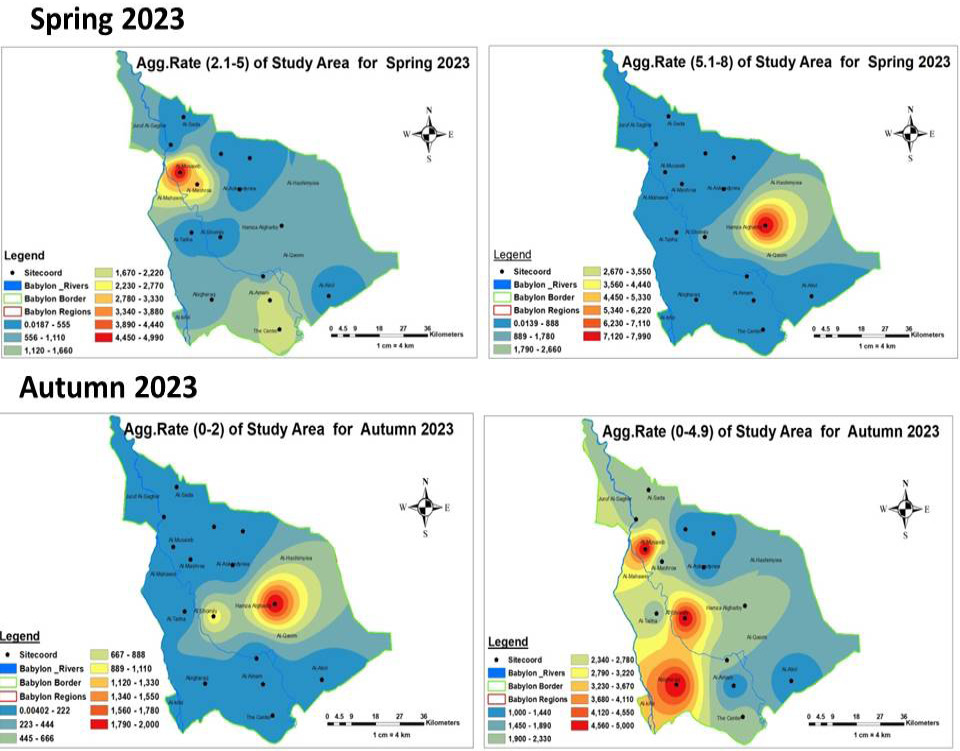
Spatial distribution of the Dubas insect using the IDW method of interpolation for the Spring and Autumn of 2023 for two aggregation classifications in Babylon Governorate.
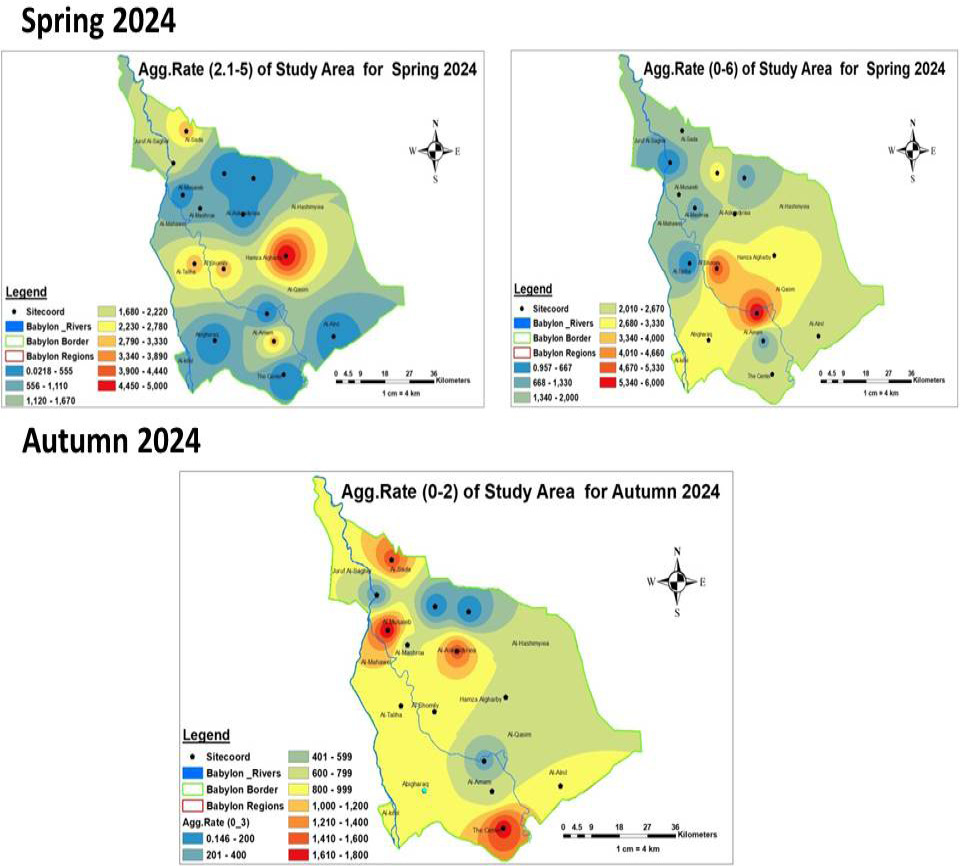
Spatial distribution of the Dubas insect using the IDW method of interpolation for the Spring and Autumn of 2024 in Babylon Governorate. Spring has two aggregation classifications, and Autumn has one aggregation.
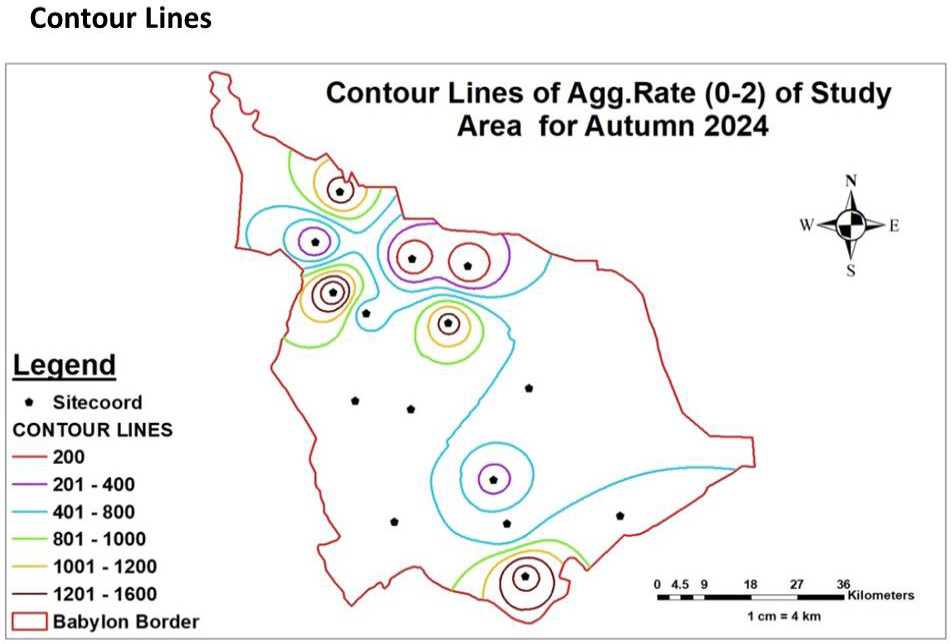
Spatial distribution boundaries of the Dubas insect using the Contour Lines method for the autumn season of 2024 in Babylon Governorate.
References
- Al-Abri, N., Al-Raqami, S., Al-Hashemi, M., Al-Shidi, R., Al-Khatri, S. and Ray, R.V., 2022. Impact of initial population density of the dubas bug, Ommatissus lybicus (Hemiptera: Tropiduchidae), on oviposition behaviour, chlorophyll, biomass and nutritional response of date palm (Phoenix dactylifera). Insects, 14(1): 12. https://doi.org/10.3390/insects14010012[CrossRef]
- Al-Azzawi, M.M. and Mohammed, R.A., 2023. Physiological and biochemical impacts of Dubas bug (Ommatissus lybicus) infestation on date palms. Insects, 14(1): 12. https://doi.org/10.3390/insects14010012[CrossRef]
- Al-Dulaimi, A.H. and Al-Janabi, M.A., 2009. The influence of climatic factors on the spatial distribution of Dubas bug in western Iraq. Acta Hortic., 882: 479–486.
- Al-Hafidh, E.M., Alwan, A.H. and Ali, S.H., 2021. Integrated management for major date palm pests in Iraq. Emirates J. Food Agric., 33(5): 353-361.
- Al-Kindi, K.M., Zahra, A. and Mohammed, A., 2022. Geospatial detection of Ommatissus lybicus de Bergevin using spatial and machine learning techniques. Remote Sens. Appl. Soc. Environ., 28: 100814. https://doi.org/10.1016/j.rsase.2022.100814[CrossRef]
- Al-Kindi, K. M., A.K. Al-Wahaibi, P. Kwan, N.R. Andrew, M. Welch, M. Al-Oufi and Z. Al-Hinai. 2018. Predicting the potential geographical distribution of parasitic natural enemies of the Dubas bug (Ommatissus lybicus de Bergevin) using geographic information systems. Ecol Evol., 8:82978310. https://doi.org/10.1002/ece3.4286[CrossRef]
- Al-Mulla, Y., Ali, A. and Parimi, K., 2023. Detection and analysis of Dubas-infested date palm trees using deep learning, remote sensing, and GIS techniques in Wadi Bani Kharus. Sustainability, 15(19): 14045. https://doi.org/10.3390/su151914045[CrossRef]
- Al-Nabhani, S. S.,R. Velazhahan, S. Hussain, S. Al-Raqmi, M. Al-Hashmi and A.M. Al-Sadi. 2023. Relationship between dubas bug (Ommatissus lybicus) infestation and the development of fungal-induced leaf spots in date palms (Phoenix dactylifera). Insects, 14(3): 283.
- Al-Sadi, A.M., Al-Nabhani, S., Velazhahan, R., Hussain, S., Al-Raqmi, S. and Al-Hashmi, M., 2023. Relationship between dubas bug (Ommatissus lybicus) infestation and the development of fungal-induced leaf spots in date palms (Phoenix dactylifera). Insects, 14(3): 283. https://doi.org/10.3390/insects14030283[CrossRef]
- Al-Zubaidy, H.A., Mohammed, K.H. and Abbas, A.H., 2019. Spatial distribution of dubas bug, Ommatissus lybicus (Hemiptera: Tropiduchidae) in date palm frond rows. Int. J. Entomol. Res., 7(2): 25-31.
- Athraa, A.A. and Fouad, K.M.A., 2025. Environmental assessment of atmospheric pollutant concentrations in Al-Daura refinery and its adjacent areas using GIS and RS techniques. Iraqi J. Phys., 23(3): 137-148. https://doi.org/10.30723/ijp.v23i3.1332[CrossRef]
- Athraa, A. Sant, Fouad, K. and Al-Ramahee. 2024. Monitoring changes with spatiotemporal resolution in land surface temperature (LST) impact on land cover around al-dora refinery in downtown Baghdad, Iraq. Iraqi Geol. J., 57(2B): 310-323. https://doi.org/10.46717/igj.57.2B.21ms-2024-8-31[CrossRef]
- Fouad, K.M., Ali, A.S. and Abdulrahman, B.A., 2022. The modern techniques in spatial analysis to isolate, quarantine the affected areas and prevent the spread of COVID-19 Epidemic. Iraqi J. Sci., 63(9): 4102-4117. https://doi.org/10.24996/ijs.2022.63.9.38[CrossRef]
- Fouad, K.M.A., Faleh, H.M. and Ali, K.M.A., 2023. Finding the best analysis for the sleeper cells of terrorist acts in the crowded areas of human activities in the city of Baghdad. Iraqi J. Sci., 64(12): 6662-6674. https://doi.org/10.24996/ijs.2023.64.12.44[CrossRef]
- Guindon, B. and Zhang, Y., 2007. Using satellite remote sensing to survey transport-related urban sustainability: Part II. Results of a Canadian urban assessment. Int. J. Appl. Earth Observ. Geoinf., 9(3): 276-293. https://doi.org/10.1016/j.jag.2006.09.006[CrossRef]
- Guindon, D.A. 2024. Comparative analysis of remote sensing and ground-based surveys in determining merchantable volume of a boreal forest stand (Doctoral dissertation). Lakehad University , Ontario, Canada.
- Hajjar, M.J., Nazeer, A., Khalid, A.A. and Hidayat-Ullah. 2023. Integrated insect pest management techniques for rice. Sustainability, 15(5): 4499. https://doi.org/10.3390/su15054499[CrossRef]
- Hussain, A.A., 1963. Biology and control of the dubas bug, Ommatissus binotatus lybicus de Berg. (Homoptera, Tropiduchidae), infesting date palms in Iraq. Bull. Entomol. Res., 53(4): 737-745. https://doi.org/10.1017/S0007485300048458[CrossRef]
- Jordana, A.F., Joana, M.S.F., Aline, H.N.M., Paulo, M.P.L. and Carla, B.G.B., 2024. Pesticide translocation using nonpressurized and pressurized endotherapeutic treatments in coconut palms. Horticulturae, 10(4): 386. https://doi.org/10.3390/horticulturae10040386[CrossRef]
- Khalaf, M.Z. and Khudhair, W., 2015. Spatial distribution of Dubas bug, Ommatissus lybicus (Homoptera: Tropiduchidae) in date palm frond rows. Int. J. Entomol. Res., 3(1): 9–13.
- Khalifa M A., Ali K. A., Paul K., Nigel R. A., Mitchell W., Mohammed, A. and Zakariya, A., 2018. Predicting the potential geographical distribution of Ommatissus lybicus using ecological niche modeling. Geogr. Distribut., 8(16): 8297-8310. https://doi.org/10.1002/ece3.4286[CrossRef]
- Khalifa, M.A., Paul, K., Negil, R.A. and Metchell, W., 2017. Remote sensing and spatial statistical techniques for modelling Ommatissus lybicus (Hemiptera: Tropiduchidae) habitat and population densities., PMID: 28875085: PMC5581945
- Mahmoudi, M., Gheybi, M. and Khoshnoud, M., 2020. A study on different sampling techniques for dubas bug, Ommatissus lybicus (Hem.: Tropiduchidae). Plant Pest Res., 10(3): 17-33.
- Mohammad, A.T., Ali, A.K. and Muhsun, A.A., 2023. The efficiency of using integrated control agents to manage the Dubas bug Ommatissus binotatus lybicus De Berg (Homoptera: Tropiducidae) in Karbala Governorate. Iraqi J. Agric. Sci., 10(4): 208-220. https://doi.org/10.59658/jkas.v10i4.1311[CrossRef]
- Mokhtar, A. M., and S.S. Al Nabhani. 2010. Temperature-dependent development of dubas bug, Ommatissus lybicus (Hemiptera: Tropiduchidae), an endemic pest of date palm, Phoenix dactylifera. Eur. J. Entomol., 107(4):681-685.
- Nicolas, R.D., 2021. Remote sensing applications in environmental and earth system sciences. CRC Press, 3: 870.
- Rashid, H.A., Lalit, K., Salim, A.H.A. and Najat, A.A., 2019. Ommatissus lybicus infestation in relation to spatial characteristics of date palm plantations in Oman. Agriculture, 9(3): 50. https://doi.org/10.3390/agriculture9030050[CrossRef]
- Rawaa, N.A., Jinan, S.A. and Fouad, K.M.A., 2024. A study of the analysis of chlorophyll-a phytoplankton in the Tigris rivers for some regions of Iraq by using GIS techniques. Asian J. Water, Environ. Pollut., 21(5): 85–93. https://doi.org/10.3233/AJW240063[CrossRef]
- Rinaldi, L., Cascone, C., Sibilio, G., Musella, V., Taddei, R. and Cringoli, G., 2004. Geographical information systems and remote sensing technologies in parasitological epidemiology. Parassitologia, 46(1-2): 71-74.
- Sarah, H.J., Jinan, S.A. and Fouad, K.M.A., 2025. Monitoring the Tigris River Meander Pollutants by Using GIS and Remote Sensing Techniques., IOP Conf. Series: Earth Environ. Sci., 1531(2025): 012015. https://doi.org/10.1088/1755-1315/1531/1/012015[CrossRef]
- Sinha, S., A. Sharma, S.K. Sharma, P. Kumar, S. Tripathi and S. Mishra. 2021. A review on assessment of camera sensors and data acquisitions using satellite imaging for remote sensing. International Journal of Space Science and Engineering, 6(3): 209-226. https://doi.org/10.1504/IJSPACESE.2021.113896[CrossRef]
- Shivansh, S., Abhishek, S., Sanjay, K.S., Parvin, K., Shraddha, T. and Saurabh, M., 2021. A review on assessment of camera sensors and data acquisitions using satellite imaging for remote sensing. Int. J. Space Sci. Eng., 6(3): 209-226. https://doi.org/10.1504/IJSPACESE.2021.113896[CrossRef]
- Torres, P., M. Rodes-Blanco, A. Viana-Soto, H. Nieto and M. García .2021. The role of remote sensing for the assessment and monitoring of forest health: A systematic evidence synthesis. Forests 12, no. 8: 1134. https://doi.org/10.3390/f12081134[CrossRef]
- Van den Berg, H., Velayudhan, R. and Yadav, R.S., 2021. Management of insecticides for use in disease vector control: Lessons from six countries in Asia and the Middle East. PLoS Neglect. Trop. Dis., 15(4): e0009358. https://doi.org/10.1371/journal.pntd.0009358[CrossRef]
Services
Article usage statistics
Loading…