ResearchersLinks

Short Communication · Volume 54, Issue 1, 19 December 2021 · Open Access

Seasonal Abundance of Adult Pink Bollworm Pectinophora gossypiella (Saunders) at Tandojam, Pakistan

· · · · ·

Affiliations & Notes ⌄
  1. 1Nuclear Institute of Agriculture, Tandojam-70060 , * Corresponding author: uakhan1987@hotmail.com
Article Info ⌄
Journal:
Pakistan Journal of Zoology
Published:
19 December 2021

From the article

  • During 2017, the lowest moth population (1.5 moths/trap) was recorded in February.
  • During the third year of the study, the moth population was recorded in two peaks.
  • Moth emergence increased substantially from August onwards and reached at its highest peak in the month of October with population of 156.6 moths/trap.
  • Higher moth catches of 103.3 and 146.3 moths/trap were recorded in the month of September and November, respectively.

Selected from the article's own text.

Abstract

The seasonal abundance of the pink bollworm, Pectinophora gossypiella (Saunders) (Lepidoptera: Gelechiidae), was investigated from January 2016 to December 2018 in Tandojam, Pakistan, through pheromone trapping. Results showed that adult moths were present throughout the year in Tandojam. Moth abundance varied among months due to differences in weather conditions and host availability. The greatest moth populations were observed from August to November. Peak abundance occurred in September 2016 and 2017 (103.8 and 95.8 moths/trap, respectively), and in October 2018 (156.6 moths/trap). The lowest populations were recorded in June 2016 and 2018 (4.3 and 2.3 moths/trap, respectively), and in February 2017 (1.5 moths/trap). Trap catches were positively correlated with temperature and relative humidity, but negatively correlated with sunshine, in all three years. Rainfall was positively correlated with trap catches in 2016 and 2017, but negatively correlated in 2018. Multiple regression analysis was used to estimate the combined effect of all weather factors on population fluctuation of pink bollworm. The R2 values indicated that weather factors cumulatively explained 76.4, 91.4 and 69.4% of variability in the abundance of pink bollworm in 2016, 2017 and 2018, respectively. The results of the study allow pest managers to focus treatment during the time of year when moths are most abundant.


Materials and methods

The experiment was designed to monitor the seasonal abundance of pink bollworm and determine the impact of weather factors on its adult population for three consecutive years (2016 to 2018). Four red Delta trap® were baited with Gossyplure® and installed in a one hectare area at the research farm of Nuclear Institute of Agriculture, Tandojam. Cotton was cultivated in the plot for the last 35 years with the land uncultivated during the Rabi season (November-March). Traps were suspended on a stick 50 m apart and 1.25 m above ground level. Traps and lures were replaced every 15 days. The data for adult moth catches were recorded at fortnightly intervals. To evaluate the influence of weather factors on pink bollworm, meteorological data, i.e. minimum and maximum temperature, rainfall (mm), sunshine (h) and relative humidity were obtained on monthly basis from Regional Agromet Centre, Tandojam. Monthly changes in meteorological data during the course of study are presented in Supplementary Figure 1.

Correlation of adult moth catches with individual abiotic factors was computed with StatSoft Statistica (2011). The relationship between weather factors minimum and maximum temperature (°C), rainfall (mm), sunshine (h) and relative humidity with pink bollworm catches were evaluated using multiple regression analysis.

Results and discussion

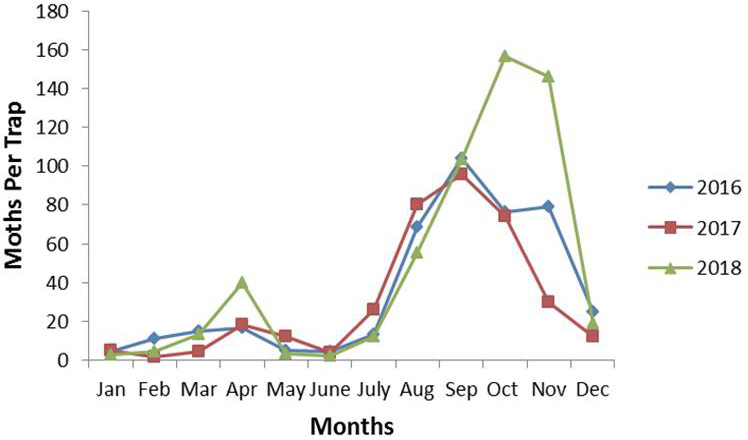
The mean adult moth catches of pink bollworm in different months during the year 2016-18 are presented in Figure 1. The results show pink bollworm to be active in all months with the lowest moth catches recorded in the month of June (4.2 moths/trap). A drastic reduction in moth population was recorded during the hot summer months such as May to July and after that population started increasing till it reached its peak in September. The population remained high for four months i.e. August - November with average catches of 68.3, 103.8, 76.1 and 79.3 moths/trap, respectively. The pink bollworm moth catches declined thereafter, with 24.9 moths/trap recorded in December.

During 2017, the lowest moth population (1.5 moths/trap) was recorded in February. Thereafter, the population gradually started increasing, peaking in April (18.5 moths/trap). Moth catches were lower in June with an average of 3.8 moths/trap. From July onwards, population started increasing and reached the highest peak of the year in September with 95.7 moths/trap. The population declined, until the end of December with 12.1 moths/trap. Highest captures of 80.2 and 74.1 moths/trap were recorded in August and October, respectively.


During the third year of the study, the moth population was recorded in two peaks. A first smaller peak was recorded in April with 39.8 moths/trap. Thereafter, captures declined until June with lowest moth catches of 2.2 moths/trap. Lower captures of 2.8, 4.2, 3.2 and 12.1 moths/trap were recorded in the months of January, February, May and July, respectively. Moth emergence increased substantially from August onwards and reached at its highest peak in the month of October with population of 156.6 moths/trap. Higher moth catches of 103.3 and 146.3 moths/trap were recorded in the month of September and November, respectively. The population dropped strikingly after November with captures of 19 moths/trap in December. The trend of pink bollworm population was almost similar during period of study. However, population recorded during 2018 was on higher side during the months of population peaks.

During the first year (2016) of investigation, correlation studies revealed that pink bollworm adult moth catches had positive correlation with minimum temperature (r = 0.1221), maximum temperature (r = 0.1049), rainfall (r = 0.2766) and relative humidity (r = 0.4764) while weak negative correlation was observed with sunshine (r = -0.0700). Similarly in the year 2017, pink bollworm population showed positive correlation with minimum temperature (r = 0.435), maximum temperature (r = 0.0909,) rainfall (r = 0.4543), relative humidity (r = 0.4982), and negative correlation with sunshine (r = -0.0636). During the third year of study, pink bollworm population showed negative correlation with rainfall (r = -0.3018) in contrast to first two years while the other factors i.e. relative humidity (r = 0.1852), minimum temperature (r = 0.0466) and maximum temperature (r = 0.0915) were positively correlated (Table I). None of the weather factors measured had significant (p < 0.05) association with P. gossypiella population.

Table I.- Correlation (r) and regression values of different weather factors in relation to pink bollworm moth catches.

Year / Parameters

r

p

Regression equation

2016

Min. temp. (°C)

0.1221

0.7054ns

y=22.359+0.6764x

Max. temp. (°C)

0.1049

0.7455ns

y=8.952+0.756 x

Relative humidity(%)

0.4764

0.1174ns

y= -78.510+2.0667x

Sunshine (h)

-0.0700

0.8290ns

y=54.5098–2.1501x

Rainfall (mm)

0.2766

0.3842ns

y=32.115+6.6408x

2017

Min. temp. (°C)

0.435

0.1581ns

y= -6.3774+2.0429x

Max. temp. (°C)

0.0909

0.7789 ns

y=14.683+0.4681x

Relative humidity(%)

0.4982

0.0992ns

y= -81.602+2.0195x

Sunshine (h)

-0.0636

0.8443ns

y=43.857–1.5938x

Rainfall (mm)

0.4543

0.1379ns

y=24.855+19.476x

2018

Min. temp. (°C)

0.0466

0.8855ns

y=38.694+0.4298x

Max. temp. (°C)

0.0915

0.7774ns

y=12.360+0.9818x

Relative humidity(%)

0.1852

0.5645ns

y= -23.805+1.312x

Sunshine (h)

-0.0192

0.9529ns

y=54.2974–0.9493x

Rainfall (mm)

-0.3018

0.3405ns

y=55.4826–219.47x

r, correlation values; ns, non-significant (p > 0.05).

The results regarding multivariate regression analysis between weather factors and pink bollworm population are presented in Table II. It is evident from the table that during the year 2016 relative humidity has 73.9% impact on the pink bollworm population fluctuation. The other factors like minimum temperature, maximum temperature, rainfall and sunshine showed nugatory influence on the per unit change in pink bollworm population having 1.5, 0, 0.2 and 0.8% impact, respectively. All these traits cumulatively have 76.4% role on the pink bollworm population fluctuation. During the year 2017, sunshine has 37.7% impact on the population of pink bollworm followed by rainfall, minimum and maximum temperature with 21.4%, 18.9% and 9.4% impact, respectively. However, cumulatively all these factors contributed 91.4% in the fluctuation of adult population. Similarly, relative humidity was the most influential factor with 54% impact on the pink bollworm during the next year (2018) of study and cumulative contribution of all weather factors towards population change was 69.4%.

Our data on seasonal abundance indicated two peaks of moth population during each year, first a small peak in April and second, bigger peak in September/October. The abundance of pink bollworm remained high from August-November, the peak season of cotton crop (when the crop is fully matured) and a large number of fruiting bodies are present in the field. Our results are consistent with other studies of pink bollworm population dynamics ; ; ; .

Table II.- Multivariate regression model between weather factors and population of pink bollworm.

Year

Regression equation

R2

Impact %

2016

Y = 22.4 + 0.68 X1

1.5

1.5

Y= 28 + 0.87 X1 – 0.28 X2

1.5

0

Y = -845 – 20.1 X1* + 24.2 X2* + 7.69 X3*

75.4

73.9

Y= -840 – 20.2 X1* + 24.3 X2* + 7.56 X3* + 1.59 X4

75.6

0.2

Y = -855 -19.8 X1* + 23.1 X2* + 7.58 X3* + 3.75 X4 + 5.0 X5

76.4

0.8

2017

Y = -6.4 + 2.04 X1

18.9

18.9

Y= 42.2 + 3.48 X1* – 2.23 X2

28.3

9.4

Y = -63 + 1.73 X1 - 0.43 X2 + 1.38 X3

32.3

4

Y= -608 – 14 X1 + 16.1 X2 + 5.96 X3* + 76.8 X4

53.7

21.4

Y = -1263 -23.2 X1* + 23.7 X2* + 11.6 X3* + 121 X4* + 28.2 X5*

91.4

37.7

2018

Y = 38.7 + 0.43 X1

0.2

0.2

Y= -10 -1.3 X1 + 2.30 X2

1.3

1.1

Y = -1546.2 - 35.3 X1* + 42.4 X2* + 14.2 X3*

55.3

54

Y= -1308 – 24.3 X1 + 32.4 X2* + 12.8 X3* - 391 X4

65

9.7

Y = -1329 – 31.4 X1* + 40.1 X2* + 13.3 X3* - 377 X4 - 18 X5

69.4

4.4

*, Significant (p < 0.05). X1, minimum temperature (°C); X2, maximum temperature (°C); X3, relative humidity (%); X4, rainfall (mm); X5, sunshine (h).

The results revealed that pheromone trap catches of pink bollworm was positively correlated with temperature and relative humidity while negatively correlated with sunshine. Rainfall showed positive correlation with pink bollworm population during 2016 and 2017 but negative association was observed in 2018. These results are in agreement with the work of Ali et al. (2016) who also reported positive correlation of maximum temperature and rainfall with pink bollworm moth catches. Contrary to our findings, Shinde et al. (2018) reported negative relationship of maximum and minimum temperature and relative humidity with pheromone trap catches. Similarly, Sharma et al. (2015) showed that pink bollworm population was negatively correlated with relative humidity and minimum temperature. These anomalies in results may be due to the difference in climatic condition of localities under which the experiments has been conducted. In the present study, non-significant and negative correlation was observed between rainfall and moth catches during the year 2018.

The multiple regression analysis indicated that weather factors cumulatively have 76.4, 91.4 and 69.4 percent impact on the abundance of pink bollworm in years 2016, 2017 and 2018, respectively. These findings are in agreement with those of Ali et al. (2016) who reported 72.75% impact of all the weather factors cumulatively on the pheromone trap catches. Ramesh and Meghwal (2014) also reported that use of regression model indicated 84% prediction rate of weather factors on the pink bollworm population.

Conclusion

From the present investigation, it can be concluded that population of pink bollworm builds up during April and September-November. Such information would be useful because it would allow to implement control strategies during the time of year the moths are most abundant to maximize control efficacy and minimize yield losses due to this pest.

Supplementary material

There is supplementary material associated with this article. Access the material online at: https://dx.doi.org/10.17582/journal.pjz/20200115100130

Statement of conflict of interest

The authors have declared no conflict of interests.

Figures

Fig. 1.
Fig. 1..

Adult moth catches of pink bollworm in different months during 2016-18.

References

  1. Ahmed, Z., 2013. Model farming saving cotton from Pink bollworm. Available at: https://www.pakissan.com/english/advisory/saving.cotton.from.the.pink.bollworm.shtml (accessed on 04 September, 2020).
  2. Ali, A., Hafeez, F., Farooq, M., Karar, H., Abbas, M. and Babar, T.K., 2016. J. Ent. Zool. Stud., 4: 2-6.
  3. Asif, M.U., Muhammad, R., Akbar, W. and Tofique, M., 2016. Nucleus, 53: 140-146.
  4. Asif, M.U., Muhammad, R., Akbar, W. and Tofique, M., 2017. Pak. J. Agric. agric. Engin. Vet. Sci., 33: 37-45.
  5. Baloch, A.A., Soomroo, B.A., Laghari, M.A. and Sanjrani, M.W., 1990. Turk. Ent. Derg., 14: 131-148.
  6. Boguslawski, C.V. and Basedow, T., 2000. J. appl. Ent., 125: 327-331. https://doi.org/10.1046/j.1439-0418.2001.00545.x[CrossRef]
  7. Cammel, M.E. and Knight, J.D., 1992. Adv. Ecol. Res., 22: 117-162. https://doi.org/10.1016/S0065-2504(08)60135-X[CrossRef]
  8. Drapek, R.J., Croft, B.A. and Fisher, G., 1997. Pan Pacific Entomol., 73: 9-15.
  9. GoP, 2016. Pakistan economic survey 2015–2016. Ministry of Finance, Government of Pakistan, Islamabad, Pakistan.
  10. Hummel, H.E., Gaston, L.K., Shorey, H.H., Kaae, R.S., Bryne, J.K. and Silverstein, R.M., 1973. Science, 181: 873-875. https://doi.org/10.1126/science.181.4102.873[CrossRef]
  11. Hutchison, W.D., Beasley, C.A., Henneberry, T.J. and Martin, J.M., 1988. J. econ. Ent., 81: 673-678. https://doi.org/10.1093/jee/81.2.673[CrossRef]
  12. Iqbal, M.S., Shaikh, F.M., Mahmood, B. and Shafiq, K., 2010. Asian Soc. Sci., 6: 123-140.
  13. Kadam, J.R. and Khaire, V.M., 1995. J. entomol. Res., 19: 201-205.
  14. Khuhro, S.N., Ahmad, F., Kalroo, A.M., Abdullah, K. and Talpur, M.A., 2015. Int. J. Interdiscip. Res. Sci. Soc. Culture, 1: 51-60.
  15. Maelzer, D.A. and Zalucki, M.P., 2000. Bull. entomol. Res., 90: 133-146. https://doi.org/10.1017/S0007485300000249[CrossRef]
  16. Ozyigit, I.I., Kahraman, M.V. and Ercan, O., 2007. Afr. J. Biotechnol., 6: 3-8.
  17. Ramesh, B.S. and Meghwal, M.L., 2014. The Bioscan, 9: 629-632.
  18. Rehman, A., Jingdong, L., Chandio, A.A., Hussain, I., Wagan, S.A. and Memon, Q.U.A., 2019. J. Saudi Soc. agric. Sci., 18: 49-54. https://doi.org/10.1016/j.jssas.2016.12.005[CrossRef]
  19. Schmutterer, H., 1990. Annu. Rev. Ent., 35: 271-297.
  20. Shinde, P.R., Hole, U.B. and Patil, P.V., 2018. J. Ent. Zool. Stud., 6: 1998-2000.
  21. USDA, 2016. Cotton outlook. Agricultural outlook forum 2016. United States Department of Agriculture. Available at: https://www.usda.gov/sites/default/files/documents/Cotton_Outlook_2016.pdf (accessed on 04 September, 2020).

Supplementary material

Cited by 1 article

In journals published by ResearchersLinks.

  1. Management of Pink Bollworm (Pectinophora gossypiella) Through Mating Disruption: An Environment Friendly TechniquePakistan Journal of Zoology · 2026

Services

Article usage statistics

Loading…