
Transforming Growth Factor-α is a mitogen peptide performing diverse cellular functions and is immunolocalized in ductal epithelium of salivary glands. The development of salivary glands is under the influence of various hormones including Triiodothyronine hormone (T3). Submandibular gland of rat is an excellent model to study salivary gland organogenesis. The study is designed to understand T3-mediated regulation of TGF-α expression during postnatal salivary gland development as it is currently unknown.Twelve male rats were taken at week three and twelve at week seven and divided into control and experimental groups. Control rats were given normal saline while experimental rats were given T3 at a dose of 1mg/kg body weight. All the animals were sacrificed on 15th day. Weight of each rat was calculated at the time of T3 administration. Body weight of experimental animals increased at a slow rate as compared to the control animals. The immunohistochemical expression of TGF-α in ductal epithelium of both salivary glands was decreased in experimental group sacrificed at 5 weeks. However no significant change was observed in TGF-α expression in ductal epithelium of salivary glands in rats sacrificed at 9 weeks.T3 has a temporal effect on TGF-α expression during early postnatal rat salivary gland development.
Research Article · Volume 51, Issue 2, 29 January 2019 · Open Access
Regulation of Transforming Growth Factor-Alpha Expression by Thyroid Hormone during the Post-Natal Development of Rat Submandibular and Sublingual Salivary Glands
· ·
Affiliations & Notes ⌄
- 1Department of Oral Biology, University of Health Sciences, Lahore 2Department of Morbid Anatomy and Histopathology, University of Health Sciences, Lahore , * Corresponding author: sarahghafoor@uhs.edu.pk
Article Info ⌄
- Journal:
- Pakistan Journal of Zoology
- Published:
- 29 January 2019

From the article
- In order to study the physiological role of thyroid hormone on TGF-α expression, we injected T3 hormone at a time dependent manner in male Wistar rats.
- The results of the present study suggest that the administration of T3 may increase BMR resulting into less gain in body weight of experimental rats.
- As TGF-α is functional while growth is at a rapid rate so this study also proposes that TGF-α regulates the early postnatal development of salivary glands.
- T3 does not affect the expression of TGF-α once the growth has almost completed.
Selected from the article's own text.
Abstract
Introduction
Transforming growth factor alpha (TGF-α) is a mitogen polypeptide that is structurally and functionally similar to another mitogen; the Epidermal Growth Factor (EFG) . Both are members of EGF family and compete for binding to same integral membrane glycoprotein EGF receptor (EGF-R) for diverse cellular activity such as cell proliferation, stimulation of DNA synthesis, cell growth and differentiation .
TGF-α of rat and mice is found to have an amino acid sequence similar to that of the human TGF-α . Although initially discovered in neoplastic tissues, it has been shown that TGF-α plays important biological functions similar to its normal counterpart EGF suggesting that it plays important roles in normal growth and differentiation. Increased amount of EGF and TGF-α induce precocious eye opening and accelerates tooth eruption in new-born mice .
TGF-α expression is found in embryonic tissues as early as in unfertilized egg and also in all cells of the blastocyst . During later embryonic development, it is expressed in several tissues and organs such as 1st and 2nd branchial arches, 1st pharyngeal pouch, otic vesicles and kidneys , duodenum, liver, adrenal and salivary glands , neonatal and adult human keratinocytes cells and in the brain cells . TGF-α expression is also present during early stages of craniofacial development in rats in neural folds, olfactory bulb, the nasal capsule, vomeronasal organ and vibrissal follicle. TGF-α expression is also found in the developing primary palate. The expression is also found in the mesenchyme around the Meckel’s cartilage and in stellate reticulum, outer and inner enamel epithelium and in the dental lamina . TGF-α is expressed in ductal epithelium of SMG, striated ducts in parotid gland and in SLG .
In humans and rodents, three pairs of major salivary glands including parotid, submandibular and sublingual and many minor salivary glands secrete saliva in the oral cavity . The development and structure of rats and human submandibular (SMG) and sublingual (SLG) salivary gland is much similar except that granular convoluted tubules (present distal to striated ducts) are present in rats and are absent in humans . The rat SMG consists of a connective tissue capsule and a parenchyma consisting of secretory units (acini) and ducts. The acini are the predominant structures that make up the serous or mucous cells ; .
Rat SMG is not fully developed at birth and lack these secretory structures and consist of immature transitory secretory units and ducts whose definitive development occurs postnatally . The postnatal development of rat SMG is completed between 7-10 weeks of age . The postnatal development of salivary glands is also influenced by combined actions of androgens, thyroid hormones and adrenocortical steroid hormones . Thyroid hormone plays important roles in normal growth and development, neural differentiation, inflammation, proliferation and metabolic regulation in mammals .
Previous reports have shown the exogenous Triiodothyronine hormone (T3) administration increases EGF levels and expression in postnatal mouse SMG and SLG development , however, no data exist regarding the expression of TGF-α after T3 administration during postnatal rat SMG and SLG development. Thus substantial gap in knowledge exist regarding how the expression of TGF-α, which is working in similar manner to EGF and shares the same receptor for its functional activity, may be affected by thyroid hormone in the postnatal SMG and SLG gland development.
Materials and Methods
Preparation of animals
The study was approved by the ethical committee of the University of Health Sciences, Lahore and all the experiments were conducted according to the guidelines approved by the ethical review committee of the University of Health Sciences, Lahore. Twenty four healthy male Wistar rats (Rattus norvegicus) aged 3 week and 7 week (6 rats/ group) were obtained from the colony maintained at the Experimental Research Laboratory at the University of Health Sciences, Lahore. The pups were reared from birth and were weaned at day 21 of age. Upon reaching the desired age, the rats weighing around 48-54 gm (3 weeks old) and 195-228 grams (7 weeks old) were used in this study. The rats were housed in a temperature controlled room (23± 2°C) and humidity (50±5%) was maintained. In order to maintain a stable biological rhythm, constant light and dark cycles having 12-h light and 12-h darkness were applied. The animals received standard rat diet and water ad libitum and were allowed to acclimatize for 1 week before starting the experiment.
Administration of T3
The rats were divided into four groups, control and experimental at week 3 (A1 and B1) and week 7 (A2 and B2). The weight of the animals was recorded at the start of the experiment and then regularly at each alternate day. The rats in the control group were given normal saline injections while those in the experimental group were given 3, 3, 5- triiodo-L-thyronine (T3) (Sigma T2877) subcutaneously on alternate days for 14 days. Previously published dose of T3 for mice was 1mg/kg body weight . For mice it was found out to be 0.5mg/kg body weight .The animals of group A1 and B1 were sacrificed at week 5 and those of group A2 and B2 at week 9.
Animal sacrifice and fixation of samples
The animals of both control and experimental group A1 and B1 were sacrificed at week 5 and those in control and experimental group A2 and B2 were scarified at week 9. The SMG and SLG were carefully dissected out and residual connective tissue was removed. The glands were washed with PBS and weighed before gross examination. The samples were then fixed with neutral buffered formal saline at 4°C overnight before processing for immunohistochemistry.
Immunohistochemistry
Tissue section of SMG and SLG at week 5 and week 9 of control and experimental groups were taken on poly-L-lysine coated slides, de-paraffinized in xylene and then rehydrated by graded series of ethanol (100%-50%) before being washed by distilled water. Antigen retrieval was done by treating the sections in 10mM sodium citrate buffer (pH 6) and 0.05% Tween-20 solution in a water bath at 95оC for 45 min. The slides were allowed to cool at room temperature and rinsed with PBS. Blocking of endogenous peroxidases was done using 3% H2O2 for 10 min and sections were washed with PBS. The samples were incubated for 1 h at room temperature with primary antibody, Anti-TGF alpha (Abcam, ab16768). The sections were washed with PBS and then incubated with 1-3 drops of Biotinylated secondary antibody for 15 min at room temperature and washed with PBS. The sections were incubated with Streptavidin peroxidase for 10 min. Further the sections were incubated with 1-2 drops of DAB chromogen solution for 5-10 min and washed with distilled water. Counterstaining was done using Hematoxylin solution for 5-10 seconds for visualization (Bankroft and Gamble, 2008). Counter stained sections were dehydrated in ethanol, cleared in xylene and air-dried and cover-slipped for observation under the Olympus microscope (BX51TF) with camera Infinity-1 under 10X and 40x magnification power.
Quantification of immunoreactivity of TGF-α
The ductal epithelial cells of both SMG and SLG were considered immunopositive with anti- TGF-α antibody when a strong staining was demonstrated. Grading for intensity of the immunohistochemical reaction was carried out by using the following scale. 4+ (highly positive), 3+ (positive), 2+ (weakly positive), l+ (minimally positive) and - (undetectable reaction) . Skin tissue was taken as a positive control according to the recommended protocols by the manufacturer while acinar cells showing absence of immune reaction was taken as a negative control .
Statistical analysis
The data was analyzed and interpreted using Statistical Package for Social Sciences, Version 20 (SPSS-20). Mean ± SD and t-test was applied for comparisons of weight of animals. Fisher’s exact test showed the association between intensity of immunohistochemical reaction of TGF-α. p-value ≤ 0.05 was considered as statistically significant.
Table I.- Paired sample test showing the comparison of mean of initial and final body weight of group A1, B1 and group A2, B2.
| Group | Initial body wt (g) | Final body wt (g) | ||
| Week 3 | Week 7 | Week 5 | Week 9 | |
| A1 (Control) | 50.33±3.33 | 117.0±3.09* | ||
| B1 (Experimental) | 50.5±2.81 | 103.33±4.13* | ||
| A1 (Control) | 211.5±14.22 | 275.16±16.88 | ||
| B1 (Experimental) | 202.5±7.89 | 218.0±11.86 | ||
Values are Mean±SD. *, The mean final body weight of both the control and experimental groups A1 and B1 was found to be more than the mean initial weight. The difference in mean of initial and final weight of both the groups was found to be statistically significant. p-value of ≤0.05 was taken as significant and its value was found to be <0.01. **, The mean final body weight of control group A2 and experimental group B2 was found to be more than the mean initial weight. The difference in mean of initial and final weight of both the groups was found to be statistically significant showing that rats of both groups gained weight. p-value of ≤0.05 was taken as significant and was found to be <0.01.
Results
Gain in body weight of rats
The rats of both the control and experimental groups showed an increase in weight with the progression of age, however a significant difference occurred with an increase in weight of the control as compared to the experimental groups (Table I). Also a slower gain in weight was observed in the experimental groups (B1, B2) as compared to the controls groups (A1, A2) during the post-natal development. In addition to this, when the mean of gain in weight was compared between both the experimental groups, it was found that the animals of experimental group B1 (5 weeks) gained more weight as compared to that of group B2 (week 9) (Table II).
TGF-α expression at Week 5 in SMG and SLG
SMG
SLG
TGF-α expression at Week 9 in SMG and SLG
Contrary to the results shown week 5, no significant difference was found in the expression of TGF-α in the ductal epithelium of both SMG and SLG of experimental group (B2) as compared to control group (A2) at week 9 (Figs. 3A-D, 4A-D). The frequencies and percentages of animals with TGF-α intensity score are given in Table III.
Table II.- Independent sample test showing the comparison of mean difference of gain in body weight between group A1 and B1 and between group A1 and B2.
| Groups | Mean difference ±SD (weight) | Std. Error | Level of significance (p-Value) |
| Control (A1) | 66.66±5.278 | 2.155 | 0.001* |
| Experimental (B1) | 52.833±4.622** | 1.887 | |
| Control (A2) | 63.666±10.171 | 4.152 | <0.01* |
| Experimental (B2) | 15.500±11.484** | 4.688 |
*, The mean difference of initial and final body weight of both control groups A1 and A2 was found to be more than that of both experimental groups B1 and B2 respectively. Independent samples t-test showed that there was a statistically significant difference in gain of body weight between rats of control groups (A1 and A2) and experimental groups (B1 and B2). p-value was found to be 0.001. **, While comparing the mean difference of gain in body weight between both the experimental groups B1 (week 5) and B2 (week 9), it was found that the rats of group B1 (mean ±SD=52.833±4.622) gained more weight as compared to the rats of group B2 (mean ±SD=15.500±11.484).
Table III.- Frequency and Percentage of TGF- α intensity score of SMG and SLG of control and Experimental groups at week 5 and week 9.
| Gland | TGF-α score | Control group A1 n (%) | Experimental group B1 n (%) | p-value* | Control group A2 n (%) | Experimental group B2 n (%) | p-value** |
| SMG | MP (1+) | 0 (0%) | 1(17%) | 0.05 | - | - | 1.00 |
| WP (2+) | 0 (0%) | 3 (50%) | 0 (0%) | 1(17%) | |||
| P (3+) | 2 (33%) | 2 (33%) | 3 (50%) | 3 (50%) | |||
| HP (4+) | 4 (67%) | 0 (0%) | 3 (50%) | 2 (33%) | |||
| SLG | U (-) | 0 (0%) | 1 (17%) | 0.05 | 3 (50%) | 4 (67%) | 1.00 |
| MP (1+) | 0 (0%) | 3 (50%) | 2 (33%) | 2 (33%) | |||
| WP (2+) | 2 (33%) | 2 (33%) | 1 (17%) | 0 (0%) | |||
| P (3+) | 4 (67%) | 0 (0%) | - | - |
*The expression of TGF-α in ductal epithelium of SMG and SLG of experimental group B1 was found to be less as compared to that of control group A1 at week 5. Fisher’s exact test showed a statistically significant association between the TGF-α intensity scores of SMG & SLG between control and experimental groups. **The expression of TGF- α in ductal epithelium of SMG and SLG of experimental group B2 was found to be similar to that of control group A2 at week 9. Fisher’s exact test showed a statistically non-significant association between the TGF-α intensity scores of SMG and SLG between control and experimental groups. U (-) stands for undetectable, MP (1+) for minimally positive, WP (2+) for weakly positive, P (3+) for positive and HP (4+) for highly positive. Group A1 and B1 are control and experimental at week-5 while group A2 and B2 are control and experimental at week-9, “n” represents the number of animals in each group. SMG is Submandibular Salivary gland and SLG is Sublingual Salivary Gland. p-value of less than or equal to 0.05 is taken as significant.
Discussion
In order to study the physiological role of thyroid hormone on TGF-α expression, we injected T3 hormone at a time dependent manner in male Wistar rats. T3 has previously shown to increase the EGF expression in the mouse SMG . The presence and distribution of TGF-α in major salivary glands of rats and humans have been studied before ; ; but how TGF-α expression in the postnatal SMG and SLG may be regulated by T3 is not documented in the literature.
Gain in body weight of rats
A normal increase in the body weight of rats of both the control and experimental groups was observed during study as all animals were in the growing phase. This is also reported in another study that showed increase in weight of the growing rats . However, an overall difference in the rate of gain of body weight was found between the control and experimental animals of both groups. The animals treated with the thyroid hormone (T3) gained weight slowly as compared to the non-treated groups. As the thyroid hormone causes an increase in basal metabolism of the body , thus exogenous administration of T3 may be responsible for slow gain in weight of experimental group. This finding is similar to another study done on parotid gland that also showed progressively slow weight gain in between treated and untreated groups .
When the mean difference of gain in body weight was compared between both the experimental groups (B1 and B2), it was noted that rate of gain in weight of experimental group (B1) sacrificed at week 5 was more than experimental group (B2) sacrificed at week 9 (group B2). This may be due to the reason that the rats in group B1 were younger as compared to those of group B2 and in a growing phase. Hence we speculate that T3 may have a temporal effect on gain in body weight and basal metabolic rate (BMR) of growing rats is not affected to that extent as that of rats of group B2.
TGF-α expression at week 5 in SMG and SLG
According to the current study, when thyroid hormone was administered to the rats of the experimental group (B1) sacrificed at the age of 5 weeks, a significant decrease in TGF-α expression in SMG and SLG of experimental group was found. It is already known that the expression of TGF-α is variable at different stages of life . It is a peptide which is essential during active phases of life. As the development of rodent salivary glands is not completed prenatally, to function as a mature gland, salivary glands complete their development postnatally and during this period alterations in the hormones such as thyroid also influence the completion of salivary gland development . As the rats at this age are in a phase of growth, so this may be the underlying cause that its expression is affected by exogenous administration of T3. No previous study has described the relationship of TGF-α and thyroid hormone in salivary glands. However, a study done on kidneys of rats showed decrease in expression of TGF-α after administration of thyroid hormone similar to our study .
TGF-α expression at Week 9 in SMG and SLG
Contrary to decrease in TGF-α expression in rats sacrificed at age of 5 weeks, the SMGs and SLGs of rats of experimental group sacrificed at the age of 9 weeks showed no significant difference in the expression of TGF-α after T3 administration when compared with the control group (A2). At this age, both the glands have fully developed as previously reported by Jacoby and Leeson (1959) and Wu et al. (1993) in their study on rats. Thus we speculate that the administration of T3 at this stage may not have induced any changes in TGF-α expression.
In addition to this, previous studies have shown that after T3 administration an increase in the expression of EGF in salivary glands occurs (Fujeida et al., 1992; . EGF is a family member of TGF-α. Both of them are found to have structural and functional similarity . It has also been reported in a previous study that TGF-α functions during early neonatal growth while EGF functions in neonatal and adult life taking over the role of TGF-α . Therefore, these factors may be the underlying cause of no change in expression of TGF-α by administration of T3.
Conclusions
The results of the present study suggest that the administration of T3 may increase BMR resulting into less gain in body weight of experimental rats. As TGF-α is functional while growth is at a rapid rate so this study also proposes that TGF-α regulates the early postnatal development of salivary glands. However, T3 has been found to have an inverse relationship with TGF-α in both the glands. T3 does not affect the expression of TGF-α once the growth has almost completed.
Future Prospective
Further studies need to explore the continuous week-wise postnatal expression of TGF-α in both salivary glands. Also it is still unknown how T3 administration can affect prenatal development of both glands. In this study, the effect of T3 was determined in postnatal submandibular and sublingual salivary glands. This can also be investigated in regards to parotid gland development.
Acknowledgments
We would like to thank University of Health Sciences, Lahore for funding this project, providing the animal house at the university. We would like also like to thank the animal care staff, Librarian (UHS) and statistician for guidance through technical aspects. We also thank the Higher Education Commission of Pakistan (HEC) for their access of e-Library to the university.
Statement of conflict of interest
The authors declare no conflict of interest.
Figures
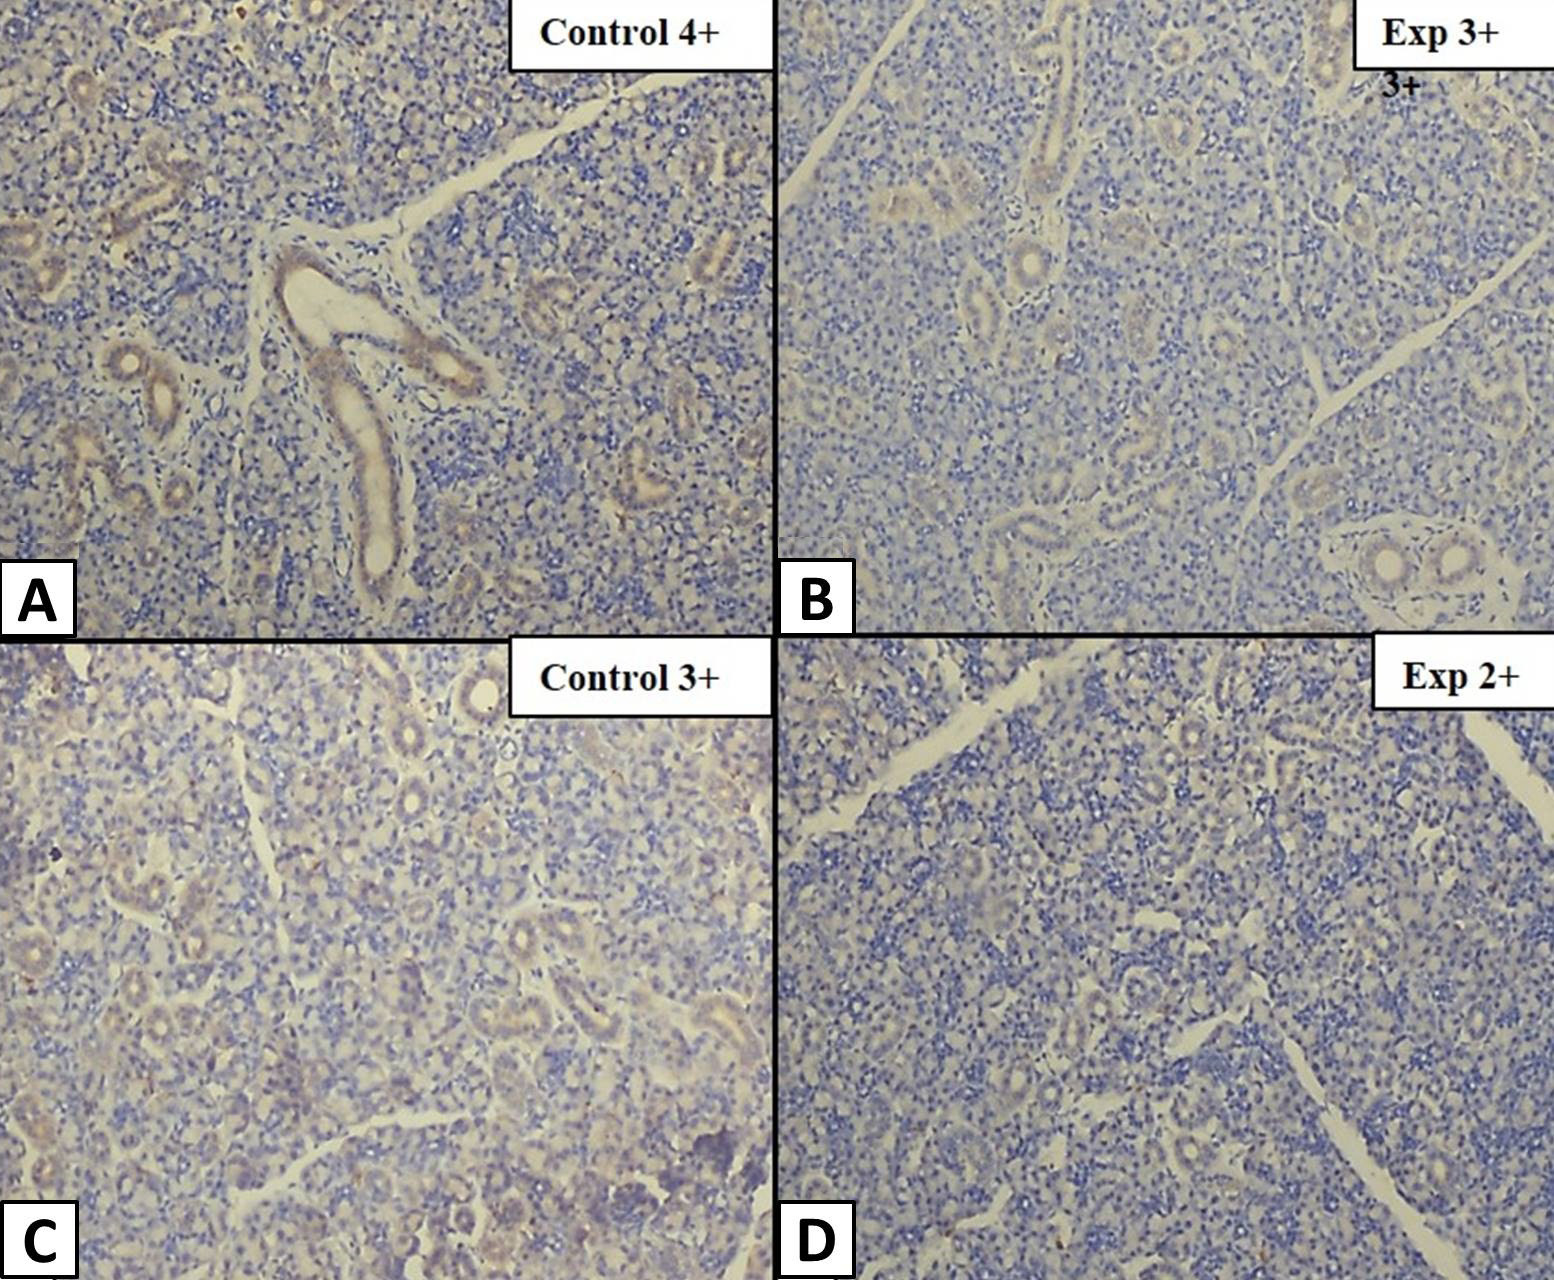
TGF-α expression in SMG of group A1 and B1 at week 5. Longitudinal section of ductal epithelium of SMG under 10x magnification showing A, Control group (A1) with TGF-α intensity score of highly positive (4+). B, Experimental group (B1) with TGF-α intensity score of positive (3+). C, Control group (A1) with TGF-α intensity score of positive (3+). D, Experimental group (B1) with TGF-α intensity score of weakly positive (2+).
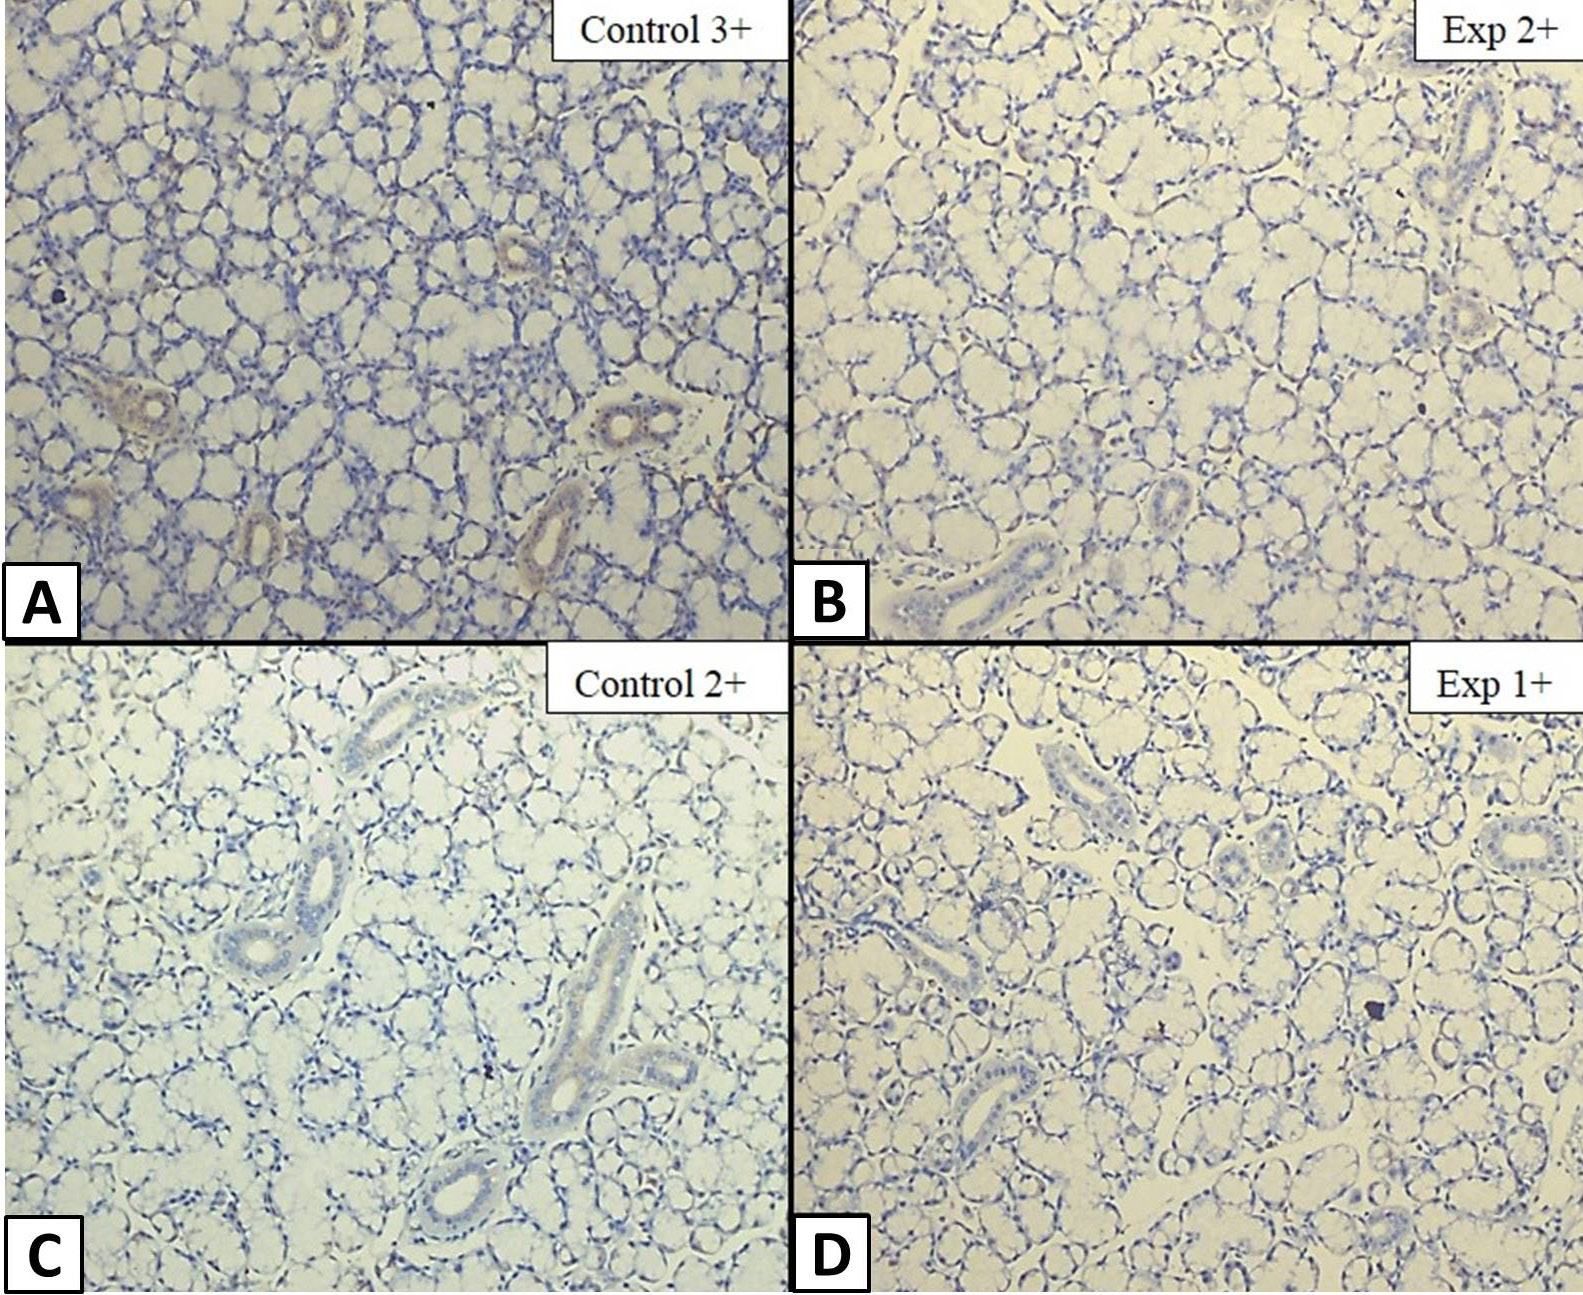
TGF-α expression in SLG of group A1 and B1 at week 5. Longitudinal section of ductal epithelium of SLG under 10x magnification showing A, Control group (A1) with TGF-α intensity score of positive (3+). B, Experimental group (B1) with TGF-α intensity score of weakly positive (2+). C, Control group (A1) with TGF-α intensity score of weakly positive (2+). D, Experimental group (B1) with TGF-α intensity score of minimally positive (1+).
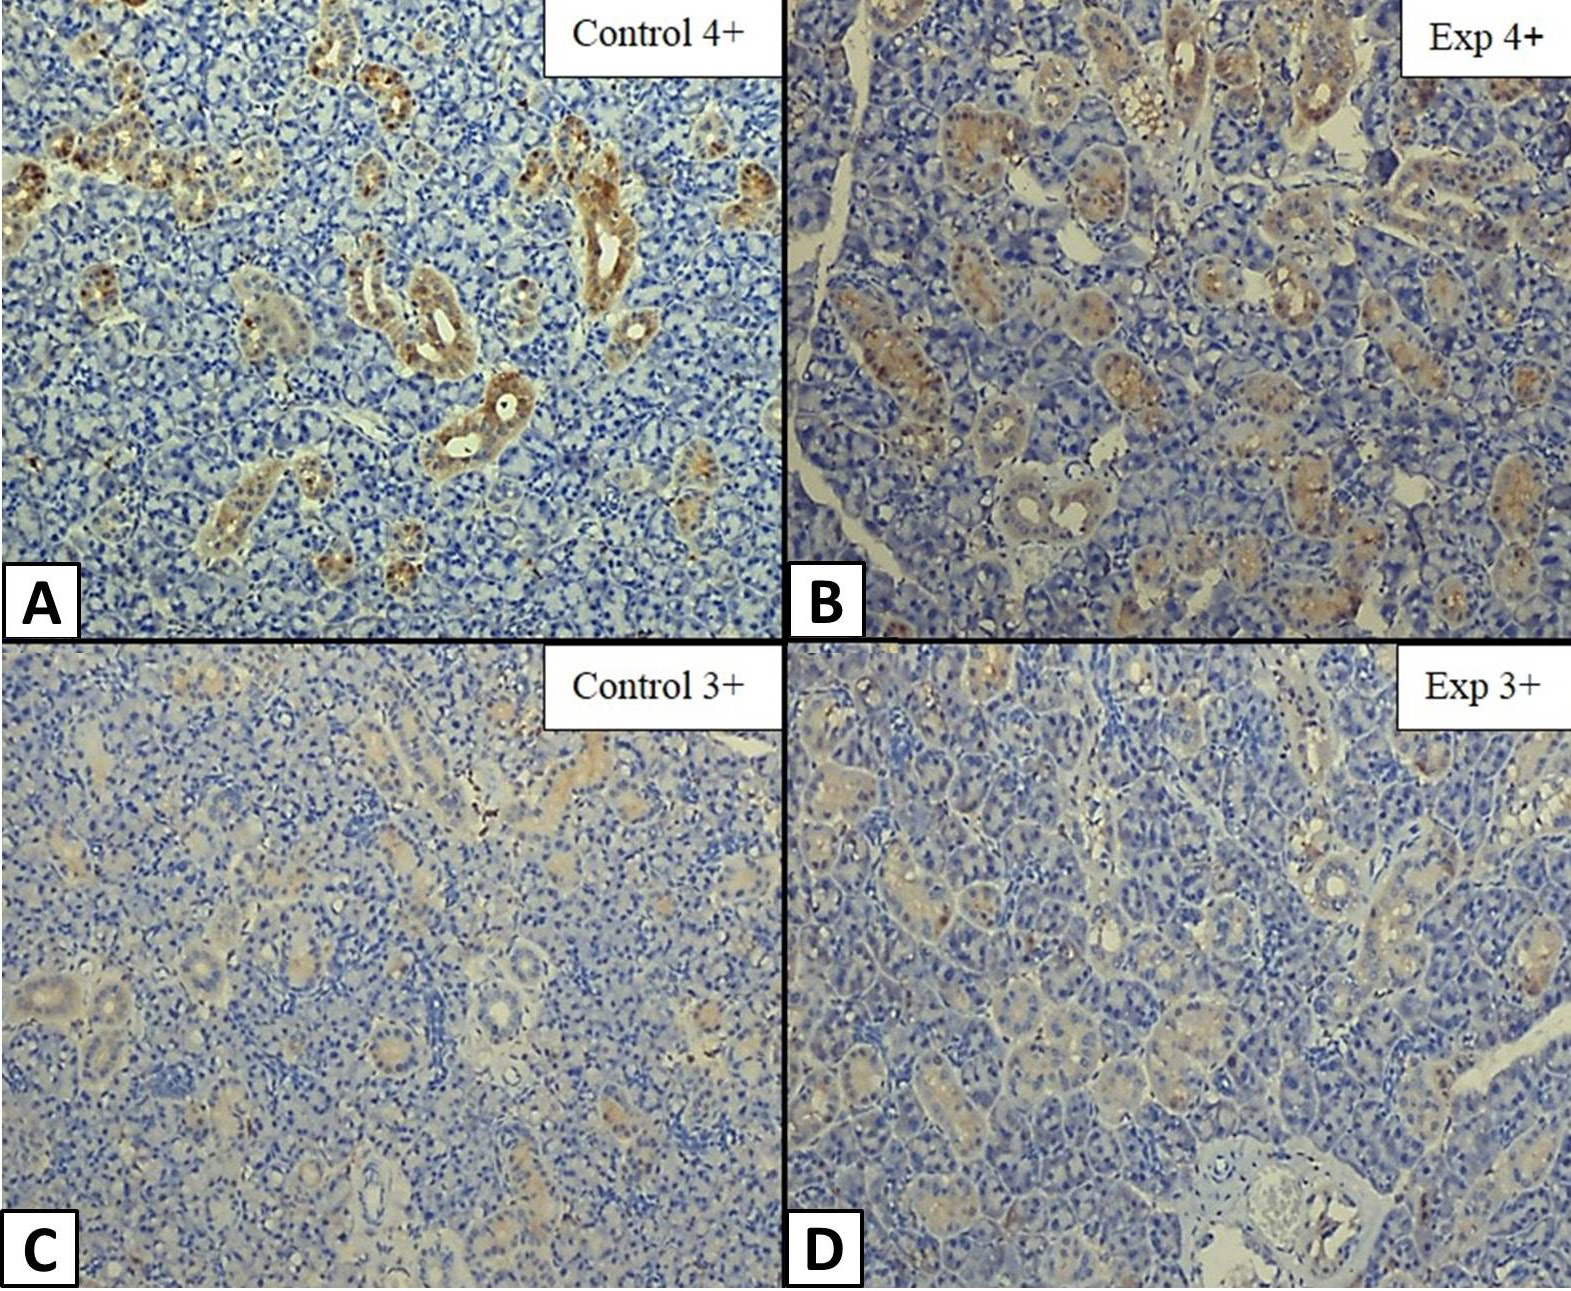
TGF-α expression in SMG of group A2 and B2 at week 9. Longitudinal section of ductal epithelium of SMG under 10x magnification showing A, Control group (A2) with TGF-α intensity score of highly positive (4+). B, Experimental group (B2) showing highly positive (4+) TGF-α intensity score. C, Control group (A2) showing TGF-α intensity score of positive (3+). D, Experimental group (B2) with TGF-α intensity score of positive (3+).
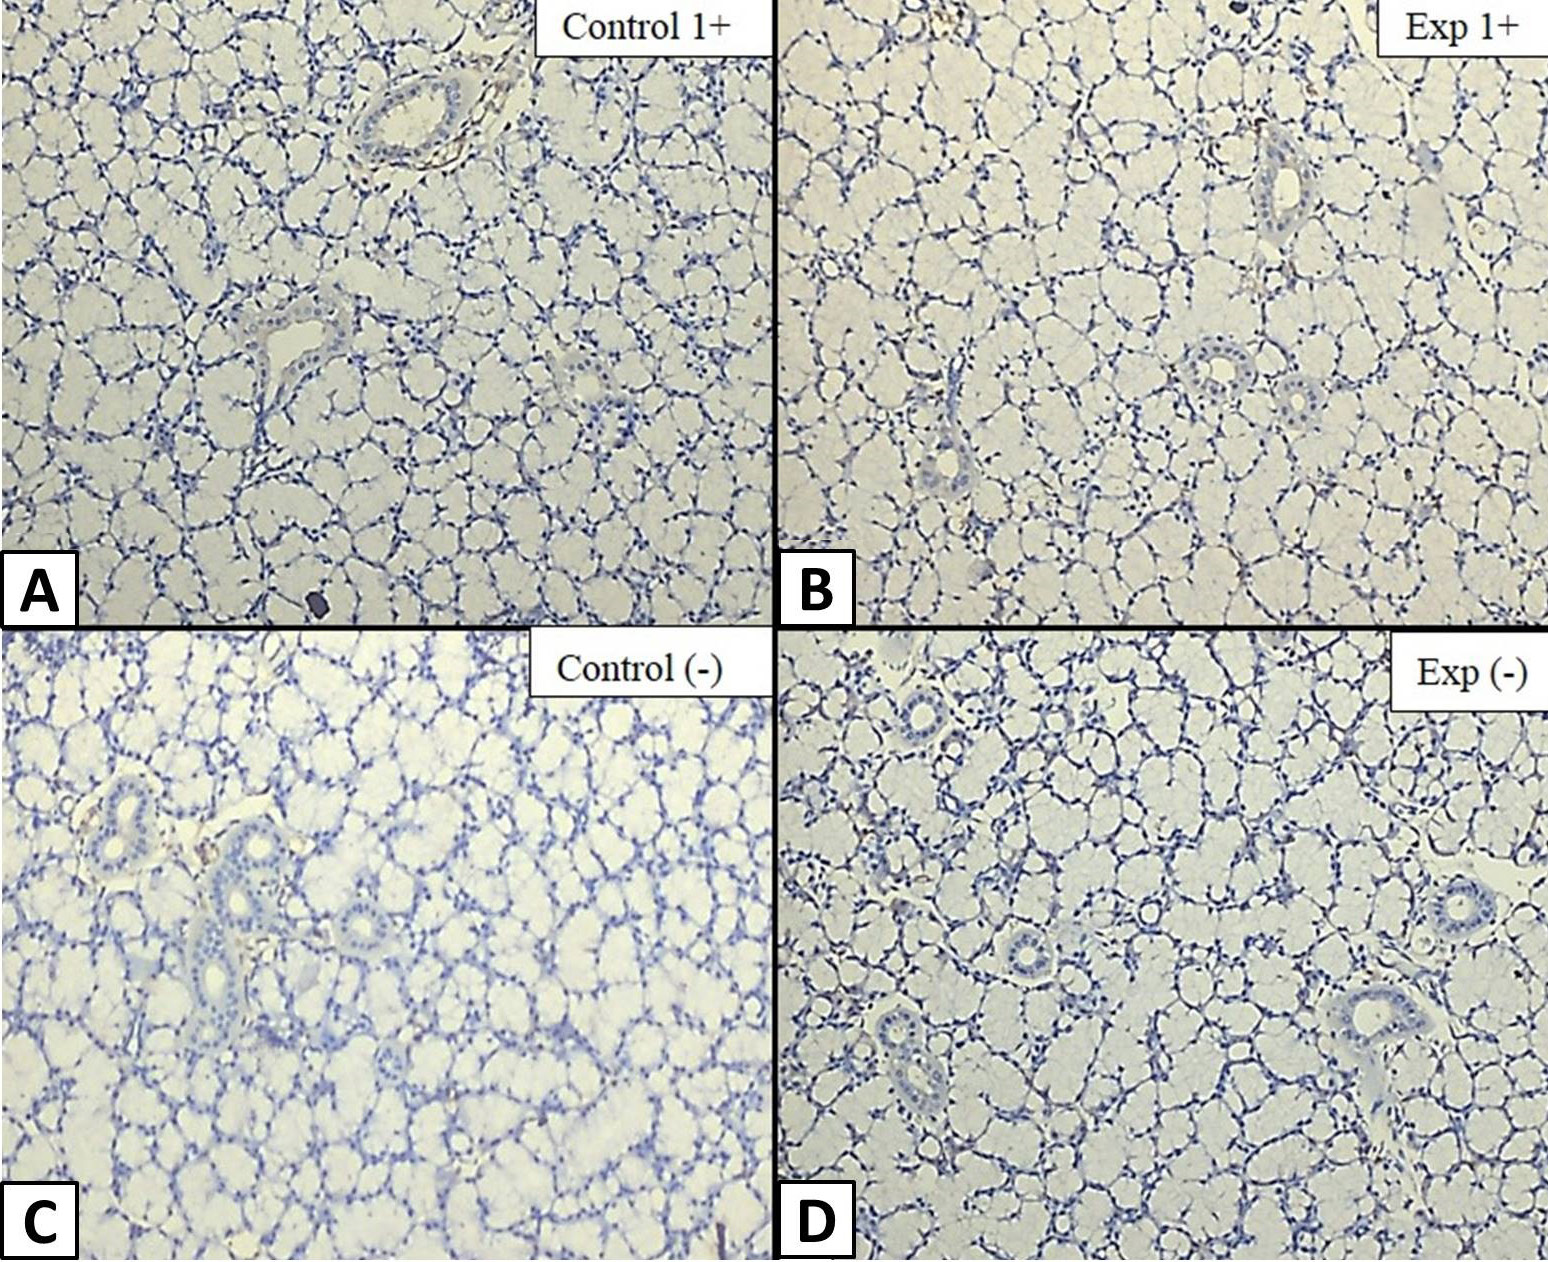
TGF-α expression in SLG of group A2 and B2 at week 9. Longitudinal section of ductal epithelium of SLG under 10x magnification showing A. Control group (A2) showing TGF-α intensity score of minimally positive (1+). B, Experimental group (B2) with TGF-α intensity score of minimally positive (1+). C, Control group (A2) showing an undetectable intensity score (-). D, Experimental group (B2) also showing an undetectable intensity score (-).
References
- Bancroft, J.D. and Gamble, M., 2008. Bancroft’s theory and practice of histological techniques. Elsevier Health Sciences, pp. 674.
- Browne, C.A., 1991. Epidermal growth factor and transforming growth factor α. Best Pract. Res. Clin. Endocrinol. Metab., 5: 553-569.
- Coire, F.A.S., Umemura, A.L.O., Cestari, T.M. and Taga, R., 2003. Increase in the cell volume of the rat submandibular gland during postnatal development. Braz. J. morphol. Sci., 20: 37-42.
- Chen, C.Y., Chen, C.P. and Lin, K.H., 2015. Biological functions of thyroid hormone in placenta. Int. J. mol. Sci., 16: 4161-4179. https://doi.org/10.3390/ijms16024161[CrossRef]
- Derynck, R., Goeddel, D.V., Ullrich, A., Gutterman, J.U., Williams, R.D., Bringman, T.S. and Berger, W.H., 1987. Synthesis of messenger RNAs for transforming growth factors α and β and the epidermal growth factor receptor by human tumors. Cancer Res., 47: 707-712.
- Fujieda, M., Murata, Y., Hayashi, H., Kambe, F., Matsui, N. and Seo, H., 1993. Effect of thyroid hormone on epidermal growth factor gene expression in mouse submandibular gland. Endocrinology, 132: 121-125. https://doi.org/10.1210/endo.132.1.8419117[CrossRef]
- Fukuda, M., 1967. Histochemical studies on the rat submaxillary gland during post-natal development. Histochemie, 8: 342-354. https://doi.org/10.1007/BF00401977[CrossRef]
- Gresik, E.W., 1980. Postnatal developmental changes in submandibular glands of rats and mice. J. Histochem. Cytochem., 28: 860-870. https://doi.org/10.1177/28.8.6160181[CrossRef]
- Huang, L., Solursh, M. and Sandra, A., 1996. The role of transforming growth factor alpha in rat craniofacial development and chondrogenesis. J. Anat., 189: 73-86.
- Ikeda, R., Aiyama, S. and Redman, R.S., 2008. Effects of exogenous thyroid hormone on the postnatal morphogenesis of the rat parotid gland. Anat. Rec., 291: 94-104. https://doi.org/10.1002/ar.20620[CrossRef]
- Ikeda, R., Aiyama, S. and Redman, R.S., 2010. Exogenous thyroid hormone affects myoepithelium and proliferation in the developing rat parotid gland. Biotech. Histochem., 84: 267-274. https://doi.org/10.3109/10520290902984258[CrossRef]
- Jacoby, F. and Leeson, C., 1959. The post-natal development of the rat submaxillary gland. J. Anat., 93: 201-219.
- Miettinen, J.P., 1993. Transforming growth factor-α and epidermal growth factor expression in human fetal gastrointestinal tract. Pediat. Res., 33: 481-486. https://doi.org/10.1203/00006450-199305000-00012[CrossRef]
- Mogi, M., Matsuura, S., Suzuki, K., Inagaki, H., Minami, M., Kojima, K. and Harada, M., 1995. Differential expression of transforming growth factor-α and epidermal growth factor during postnatal development of rat submandibular gland. Biochem. Biophys. Res. Commun., 217: 271-277. https://doi.org/10.1006/bbrc.1995.2774[CrossRef]
- North, D., Lakshmanan, J., Reviczky, A., Kaser, M. and Fisher, D.A., 1992. Ontogeny of epidermal growth factor, transforming growth factor-, epidermal growth factor receptor, thyroid hormone receptor RNA levels in rat kidney and changes in those levels induced by early thyroxine treatment. Pediat. Res., 31: 330-334. https://doi.org/10.1203/00006450-199204000-00005[CrossRef]
- Ogbureke, K., Macdaiel, R., Jacob, R. and Durban, E., 1995. Distribution of immunoreactive transforming growth factor-alpha in non-neoplastic human salivary glands. Histol. Histopathol., 10: 691-696.
- Rappolee, D.A., Brenner, C.A., Schultz, R., Mark, D. and Werb, Z., 1988. Developmental expression of PDGF, TGF-a, and TGF-j genes in preimplantation mouse embryos. Science, 241: 1823-1825. https://doi.org/10.1126/science.3175624[CrossRef]
- Reagen-Shaw, S., Nihal, M. and Ahmad, N., 2008. Dose translation from animal to human studies revisited. FASEB J., 22: 659-661. https://doi.org/10.1096/fj.07-9574LSF[CrossRef]
- Tam, J.P., 1985. Physiological effects of transforming growth factor in the newborn mouse. Science, 229: 673-675. https://doi.org/10.1126/science.3860952[CrossRef]
- Tucker, A.S. and Miletich, I., 2010. Salivary glands. Development, adaptation and disease. Front Oral. Biol., 14: 1-20. https://doi.org/10.1159/isbn.978-3-8055-9407-3[CrossRef]
- Tucker, A.S., 2007. Salivary gland development. Semin. Cell Develop. Biol., 18: 237-244. https://doi.org/10.1016/j.semcdb.2007.01.006[CrossRef]
- Wilcox, J.N. and Derynck, R., 1988. Developmental expression of transforming growth factors alpha and beta in mouse fetus. Mol. cell. Biol., 8: 3415-3422. https://doi.org/10.1128/MCB.8.8.3415[CrossRef]
- Wu, H.H., Kawamata, H., Wang, D.D. and Oyasu, R., 1993. Immunohistochemical localization of transforming growth factor α in the major salivary glands of male and female rats. Histochem. J., 25: 613-618. https://doi.org/10.1007/BF00157875[CrossRef]
- Yoshida, K., Aiyama, S., Uchida, M. and Kurabuchi, S., 2005. Role of thyroid hormone in the initiation of EGF (epidermal growth factor) expression in the sublingual gland of the postnatal mouse. Anat. Rec. Part A: Dis. Mol. Cell. Evol. Biol., 284: 585-593. https://doi.org/10.1002/ar.a.20197[CrossRef]
Cited by 1 article
In journals published by ResearchersLinks.
Services
Article usage statistics
Loading…