
The present study aimed to assess the association of various demographic and dietary factors with the nutritional status of Pakistani celiac patients. For this purpose 50 diagnosed celiac patients were selected from Shaikh Zayed Medical Complex and Mayo Hospital, Lahore. Nutritional assessment was carried out through anthropometric, biochemical and dietary evaluation of the participants. Results indicated that participants aged less than 18 years and those diagnosed within first year of life, had significantly healthier body dimensions. Higher family income, female gender and greater meal satisfaction was found to be associated with better biochemical indices. Most participants reported partial compliance to GFD. Compliant participants reported an increased consumption of junk food whereas, non-compliant patients, consumed significantly higher intakes of meat and fat. Regular intake of carbonated beverages, packaged juices and tea by the participants was associated with poor anthropometric measurements. Contrary to the study hypothesis, increased compliance to GFD and other demographic and dietary factors were not found to be associated with improved nutritional status of the study participants. Results of the present study clearly indicated that the nutritional status of celiac patients could not be predicted exclusively on the factors identified for the normal population. These findings call for an integrated interventional approach for the dietary management of celiac patients. Focusing on detailed nutrition education along with ensuring the availability of healthy and affordable gluten free choices, instead of merely emphasizing on compliance to gluten free diet, may ensure good nutritional status of Pakistani celiac patients.
Research Article · Volume 50, Issue 2, 12 March 2018 · Open Access
Nutritional Assessment of Celiac Patients of Pakistan
·
Affiliations & Notes ⌄
- 1Government College of Home Economics, Lahore 2University of Management and Technology, Lahore , * Corresponding author: samra.imran74@gmail.com
Article Info ⌄
- Journal:
- Pakistan Journal of Zoology
- Published:
- 12 March 2018

From the article
- Nutritional status of the study participants was found to be significantly associated with age.
- More junk food is consumed by patients with better compliance, conversely less compliant patients have higher intake of meat and fat.
- Regular intake of carbonated beverages, packaged juices and tea is associated with poor nutritional outcome.
- There is no significant difference in the nutritional status of highly compliant and non-compliant patients.
Selected from the article's own text.
Abstract
Introduction
It is well established that celiac disease could result in both overt and latent malnutrition. Disease in already malnourished individuals results in poor prognosis . It is speculated that a large number of celiac children might be dying in Africa and Asia due to lack of understanding about celiac disease and Gluten Free Diet (GFD) . Majority of celiac children in Pakistan are suffering from chronic malnutrition. They are stunted, underweight and anemic. Their serum albumin, protein and calcium levels are reported to be low and manifestation of deficiency signs in most patients is suggestive of micro nutrient deficiencies . Food intake of these patients is affected by altered appetite, abdominal discomfort, cough and chewing problems. Meal satisfaction is also found to be low in these patients . In Pakistan, with high child morbidity and mortality rate (NNS, 2011), the burden of increasingly growing malnourished celiac patients could be devastating.
Nutritional assessment of celiac patients helps in identifying the degree of mal nutrition and determining the adequacy of food intake. Various factors affecting nutritional status have been identified. These include socio economic and demographic variables, nutrition and feeding practices, parent’s education, availability and access to health care environment, especially the maternal and child care facilities ; ; ; ; .
Determination of factors affecting nutritional status of celiac patients in developing countries has been a neglected area of research. Compliance is considered a major factor in the enhancement of the nutritional status of celiac patients but research findings are still controversial and need further probing. See and Murray (2006) stated that a strict compliance to GFD in most patients will result in complete histologic recovery of the disease. In contrast to that, Reasoner (2012) reported that the restoration of small intestines of more than half adults with celiac disease is not complete despite following GFD for up to 5 years. Recent researchers have not found any statistically significant correlation between compliance to GFD and other clinical or demographic variables
Evidence suggests that compliance to GFD results in increased body weight, fat mass, bone mass and nutritional and biochemical status . Studies have also shown that although patients who strictly adhere to a GFD ingest fewer calories than non-compliant patients, their body composition parameters are healthier. Weight gain and increased percentage of body fat has been reported in some celiac patients due to the ingestion of high fat foods. There has been controversy in assessing the extent of improvement in different body compartments after complying with GFD. It is reported that normalization of fat mass, lean mass and bone mass takes place with GFD especially in young patients ; ; .
In contrast to the above mentioned studies, Bode et al. (1991) have reported lower body mass index, lesser total body fat mass and reduced bone mineral content in the spine and in the forearms in treated celiac patients. Serum concentrations of albumin, vitamin D binding protein, and iron have also been found to be low. One reason for the deficiencies and imbalances of nutrients in celiac patients on a strict GFD could be that GFD and commercially available gluten-free products are often low in micro nutrients and fiber contents . Similar results have been reported in a study by Barera et al. (2000). They summarized that after the first year of treatment, bone mineral content and concentrations of serum calcium, phosphorus, magnesium, albumin and intact parathyroid hormone do not change significantly. Radlović et al. (2009) found that GFD given for 1-3 years significantly improved nutritional status of celiac children. However there was no significant difference among strictly compliant or non-compliant patients.
Present study was aimed to determine the association of nutritional status of celiac patients of Lahore with various demographic and dietary variables especially compliance to GFD. A hypothesized framework of determinants of nutritional status of celiac patients was developed and was tested statistically (Fig. 1)
Materials and Methods
A sample of 50 diagnosed celiac patients (both by duodenal endoscopy and serological testing for IgG and IgA) were selected from The Gastroenterology and Pediatric Department of Shaikh Zayed Medical Complex and Mayo Hospital, Lahore. Enrollment was done after the approval of Institutional Review Board (IRB) (Ref. No. F.38/NHRC/Admn/IRB/346), Dated 25-09-2012. These patients had been recommended gluten free diet since at least past three months.
The age of the selected participants ranged from 1-50 years. Majority of them (88%) were diagnosed as celiac at the age of 18 years or less. Half of the sample comprised of male and the rest of female patients. All patients belonged
to middle or low socioeconomic status when assessed by the method for various socioeconomic levels developed by Nagra et al. (1984).
Seventy percent of the participants in the present study did not report any other disease. Ten percent of the sample was suffering from health problems including skin and eye allergies and lactose intolerance. Chronic conditions like asthma, liver dysfunction, and diabetes were present in a small number of patients. Eight percent of the sample was suffering from multiple problems including a combination of allergies, asthma, hypothyroidism and tuberculosis.
Data was collected through a detailed structured interview schedule. It included detailed diet history, 24 h recall, and food frequency questionnaire (FFQ) . FFQ was modified and local, commonly consumed food items were added in the list. It also included the serving sizes and preparation method to validate the information provided in the 24 h recall. Owing to the low literacy level and poor understanding of the patients, detailed information about the utensils they were using at home was taken and the food quantity was estimated as precisely as possible. Exchange lists were used for the calculation of carbohydrates, proteins and fats in grams. Total calories were calculated by converting the grams with the factors of 4, 4 and 9 for carbohydrate, protein and fat respectively. For packaged snacks, juices, carbonated drinks and dietary supplements, nutrition information available on the labels was used.
Anthropometric measurements included height, weight and mid upper arm circumference (MUAC) ; WHO, 2008). BMI was calculated from the above measurements using the following formula: BMI= weight (kg)/height (m)2 Weight, height and BMI of celiac children were plotted on percentile charts for stature for age, weight for age, weight for stature and BMI for age (CDC, 2000). Based on anthropometric measurements nutritional status scores were assigned to each individual according to the percentiles scored by them on stature for age, weight for age, weight for stature and BMI. A person scoring less than normal on at least three of these indices was regarded as having poor nutritional status.
Biochemical parameters included Hemoglobin estimated through Sysmax K-21 Hematology analyzer, Serum albumin employing Bromocresol Green Method , protein using Biuret method (Rose, 1833) and calcium through Clark and Collip method , was estimated using Human kits. Results were compared with the standards set by WHO (2008), Mahan and Escott-Stump (2008) and Bishku (2005) for analysis.
Based on biochemical assessment, nutritional status scores were assigned to each individual according to the levels of hemoglobin, serum albumin, total proteins and calcium. A person scoring less than normal on at least three of these biochemical tests was regarded as having poor nutritional status.
Statistical analysis
SPSS version 15 was used for analyzing data. Descriptive analysis included mean and standard deviations for continuous numerical variables and frequency (percentages) for categorical data.
Table I.- Association of nutritional status (based on anthropometric evaluation) with demographic and dietary factors in celiac patients.
| Variables | n (%) | Good nutritional status** | |||
| % of the sample | OR | (95% CIs) | |||
| Socio demographic characteristics | |||||
| Age (years) | ≤18 | 39(78) | 69.2 | 6.00* | 1.35-26.65 |
| >18 | 11(22) | 27.3 | |||
| Age at diagnosis | <=12 mo | 7 (14) | 71.4 | 1.80 | 0.31-10.34 |
| >12 mo | 43(86%) | 58.1 | |||
| Gender | Male | 25(50) | 64.0 | 1.40 | 0.45-4.35 |
| Female | 25(50) | 56.0 | |||
| Residence | Urban | 40(80) | 60.0 | 1 | 0.23-4.11 |
| Rural | 10(20) | 60.0 | |||
| Monthly Income (Rs) | ≤20,000 | 29 (58) | 62.1 | 1.23 | 0.39-3.85 |
| >20,000 | 21 (42) | 57.1 | |||
| Number of family members | ≤6 | 30(60) | 56.7 | 0.70 | 0.22-2.27 |
| >6 | 20(40) | 65.0 | |||
| Dietary intake | |||||
| Appetite | Poor | 5 (10) | 60.0 | 1.00 | |
| Good | 28 (56) | 64.3 | 0.83 | 0.12-5.85 | |
| Excellent | 17 (34) | 52.9 | 1.33 | 0.18-10.12 | |
| Meal satisfaction | Yes | 13 (26) | 69.2 | 1.71 | 0.45-6.58 |
| No | 37 (74) | 56.8 | |||
| Compliance to GFD | Good | 14 (28) | 64.3 | 1.29 | 0.36-4.62 |
| Poor | 36 (72) | 58.3 | |||
| Three meal pattern | Regular | 38 (76) | 57.9 | 0.69 | 0.18-2.68 |
| Irregular | 12 (24) | 66.7 | |||
| Intake of cola drinks | Daily | 6(12) | 16.7 | 0.10* | 0.011-.97 |
| Not daily | 44(88) | 65.9 | |||
| Intake of juices | Daily | 4(8) | 50.0 | 0.64 | 0.083-4.98 |
| Not daily | 46(92) | 60.9 | |||
| Intake of tea | Daily | 27 (54) | 48.1 | 0.33 | 0.10-1.09 |
| Not daily | 23 (46) | 73.9 | |||
| Kcal from simple sugars (% total calories) | <5% | 18(36) | 55.6 | 0.75 | 0.23-2.42 |
| >=5% | 32(64) | 62.5 | |||
| Total caloric intake (%requirement) | <100% | 17(34) | 57.6 | 0.74 | 0.22-2.48 |
| >=100% | 33(66) | 64.7 | |||
*p=.021; **based on anthropometry.
Chi squared test, Odds ratio, One-way analysis of variance and multiple comparisons of means using Least Significant Difference (LSD) test and Pearson’s correlation coefficient was used for drawing inferences. All statistical testing was done at 95% significance level; p trend less than 0.05 were considered significant.
Results and Discussion
Nutritional status of the study participants was found to be significantly associated with age. Participants aged <=18 years were 6 times (OR=6.000 [95% CI1.351-26.649]) more likely to have good nutritional status based on anthropometric indices compared to those who were > 18 years old (p<0.05) (Table I). This lead was however, not observed in biochemical parameters (OR=1.67 [95% CI0.38-7.29]). Patients diagnosed at a younger age i.e. within first year of their lives, were 1.8 times as likely to have good nutritional status based on anthropometry than those diagnosed at an older age (OR=1.80 [95% CI0.31-10.34]). This finding was however, not statistically significant (p>0.05) (Table I). These findings could be related to the fact that shorter duration of the disease and early detection resulted in less villous atrophy and consequently better body dimensions. Such an association between degree of villous injury and nutritional status has been suggested elsewhere .
Among the socio demographic factors, monthly income was found to be significantly associated with the nutritional status assessed on the basis of biochemical tests. Participants having a family income of >=Rs. 20,000 per month, were four times more likely to have good biochemical results compared to those with family monthly income less than Rs. 20,000 (OR= 3.967 (95% CI= 1.070-14.705)) (Table II). Family income has previously been recognized as a major determinant of nutritional status by Ali et al. (2016). Association of nutritional status and gender was prominent, though not statistically significant. Females were about twice as likely to be good on biochemical indices compared to males (OR= 2.020 [95% CI= .623-6.557]) (Table II). This finding was in contrast with other studies that have reported a higher occurrence of low BMI, low hemoglobin and more frequent episodes of diarrhea in female celiac patients as compared to the male patients ; .
Other demographic variables including residence, and number of family members were not found to be associated with either anthropometric or biochemical parameters (Tables I, II). These results partially vary with the findings that suggested that these factors are indicative of nutritional status in normal populations ; ; ; ; .
Table II.- Association of nutritional status (based on biochemical evaluation) with demographic and dietary factors in celiac patients.
| Variables | Good nutritional status Ϯ | |||
| % of the sample | OR | (95% CIs) | ||
| Socio demographic characteristics | ||||
| Age (years) | ≤18 | 62 | 1.67 | 0.38-7.29 |
| >18 | 73 | |||
| Age at diagnosis with celiac disease | <=12 mo | 57 | 1.40 | 0.28-7.10 |
| >12 mo | 65 | |||
| Gender | Male | 56 | 2.02 | 0.62-6.56 |
| Female | 72 | |||
| Residence | Urban | 63 | 1.40 | 0.31-6.25 |
| Rural | 70 | |||
| Monthly Income (Rs) | ≤20,000 | 52 | ||
| >20,000 | 81 | 3.97* | 1.07-14.70 | |
| Number of family members | ≤6 | 57 | 2.29 | 0.66-7.95 |
| >6 | 75 | |||
| Dietary intake | ||||
| Appetite | Poor | 71 | 0.64 | 0.18-2.24 |
| Good | 61 | |||
| Meal satisfaction | Yes | 77 | 0.44 | 0.10-1.87 |
| No | 60 | |||
| Compliance to GFD | Good | 64 | 0.98 | 0.27-3.56 |
| Poor | 64 | |||
| Three meal pattern | Regular | 61 | 1.96 | 0.46-8.42 |
| Irregular | 75 | |||
| % total calories from wheat | ≤1% | 60 | 1.42 | 0.44-4.52 |
| >1% | 68 | |||
| Intake of cola drinks | Daily | 67 | 0.88 | 0.14-5.32 |
| Not daily | 64 | |||
| Intake of juices | Daily | 50 | 1.88 | 0.24-14.59 |
| Not daily | 65 | |||
| Intake of tea | Daily | 67 | 0.79 | 0.24-2.48 |
| Not daily | 61 | |||
| Kcal from simple sugar (% total calories) | <5% | 56 | 1.76 | 0.53-5.80 |
| >=5% | 69 | |||
| Total caloric intake (%requirement) | <100% | 70 | 0.49 | 0.15-1.64 |
| >=100% | 53 | |||
*Chi sq. (df) =4.516 (1), p=0.034. Ϯ Based on blood biochemistry. Cut off points include: Hb Below normal :≤9.0 mg/dl; Normal:>9.0 mg/dl; Albumin: Below normal:≤3.4 mg/dl; Normal:>3.4 mg/dl; Total proteins: Below normal:≤6.0 mg/dl; Normal:>6.0 mg/dl; Calcium: Below normal:≤8.5 mg/dl; Normal:>8.5 mg/dl.
Detailed diet history of the study participants revealed that most of them (70%) were consuming rice regularly (Table III). This dietary pattern of celiac patients is in accordance with that mentioned by Bascuñán et al. (2016), who reported that in spite of many gluten free choices available, rice is the most commonly consumed cereal.
Table III.- Frequency of consumption of different types of staple cereals.
| Cereals | Reg. (5-7/wk) | Somet. (3-4/wk) | Occasion. (1-2/wk) | R/N (1/month or less) |
| Chapatti (wheat) | 8(16.0) | 4(8.0) | 2(4.0) | 36 (72.0) |
| Chapatti (other than wheat) | 12 (24.0) | 5(10) | 4(8.0) | 29(58.0) |
| Rice | 35(70.0) | 8(16.0) | 3(6.0) | 3(4.0) |
Reg., regularly; Somet., sometimes; Occasion., occasionally; R, rarely; N, never.
Few participants were regularly using natural gluten free flours for making chapatti. Corn flour was the most commonly used option and was being used by approximately one fourth of the patients. Very small number of patients reported the use of other flours including baisin (dal chana flour), rice, gram and millet flour (10%, 6%, 2% and 2%, respectively). Only two patients reported the use of a combination of the above flours (Fig. 2).
Although the patients were advised gluten free diet by the physician, 28% of them were still consuming wheat chapatti at least once a week. Significantly high proportion of the participants (p<0.05) reported partial or absolute noncompliance (consuming wheat containing foods) (Table IV). Main reasons for noncompliance with GFD were the lack of understanding of patients about gluten free choices, temptations, poverty and ignorance about the hazards of non-compliance (Fig. 3). Partial compliance by the celiac patients has been documented in various studies. Studies in Europe have reported poor compliance especially in teen agers and adults ; . On the contrary, some researchers have reported compliance rates to be as high as 70%, 75% and 96% (Hopman et al., 2009; Black and Orfila, 2011).
Table IV.- Descriptive statistics for compliance with GFD and general appetite of the sample.
| Variables | Percentage of the sample (%) | Test statistic | |||
| Never | Sometimes | Always | |||
| Compliance to GFD | 16.0 | 56.0 | 28.0 | χ2=12.640, p=0.002 | |
| Good appetite | 2.0 | 64.0 | 34.0 | χ2=28.840, p=0.000 | |
| Meal regularity | Breakfast taken | 2.0 | 12.0 | 86.0 | χ2=63.160, p=0.000 |
| Lunch taken | 2.0 | 36.0 | 62.0 | χ2=21.160, p=0.000 | |
| Dinner taken | 36.0 | 30.0 | 34.0 | χ2=25.480, p=0.000 | |
| Feeling of hunger between meals | Breakfast and lunch | 18.0 | 60.0 | 22.0 | χ2=16.120, p=0.000 |
| Lunch and dinner | 8.0 | 62.0 | 30.0 | χ2=22.120, p=0.000 | |
| Snacking between meals | Breakfast and lunch | 42.0 | 36.0 | 22.0 | χ2=3.160, p=0.206 |
| Lunch and dinner | 26.0 | 50.0 | 24.0 | χ2=6.280, p=0.043 | |
| After dinner | 58.0 | 30.0 | 12.0 | χ2=16.120, p=0.000 | |
Table V.- Correlation (Pearson’s r) of wheat exchanges with exchanges of different food groups consumed by celiac patients.
| No. of exchanges | 1 | 2 | 3 | 4 | 5 | 6 | 7 | 8 | 9 |
| Wheat | 1 | ||||||||
| Fruit | -0.141 | 1 | |||||||
| Vegetable | -0.082 | 0.015 | 1 | ||||||
| Meat | 0.326* | 0.158 | 0.164 | 1 | |||||
| Lentil | -0.227 | -0.142 | 0.050 | -.0158 | 1 | ||||
| Fat | 0.100 | 0.049 | 0.385** | 0.603** | 0.168 | 1 | |||
| Sugar | -0.033 | 0.040 | 0.101 | 0.197 | -0.102 | 0.224 | 1 | ||
| Cereal | -0.119 | -0.123 | 0.282* | 0.226 | 0.078 | 0.358* | -0.135 | 1 | |
| Whole milk | -0.138 | -0.005 | 0.199 | -0.038 | -0.083 | -0.059 | 0.295* | 0.040 | 1 |
** Correlation is significant at the 0.01 level (2-tailed). *Correlation is significant at the 0.05 level (2-tailed).
Table VI.- Consumption frequency (intake /week) of carbonated beverages, packaged juices, commercial snacks, candies and chocolates by celiac patients of different age groups.
| Age | Carbonated beverages | Packaged juice | Commercial snacks | Candies | Chocolates |
| 1-3 | 0.92±2.01ab | 0.00±0.00a | 2.17±2.64a | 1.17±1.83a | 0.67±1.63a |
| 4-8 | 2.02±2.68ab | 2.10±3.07bc | 2.19±2.87a | 1.75±2.56a | 1.08±1.83a |
| 9-13 | 0.57±1.03b | 0.50±0.84a | 1.32±1.66a | 2.38±3.18a | 2.00±2.98a |
| 14-18 | 2.75±2.87ab | 3.00±3.16c | 6.00±1.15b | 3.25±3.77a | 3.50±2.38a |
| 19-30 | 3.04±2.30ac | 1.00±1.97ac | 1.46±1.52a | 1.67±2.88a | 3.33±1.97a |
| 31-50 | 3.00±3.67ac | 0.10±0.22ab | 1.30±1.57a | 1.20±2.68a | 0.60±1.34a |
Mean values followed by different letter in a column are significantly different at p< 0.05.
Most of the patients reported good and even increased appetite. Breakfast and lunch meals were taken regularly by most of the patients (86% and 62%, respectively) and dinner was the commonly skipped meal. Significantly larger proportion of the patients consumed breakfast and lunch regularly compared with those who did not consume (p<0.05). A significantly large number of the participants (p<0.05) reported that they felt hungry between meals. Their snacking practices, however, did not necessarily comply with their hunger feelings. This finding may hint at the role of certain underlying factors like poverty and lack of understanding about gluten free choices for snacks (Table IV).
It was revealed that non-compliant patients were taking more meat and fat than compliant patients and therefore their intake of good quality proteins and calories was higher (Table V). Mariani et al. (1998) observed that strict consumption of GFD worsen the already nutritionally imbalanced diet of adolescent celiac patients. He further reported increased lipid consumption by compliant patients. Findings of study at hand are also in line with those results. Patients of age 14 to 18 years who has been reported to be the most compliant age group were consuming the highest amounts of calorie-dense foods in the form of packaged snacks (p<0.05). Consumption of carbonated beverages, packed juice, candies and chocolates was also high in this age group (Table VI). This resulted in higher consumption of carbohydrates and fats as well as the total calories. In the developed countries high fat and low fiber content of gluten free products has been recognized as a factor contributing to excessive caloric intake and malnutrition in celiac patients . The current study indicates similar findings for a developing country.
Routine intake of carbonated beverages showed significant association with nutritional status of the celiac patients. Participants who consumed carbonated beverages less frequently (<once a day) were 9.7 times more likely to have good nutritional status compared to those who reported drinking carbonated beverages daily (OR=9.70 [95% CI=0.011-0.970]). The intake of other beverages including tea and packaged juices was also negatively associated with nutritional status, although the results were not statistically significant (p>0.05) (Table I).
Bascuñán et al. (2016) has stressed that compliance to GFD alone could not result in substantial improvement in nutritional status of celiac children unless the diet was balanced in terms of other macro and micronutrients. Good nutritional outcome with GFD compliance has been reported in those studies where GFD was nutritionally adequate. It has been demonstrated that GFD could improve the nutritional status of celiac patients when it was a Mediterranean-type diet comprising of legumes, whole grain cereals, fruits, and vegetables, and fish . In the present study compliance was not found to be associated with nutritional status of the study participants (OR=1.286, (95%CI=0.358-4.617). Similarly, appetite and meal regularity were also not significantly associated with the nutritional status (p> 0.05) (Tables I, II).
Patients who reported to be satisfied with their meals were about twice as likely to have good nutritional biochemical parameters (OR= 0.440 (95% CI= 0.103-1.871). These results although not statistically significant, hint on the fact that poor satisfaction from meals could increase the likelihood of unhealthy snacking and defiance from GFD. This interpretation is further strengthened by the finding that meeting caloric requirements (perhaps by additional snacks, taking empty calories or gluten containing foods) did not seem to enhance the nutritional status. Those celiac patients whose average caloric consumption was less than their requirements were about twice more likely to have good nutritional biochemistry (OR= 0.489 (95% CI= 0.146-1.636, p>0.05) (Table II).
Results of the present study clearly indicate that the nutritional status of celiac patients cannot be predicted exclusively based on the factors identified for the normal population. Merely recommending a GFD to celiac patients may not yield appreciable outcomes. Strict compliance may have negative impact on the already poor nutritional status. Detailed nutrition education along with ensuring the availability of healthy gluten free choices are the potentially effective interventions for ensuring good nutritional status of Pakistani celiac patients.
Conclusion
Young age, early diagnosis, higher family income, female gender and meal satisfaction is associated with better nutritional parameters of celiac patients. Most celiac patients are partially compliant to GFD. More junk food is consumed by patients with better compliance, conversely less compliant patients have higher intake of meat and fat. Regular intake of carbonated beverages, packaged juices and tea is associated with poor nutritional outcome. There is no significant difference in the nutritional status of highly compliant and non-compliant patients. An integrated interventional approach including access to healthy gluten free choices and proper nutrition education is necessary.
Acknowledgement
The financial assistance provided by the Pakistan science foundation, government of Pakistan under project no: psf/nslp/p-pu (195) for this study is very cordially acknowledged
Statement of conflict of interest
Authors have declared no conflict of interest.
Figures
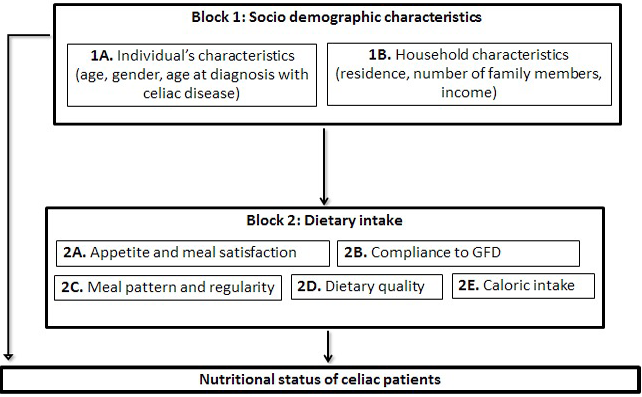
Hypothesized framework for determinants of nutritional status in celiac patients.
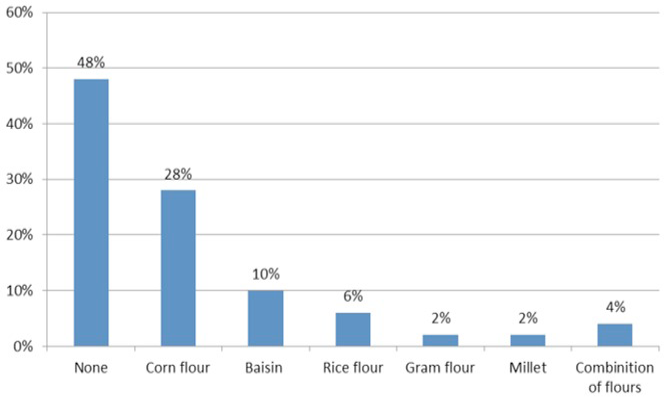
Gluten free flours used by the celiac patients for making chapatti.
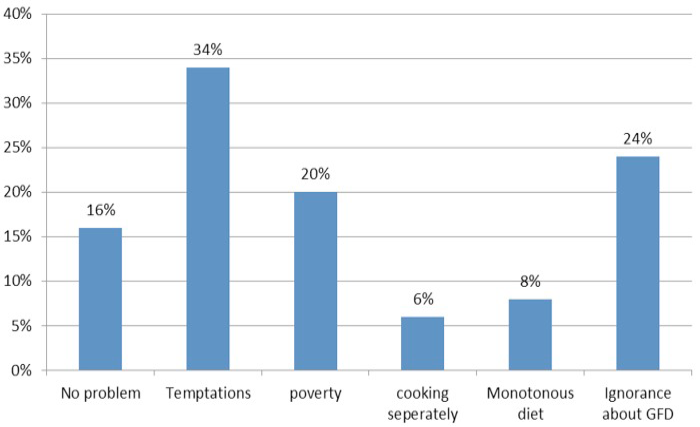
Problems faced by patients in following GFD.
References
- Ali, A.M., Batu, M. and Kaushik, K., 2016. Socio-economic determinants of nutritional status of children in Ethiopia. Int. J. Sci. Res. Publ., 6: 166.
- Barera, G., Mora, S., Brambilla, P., Ricotti, A., Menni, L., Beccio, S. and Bianchi, C., 2000. Body composition in children with celiac disease and the effects of a gluten-free diet: A prospective case-control study. Am. J. clin. Nutr., 72: 71-75.
- Barker, J.M. and Liu, E., 2008. Celiac disease: Pathophysiology, clinical manifestations and associated autoimmune conditions. Adv. Pediatr., 55: 349-365. https://doi.org/10.1016/j.yapd.2008.07.001[CrossRef]
- Barone, M., Della-Valle, N., Rosania, R., Facciorusso, A., Trotta, A., Cantatore, F.P., Falco, S., Pignatiello, S., Viggiani, M.T., Amoruso, A., De Filippis, R., Di Leo, A. and Francavilla, R., 2015. A comparison of the nutritional status between adult celiac patients on a long-term, strictly gluten-free diet and healthy subjects. Eur. J. clin. Nutr., 70: 23-27. https://doi.org/10.1038/ejcn.2015.114[CrossRef]
- Bascuñán, K.A., Vespa, M.C. and Araya, M., 2017. Celiac disease: Understanding the gluten-free diet. Eur. J. Nutr., 56: 449-459. https://doi.org/10.1007/s00394-016-1238-5[CrossRef]
- Bishku, D.A., 2005. Classification of malnutrition in children. Available at: https://www.google.com.pk/url?sa=t&rct=j&q=&esrc=s&source=web&cd=10 &cad=rja&uact=8&ved=0ahUKEwiZj_ S2pIzYAhVOOMAKHfuFCQQQFgg6MAk&url= https%3A%2F%2Fxa.yimg.com%2Fkq%2Fgroups%2F22363766%2F1577284999%2Fname%2Fon%2Bnutrition-pedia.doc&usg =AOvVaw2rqhIgIwOV23MkD_LiM9um (Accessed 15 January 2013)
- Black, J.L. and Orfila, C., 2011. Impact of coeliac disease on dietary habits and quality of life. J. Hum. Nutr. Diet., 24: 582-587. https://doi.org/10.1111/j.1365-277X.2011.01170.x[CrossRef]
- Bodé, S., Hassager, C., Gudmand-Høye, R E. and Christiansen, C., 1991. Body composition and calcium metabolism in adult treated coeliac disease. Gut, 32: 1342-1345. https://doi.org/10.1136/gut.32.11.1342[CrossRef]
- Byass, P., Kahn, K. and Ivarsson, A., 2011. The global burden of childhood celiac disease: A neglected component of diarrheal mortality? PLoS One, 6: e22774. https://doi.org/10.1371/journal.pone.0022774[CrossRef]
- Capristo, E., Addolorato, G., Mingrone, G., Gaetano, A., Greco, A.V., Tataranni, P.A. and Gasbarrini, G., 2000. Changes in body composition, substrate oxidation, and resting metabolic rate in adult celiac disease patients after a 1-y gluten-free diet treatment. Am. J. clin. Nutr., 72: 76-81.
- Cataldo, C.B., Debruyne, L.K. and Whitney, E.N., 1999. Nutrition and diet therapy, 5th edn. Wadsworth Publishing Company, USA.
- CDC Growth Charts, 2000. Developed by National Center for Health Statistics and National Center for Chronic Disease Prevention and Health Promotion. Available at: http://www.cdc.gov/growthcharts
- Charalampopoulos, D., Panayiotou, J., Chouliaras, G., Zellos, A., Kyritsi, E. and Roma, E., 2013. Determinants of adherence to gluten-free diet in Greek children with coeliac disease: A cross-sectional study. Eur. J. clin. Nutr., 67: 615-619. https://doi.org/10.1038/ejcn.2013.54[CrossRef]
- Cheesbrough, M., 2005. District laboratory practice in tropical countries, Part 1: 2nd edn. Cambridge University Press. https://doi.org/10.1017/CBO9780511581304[CrossRef]
- Covinsky, K.E., Martin, G.E., Beyth, R.J., Justice, AC., Sehgal, A.R. and Landefeld C.S., 1999. The relationship between clinical assessments of nutritional status and adverse outcomes in older hospitalized medical patients. J. Am. Geriatr. Soc., 47: 532-538. https://doi.org/10.1111/j.1532-5415.1999.tb02566.x[CrossRef]
- Dickey, W. and Kearney, N., 2006. Overweight in celiac disease: prevalence, clinical characteristics, and effect of a gluten-free diet. Am. J. Gastroenterol., 101: 2356-2359. https://doi.org/10.1111/j.1572-0241.2006.00750.x[CrossRef]
- Girma, W. and Genebo, T. 2002. Determinants of nutritional status of women and children in Ethiopia. Report by Ethiopia Health and Nutrition Research Institute, Calverton, ORC Macro, Maryland, USA.
- Green, P.H.R. and Cellier, C., 2007. Celiac disease. New Engl. J. Med., 357: 1731-1743. https://doi.org/10.1056/NEJMra071600[CrossRef]
- Haapalahti, M., Kulmala, P., Karttunen, T., Paajanen, L., Laurila, K., Mäki, M., Mykkänen, H. and Kokkonen, J., 2005. Nutritional status in adolescents and young adults with screen-detected celiac disease. J. Pediat. Gastroenterol. Nutr., 40: 556-570. https://doi.org/10.1097/01.MPG.0000154658.16618.F9[CrossRef]
- Hopman, E.G., Koopman, H.M., Wit, J.M. and Mearin, M.L., 2009. Dietary compliance and health-related quality of life in patients with coeliac disease. Eur. J. Gastroenterol. Hepatol., 21: 1056-1061. https://doi.org/10.1097/MEG.0b013e3283267941[CrossRef]
- Imran, S., Javed, T. and Nagra, S.A., 2014. Effect of formulated gluten free flour on the nutritional status of celiac patients. J. Nutr. Ecol. Fd. Res., 2: 54-63. https://doi.org/10.1166/jnef.2014.1056[CrossRef]
- Imran, S., Kalsoom, S. and Nagra, S.A., 2016. The impact of formulated gluten free flour on the dietary pattern of celiac Pakistani patients. Pakistan J. Zool., 48: 415-422.
- Kabubo-Mariara, J., Ndenge, G. and Mwabu, D., 2009. Determinants of children’s nutritional status in Kenya: Evidence from demographic and health surveys. J. Afr. Econ., 18: 363-387. https://doi.org/10.1093/jae/ejn024[CrossRef]
- Kanjilal, B., Mazumdar, P.G., Mukherjee, M. and Rahman, M.H., 2010. Nutritional status of children in India: household socio-economic condition as the contextual determinant. Int. J. Equity Hlth., 9: 1. https://doi.org/10.1186/1475-9276-9-19[CrossRef]
- Kupper, C., 2005. Dietary guidelines and implementation for celiac disease. Gastroenterology, 128: 121-127. https://doi.org/10.1053/j.gastro.2005.02.024[CrossRef]
- Lasa, A., Miranda, J., Bulló, M., Casas, R., Salas-Salvadó, J., Larretxi, I., Estruch, R., Ruiz-Gutiérrez, V. and Portillo, M.P., 2014. Comparative effect of two Mediterranean diets versus a low-fat diet on glycaemic control in individuals with type 2 diabetes. Eur. J. clin. Nutr., 68: 767-772. https://doi.org/10.1038/ejcn.2014.1[CrossRef]
- Mahan, K.L. and Escott-Stumps, S., 2008. Krause’s Food and nutrition therapy, 12th edn. Saunders, Canada.
- Mariani, P., Viti, M.G., Montuori, M., La Vecchia, A., Cipolletta, E., Calvani, L. and Bonamico, M., 1998. The gluten-free diet: A nutritional risk factor for adolescents with celiac disease? Pediat. Gastroenterol. Nutr., 27: 519-523. https://doi.org/10.1097/00005176-199811000-00004[CrossRef]
- Mulder, C.J., Van Wanrooij, R.L., Bakker, S.F., Wierdsma, N. and Bouma, G., 2013. Gluten-free diet in gluten-related disorders. Dig. Dis., 31: 57-62. https://doi.org/10.1159/000347180[CrossRef]
- Murray, J.A., Watson, T., Clearman, B. and Mitros, F., 2004. Effect of a gluten-free diet on gastrointestinal symptoms in celiac disease. Am. J. clin. Nutr., 79: 669-673.
- Nagra, S.A., Gilani, A.H., Ahmad, M.D. and Ehsan-ul-Haq, 1984. A Longitudinal study in body-weight of Pakistani infants as influenced by socioeconomic-status. J. Trop. Pediat., 30: 217-220. https://doi.org/10.1093/tropej/30.4.217[CrossRef]
- National Nutrition Survey (NNS), 2011. National Nutrition Survey Report. Planning Commission and Development Division Government of Pakistan. Aga Khan University, Pakistan Medical Research Council and Government of Pakistan.
- Radlović, N., Mladenović, M., Leković, Z., Zivanović, D., Brdar, R., Radlović, V. and Djurdjević, J., 2009. Effect of gluten-free diet on the growth and nutritional status of children with coeliac disease. Srp. Arh. Celok. Lek., 137: 632-637. https://doi.org/10.2298/SARH0912632R[CrossRef]
- Reasoner, J., 2012. The celiac disease epidemic: Why gluten free isn’t enough? Available at: http://scdlifestyle.com/2012/01/the-celiac-disease-epidemic-why-gluten-free-isnt-enough/Cited (Accessed 15 December 2012).
- Rose, F., 1833. Über die Verbindungen des Eiweiss mit Metalloxyden (On the compounds of albumin with metal oxides). Poggendorfs Annal Physik Chem., 104: 132-142. https://doi.org/10.1002/andp.18331040512[CrossRef]
- Rostom, A., Murray, J.A. and Kagnoff, M.F., 2006. Medical position statement on celiac disease. Gastroenterology, 131: 1977-1980. https://doi.org/10.1053/j.gastro.2006.10.003[CrossRef]
- Sassi, M., 2014. Economic ad health determinants of child nutritional status in the Malawian district of Salima. Eur. J. Dev. Res., 26: 761-782. https://doi.org/10.1057/ejdr.2013.62[CrossRef]
- See, J. and Murray, J.A., 2006. Gluten-free diet: The medical and nutrition management of celiac disease. Nutr. Clin. Pract., 21: 1-15. https://doi.org/10.1177/011542650602100101[CrossRef]
- World Health Organization, 2008. Training course on child growth assessment. WHO child growth standards. Course Director’s Guide, Department of Nutrition for Health and Development, WHO Press, China.
Services
Article usage statistics
Loading…