
Catla (Catla catla) is the most important commercial carp in South Asia due to its higher growth, flesh quality and increased market demand. Present study investigated the seasonal variations in gonadosomatic index (GSI) and profiles of sex steroids such as testosterone (T), 11-ketotestosterone (11-KT), estradiol-17β (E2), cortisol (C), progesterone (P) and 17α-hydroxyprogesterone (17α-HP) during annual reproductive cycle under semi-arid climate conditions. GSI increased during March concomitant with gradual increase in levels of T, P and 17α-HP. Highest values of these parameters were observed at different stages of gonadal development. T and 11-KT played key role in progress of testicular development and final maturation in June however, spawning in captivity was not observed. Role of P and 17α-HP was identified more as substrate of sex steroids. Higher levels of sex steroids suppressed the synthesis of cortisol presumably interfering with pituitary-inter-renal axis.
Short Communication · Volume 50, Issue 6, 10 November 2018 · Open Access
Monthly Variations in the Profile of Important Steroids during Annual Testicular Cycle in Catla catla: Basic Information for Future Study
· ·
Affiliations & Notes ⌄
- 1Department of Zoology, Government College University, Lahore , * Corresponding author: shafaq.fatima@y7mail.com
Article Info ⌄
- Journal:
- Pakistan Journal of Zoology
- Published:
- 10 November 2018

From the article
- Highest value of GSI (F11, 56 = 8.40, P < 0.5) was observed in June (0.48 ± 0.07 %) (Fig. 1) which dropped in July and remained low during rest of the study period.
- The present study investigated the gonadal development and its endocrine and environmental control during annual testicular cycle of catla under semi-arid climate conditions.
- In catla, cortisol profile showed a negative correlation with those of T and 11-KT.
- Overall, present study provided the basic information on endocrine control of testicular development in catla during second year of life, when fish matures first time in pond culture.
Selected from the article's own text.
Abstract
Materials and methods
This study was conducted according to procedures approved by the Government College University Animal Ethics Committee. Fish were reared at a commercial fish farm (Himalaya Fish Hatchery, Sheikhupura) under ambient water temperature and photoperiod throughout the study period (November, 2007 – October, 2008; Age: 18 months – 29 months). At each monthly sample point, a total of ten fish were randomly collected and transferred to University Aquaculture Facility. Fish were kept in tanks for 24 h to be released from stress of capture. Fish could not be distinguished into male and female due to lack of sexual dimorphism, therefore, number of male fish varied at each sample point from the required number of five. At sampling, fish were killed by killed by anesthetic overdose (30 µl L-1 AQUI-S). Total body weight (near to 0.1 g) and total body length (near to 0.1 cm) and gonadal weight (near to 0.1 g) were measured. GSI was measured by using following formula:

Blood samples were stored on ice until centrifugation (3000 rpm for 15 min). The plasma was stored at -80°C until assayed to determine the levels of sex steroids by ELISA (BIORAD). Detection limits of assay (ELISA) for T, 11-KT, E2, C, 17α-HP and P were 0 – 20 ng/ml, 0.00078 – 0.1 ng/ml, 0.25 – 1 ng/ml, 0.049 – 200 ng/ml, 0 – 1 ng/ml and 0.3 – 40 ng/ml, respectively.
Monthly variations were analyzed by one way ANOVA after analyzing the data by Levene’s test of homogeneity. Tukey’s post-hoc test was applied for comparison of means where P<0.05 indicated significant differences.
Results
Highest value of GSI (F11, 56 = 8.40, P < 0.5) was observed in June (0.48 ± 0.07 %) (Fig. 1) which dropped in July and remained low during rest of the study period. Levels of T showed significant (F11, 56 = 5.05, P < 0.5) rise in July (0.67 ± 0.10 ng/ml which dropped in August and remained low till end of the study (Fig. 2A). 11-KT exhibited two peaks during the months of May and September (F11, 56 = 3.96, P < 0.5) (Fig. 2B). l’[Levels of E2 remained within the range of 0.5 ± 0.01 – 0.13 ± 0.02 ng/ml over the study period (F11, 56 = 13.10, P < 0.5) (Fig. 2C). A significant rise in levels of C was observed during July (620.00 ± 30.50 ng/ml) (Fig. 2D). Over the study period, concentration of C remained within the range of 329.01 ± 40.43 – 639.15 ± 59.35 ng/ml (F11, 56 = 4.30, P < 0.5). Observed range of P (F11, 56 = 5.30, P < 0.5) and 17α-HP (F11, 56 = 7.30, P < 0.5) over the study period were 0.47 ± 0.02 – 0.47 ± 0.03 ng/ml and 0.20 ± 0.01 – 0.66 ± 0.03 ng/ml, respectively (Fig. 2E, F).
Discussion
The present study investigated the gonadal development and its endocrine and environmental control during annual testicular cycle of catla under semi-arid climate conditions. Higher levels of P and 17α-HP at this stage can be correlated with progression in spermatogonial proliferation exhibiting their role as substrate of T and 11-KT thus initiating spermatogenesis in this species. Relatively higher concentration of E2 at this stage could be associated with its role in spermatogonial proliferation as reported previously . Further testicular development i.e. initiation of meiosis and formation of spermatids might be regulated by high concentration of T during May and June as observed in other teleosts including catla . Peak in GSI was observed in June preceded by the peak of 11-KT while concomitant with peak in T. This finding is in contrast with that Bhattacharyya and Maitra (2006), who reported the highest value of GSI in July in same species. At this stage, milt could be extracted on manual stripping showing the final stages of development (milt hydration). These developmental changes were presumably found as a result of action of T and 11-KT and release of other growth factors mediated by these both androgens from sertoli cells .
In catla, cortisol profile showed a negative correlation with those of T and 11-KT. Cortisol secretion started decreasing from April and reached at its minimum value in June which is the period of the active spermeiogenesis. During this period concentrations of sex steroids were very high opposite to that of C consistent with previous studies ; . According to Mommsen et al. (1999) elevated levels of gonadal steroids modify the pituitary-inter-renal axis thus suppressing the levels of cortisol as observed in present study. Spawning was not observed in catla under captivity however, milt could not be stripped manually after July. This indicates regression of testes associated with decline in levels of androgens at this stage. This regressed phase in catla lasted from August till October exhibiting. Very low concentrations of testosterone and 11-KT. This decrease might reflect a shift in steroidogenesis pathways from synthesis of C19 androgens to production of C21 progestins production as levels of P and 17α-HP showed slight increase during this period of regressed testicular activity. Endocrine changes observed during testicular cycle of catla in present studies showed seasonal differences from previous study on catla (Bhattacharya and Maitra, 2006). They observed the peak of testosterone between July and August. This difference might be due to sub-tropical climate and geographical conditions in previous study . Temporal differences in occurrence of developmental events under different climates further highlight the importance and need of present study.
Conclusion
Overall, present study provided the basic information on endocrine control of testicular development in catla during second year of life, when fish matures first time in pond culture. This study is the first of its kind in Pakistan and provided the basal line reference values for reproductive parameters and will become the base for many advanced studies on the control of reproduction of this fish in semi-arid regions.
Statement of conflict of interest
Authors have declared no conflict of interest.
Figures
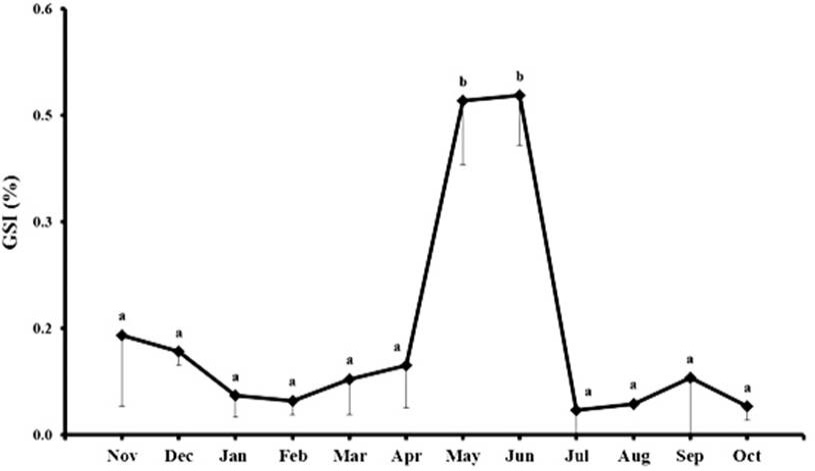
Monthly variations (mean ± SE) in gonadosomatic index (GSI) during the annual reproductive cycle of male Catla catla (November, 2007–October, 2008; age = 18–29 months). Significantly different subsets (P<0.05) given by Tukey’s HSD are indicated by letters.
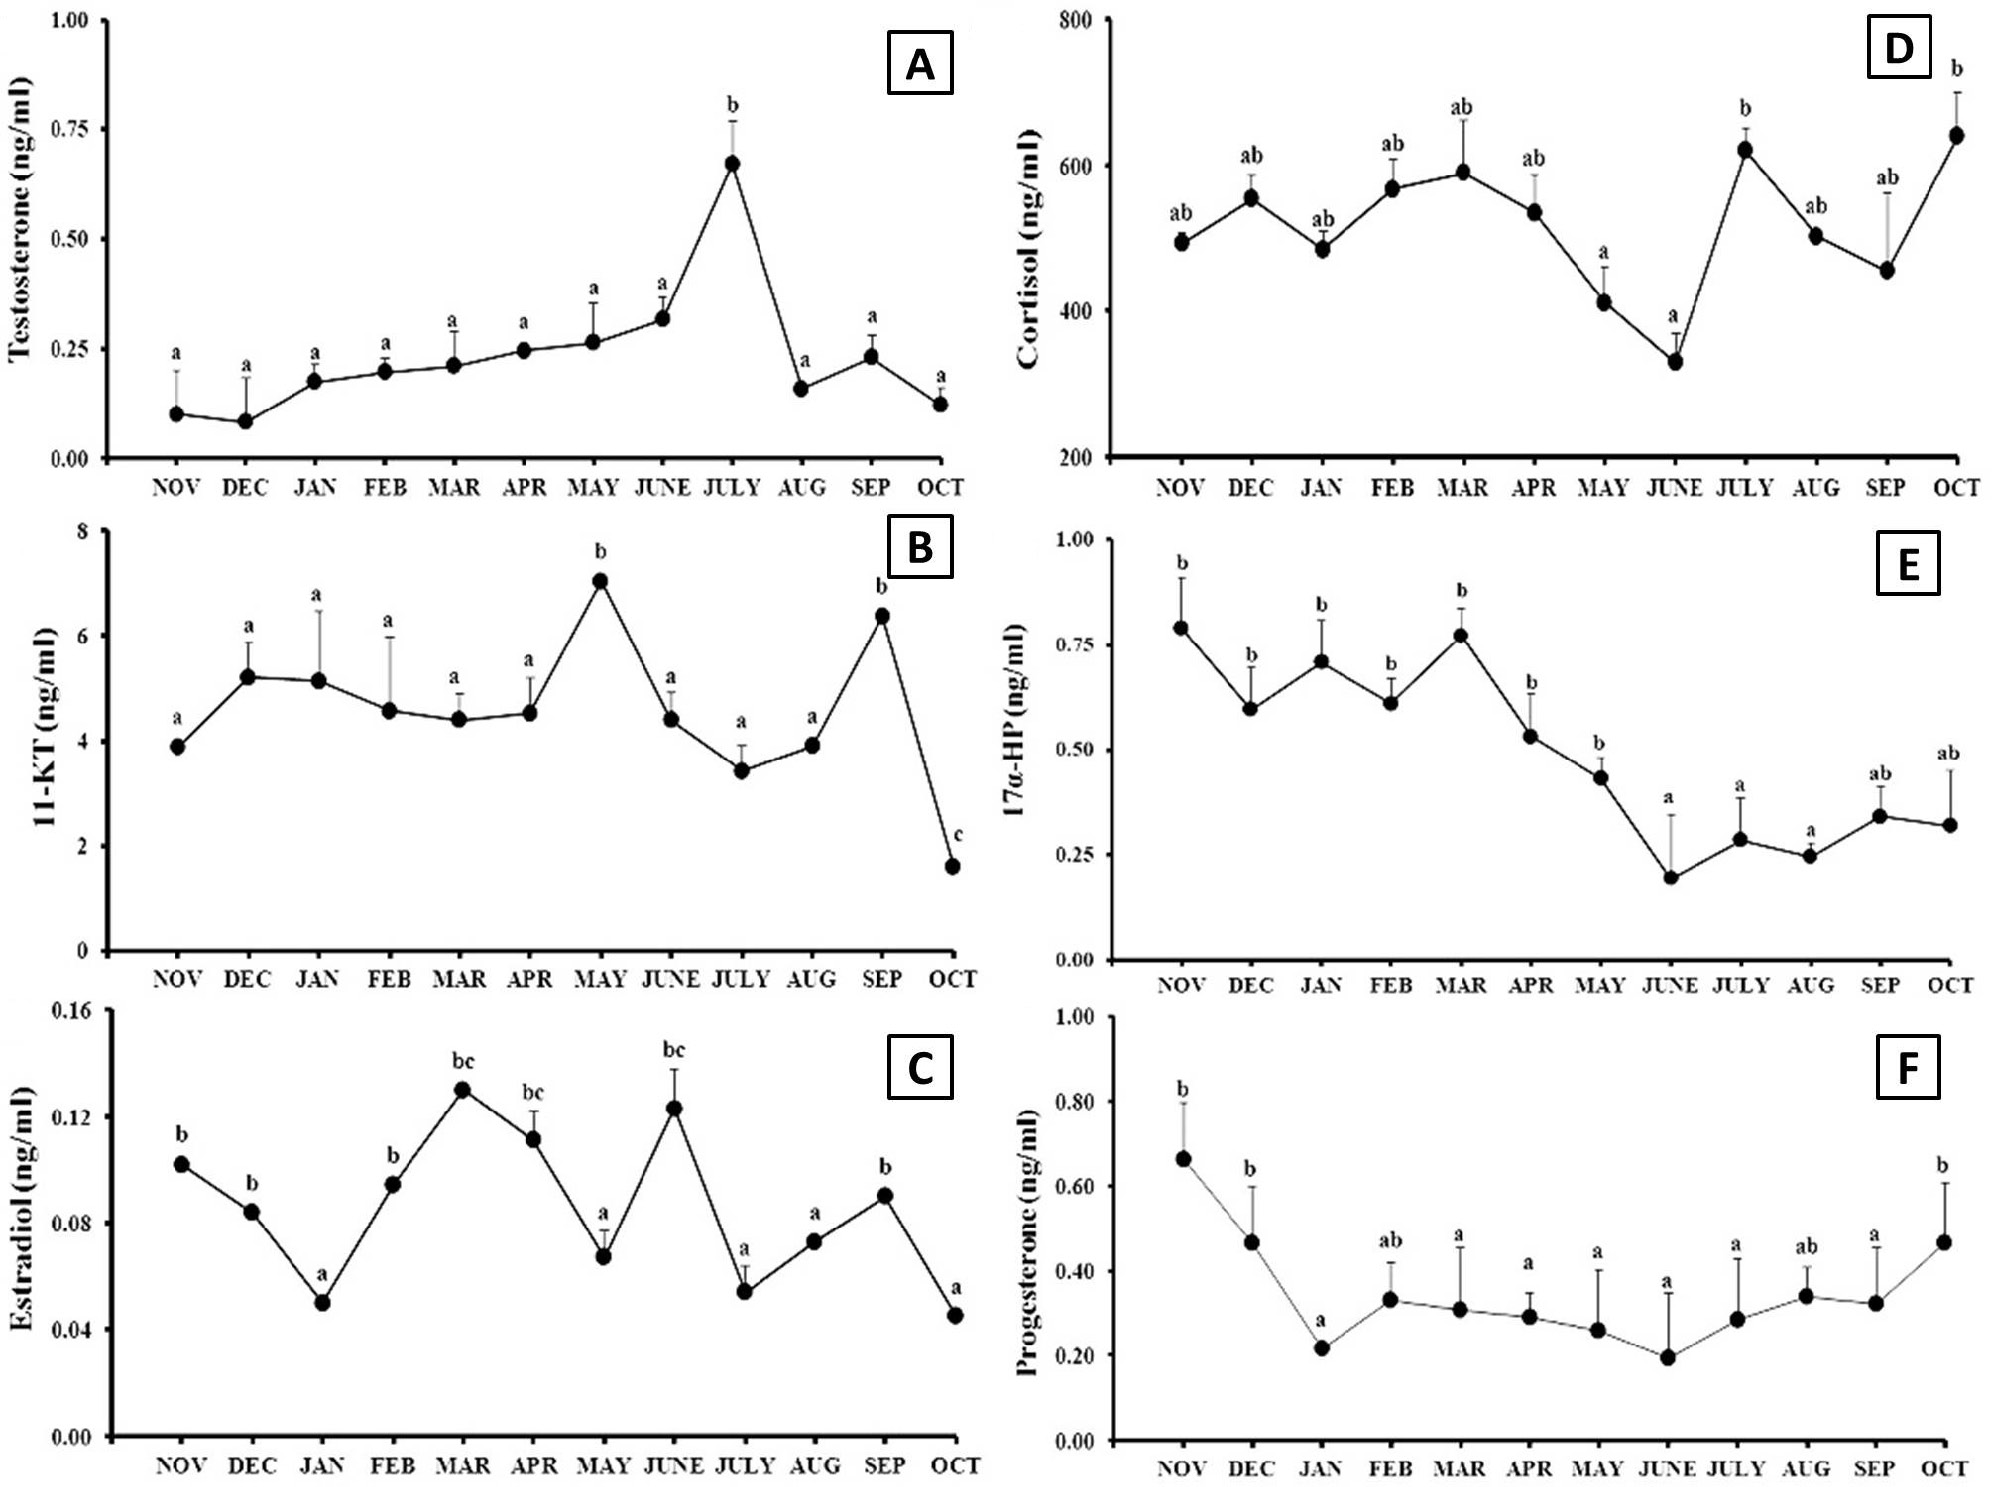
Monthly variations (mean ± SE) in profile of testosterone (A), estradiol-17β (B), 11-ketotestosterone (C), cortisol (D), 17α-HP (E) and progesterone (F) during the annual reproductive cycle of male Catla catla. Significantly different subsets (P<0.05) given by Tukey’s HSD are indicated by letters.
References
- Bhattacharyya, S. and Maitra, S.K., 2006. Biol. Rhythm Res., 37: 87-110. https://doi.org/10.1080/09291010500124605[CrossRef]
- Bhattacharyya, S., Dey, R. and Maitra, S.K., 2005. Acta Zool. (Stockholm), 86: 71-79. https://doi.org/10.1111/j.1463-6395.2005.00188.x[CrossRef]
- Choi, S., Lee, C.H., Park, W., Kim, D.J. and Sohn, Y.C., 2010. Zool. Sci., 27: 24-32. https://doi.org/10.2108/zsj.27.24[CrossRef]
- Costa-Pierce, B., 2005. Urban aquaculture. CABI Publishers, Wallingford, pp. 234. https://doi.org/10.1079/9780851998299.0000[CrossRef]
- Devlin, R.H. and Nagahama, Y., 2002. Aquaculture, 208: 191-364. https://doi.org/10.1016/S0044-8486(02)00057-1[CrossRef]
- FAO, 2016. The state of world fisheries and aquaculture. Food and Agriculture Organization of the United Nations, Rome, pp. 5. http://www.fao.org/3/a-i5555e.pdf
- Kobayashi, M., Aida, K. and Stacey, N.E., 1991. Zool. Sci., 8: 389-393.
- Kokokiris, L., Mourot, B., Le Menn, F., Kentouri, M. and Fostier, A., 2000. Fish Physiol. Biochem., 23: 1-11. https://doi.org/10.1023/A:1007882807782[CrossRef]
- Leclercq, E., Taylor, J.F., Sprague, M. and Migaud, H., 2011. Aquacult. Eng., 44: 35-47. https://doi.org/10.1016/j.aquaeng.2010.12.001[CrossRef]
- Lone, K.P., Fatima, S. and Sahar, S., 2009. Pakistan J. Zool., 41: 483-494.
- Lone, K.P., Sahar, S. and Fatima, S., 2012. Pakistan J. Zool., 44: 159-172.
- Migaud, H., Davie, A. and Taylor, J.F., 2010. J. Fish Biol., 76: 27-68. https://doi.org/10.1111/j.1095-8649.2009.02500.x[CrossRef]
- Miura, C., Higashino, T. and Miura, T., 2007. Biol. Reprod., 77: 822-828. https://doi.org/10.1095/biolreprod.107.061408[CrossRef]
- Mommsen, T.P., Vijayan, M.M. and Moon, T.W., 1999. Rev. Fish Biol. Fish., 9: 211-268. https://doi.org/10.1023/A:1008924418720[CrossRef]
- Pottinger, T.G., Carrick, T.R., Hughes, S.E. and Balm, P.H.M., 1996. Gen. Comp. Endocrinol., 104: 284-295. https://doi.org/10.1006/gcen.1996.0173[CrossRef]
- Semenkova, T., Barannikova, .I, Kime, D.E., Mc Allister, B.G., Bayunova, L., Dyubin, V. and Kolmakov, N., 2002. J. appl. Ichthyol., 18: 375-381. https://doi.org/10.1046/j.1439-0426.2002.00368.x[CrossRef]
- Sivakumaran, K.P., Brown, P., Stoessel, D. and Giles, A., 2003. Environ. Biol. Fish., 68: 321-332. https://doi.org/10.1023/A:1027381304091[CrossRef]
- Song, M. and Gutzeit, H.O., 2003. Develop. Growth Differen., 45: 327-337. https://doi.org/10.1046/j.1440-169X.2003.00701.x[CrossRef]
Services
Article usage statistics
Loading…