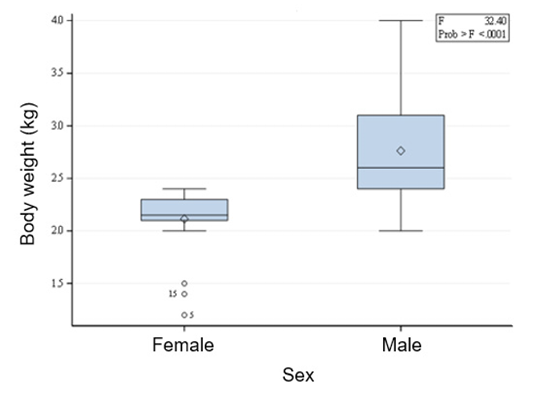
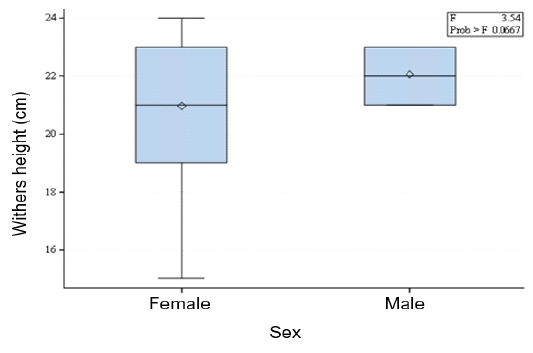
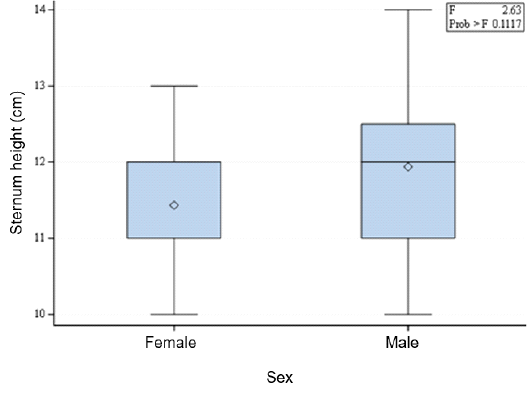
Boxplot (Figure 1) depicts the summary distribution of BW of new-born South African female and male non-descript indigenous goat kids. The findings displayed that there was a remarkably difference at (p < 0.001) probability level across both new-born South African female and male non-descript indigenous goat kids. The male animals had higher BW than the females. Moreover, the boxplot shows the minimum, 25th per-centile (first quartile), median, 75th percentile (third quartile), and maximum values of BW for both sexes. In the boxplot, female BW showed minimum values of 2.0 kg, first quartile, and median of greater than 2.0 kg, whereas the third quartile had a maximum of less than 2.5 kg, respectively. Meanwhile, the boxplot of male BW displayed minimum values of 2.0 kg, first quartile greater than 2.0 kg, median greater than 2.5 kg, third quartile greater than 3.0 kg, and the maximum less than 4.0 kg. The boxplot summary suggests that the data regarding BW in new-born South African female and male non-descript indigenous goat kids was not well distributed, it had three outliers in South African female non-descript indigenous goat kids.
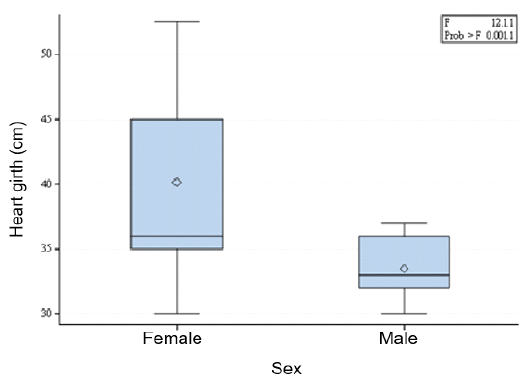
Boxplot (Figure 2) shows the summary distribution of hearth girth (HG) of new-born South African female and male non-descript indigenous goat kids. Findings showed that there was a remarkable difference at (p < 0.001) probability level across both the female and male non-descript indigenous goat kids. Females had higher HG compared with the males. Furthermore, the boxplot revealed the minimum, 25th per-centile (first quartile), median, 75th percentile (third quartile), and maximum values of HG for both sexes. In the boxplot, female HG showed minimum values of 30 cm, first quartile, and median of greater than 35 cm, whereas the third quartile had a maximum of greater than 50 cm, respectively. Meanwhile, boxplot of male HG revealed minimum values of 30 cm, first quartile greater than 30 cm, median less than 35 cm, third quartile greater than 35 cm, and the maximum less than 40 cm. The summary of boxplot suggests that the data concerning HG in new-born South African female and male non-descript indigenous goat kids was well distributed with no outliers.
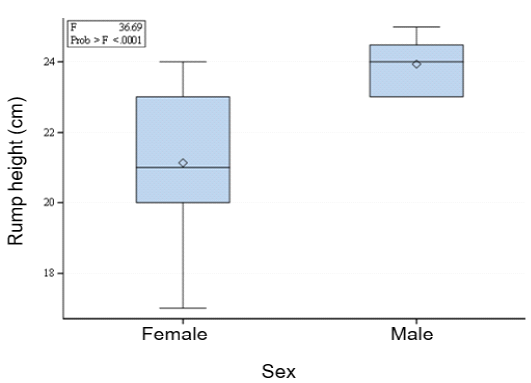
Boxplot (Figure 3) shows the summary distribution of rump height (RH) of new-born South African female and male non-descript indigenous goat kids. Results showed that there was a remarkable difference at (p < 0.001) probability level across both female and male non-descript indigenous goat kids. The male had a higher RH than the female. Furthermore, the boxplot showed the minimum, first quartile, median, third quartile, and maximum values of RH for both sexes. Female RH showed lowest values of less than 18 cm, first quartile, and median of greater than 20 cm, whereas the third quartile had a highest of greater than 24 cm, respectively. Meanwhile, the boxplot of male RH displayed first quartile values greater than 22 cm, median less than 24 cm, third quartile greater than 24 cm, and the maximum greater than 24 cm. The summary of boxplot suggests that the data concerning RH in new-born South African female and male non-descript indigenous goat kids was well distributed with no outliers.
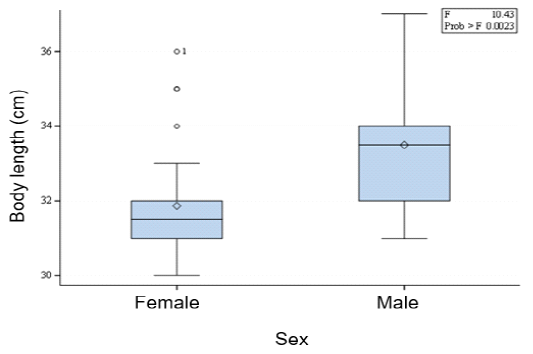
Boxplot (Figure 4) shows the summary distribution of body length (BL) of new-born South African female and male non-descript indigenous goat kids. Results indicate that there was a remarkable difference at (p < 0.001) probability level across both female and male non-descript indigenous goat kids. The male had a higher BL than the female. Moreover, the boxplot revealed the minimum, first quartile, median, third quartile, and maximum values of BL for both sexes. In the boxplot, female RH showed lowest values of less than 30 cm, first quartile, and median of greater than 30 cm, whereas the third quartile had a highest of greater than 32 cm, respectively. Meanwhile, the male boxplot of BL revealed minimum values greater than 30 cm, first quartile greater than 32 cm, median less than 34 cm, third quartile greater than 32 cm, and the maximum greater than 36 cm. The summary of boxplot suggests that the data regarding BL in new-born South African female and male non-descript indigenous goat kids was not well distributed, as it had three outliers in the female goat kids.
Boxplot (Figure 5) shows the summary distribution of withers height (WH) of new-born South African female and male non-descript indigenous goat kids. Results displayed that there was a remarkable difference at (p < 0.001) probability level across both female and male goat kids. Females were found to have higher WH than the males. Furthermore, the boxplot displayed the minimum, first quartile, median, third quartile, and maximum values of WH for both sexes. In the boxplot, female WH showed lowest values of less than 16 cm, first quartile, and median of greater than 20 cm, whereas the third quartile had a highest of less than 24 cm, respectively. Meanwhile, boxplot of male WH revealed first quartile values greater than 20 cm, median of 22 cm and third quartile greater than 22 cm. The summary of boxplot suggests that the data regarding WH in new-born South African female and male non-descript indigenous goat kids was well distributed without outliers.
Boxplot (Figure 6) shows the summary distribution of sternum height (SH) of new-born South African female and male non-descript indigenous goat kids. Results indicate that there was a remarkable difference at (p < 0.001) probability level across both new-born female and male non-descript indigenous goat kids. Males were found to have higher SH when compared with the female. Furthermore, the boxplot showed the minimum, first quartile, median, third quartile, and maximum values of SH for both sexes. In the boxplot, female SH showed lowest values of less than 10 cm, first quartile, and median of greater than 11 cm, whereas the third quartile had a highest of greater than 13 cm, respectively. Meanwhile, the boxplot of male SH revealed the lowest values of less than 10 cm, first quartile greater than 11 cm, median less than 13 cm, third quartile greater than 12 cm, and the highest less than 14 cm. The summary of boxplot suggests that the data regarding SH in new-born South African female and male non-descript indigenous goat kids was well distributed without outliers.
Descriptive statistics of the body weight (BW) and morphological traits of new-born South African non-descript indigenous goat kids are denoted in Table 1. The BW of average numerical values of new-born male goat kids (2.76 kg ± 0.12) was higher than those of new-born female goat kids. However, new-born female goat kids had higher mean numerical values in all traits (HG, RH, BL, WH and SH) than the new-born male goat kids. The coefficient of variation (CV) (%) was calculated by dividing the mean with the standard deviation. The findings displayed a range of 3.22%−18.02% in new born male goat kids, and 4.64−18.50% in new-born female goat kids.
Table 1: Descriptive statistics of measured traits.
BW: Body Weight; HG: Heart Girth; RH: Rump Height; BL: Body Length; WH: Withers Height; SH: Sternum Height; SE: Standard Error; CV: Coefficient of Variance.