
Livestock is a primary source of income for small dairy farmers in developing countries. Dairy animals fed with a fodder containing a balanced nitrogen contents produce high quality milk. Excess use of nitrogen fertilizers in the soil cause excess accumulation of nitrates in fodder, which is the main source of nitrate poisoning in dairy animals. In the present study nitrate contents in fodder crops, viz., Sorghum bicolor (Jowar), Pennisetum glaucum (Bajra), Zea mays (Makai), Avena sativa (Jai), Brassica rapa (Shaljam) and Brassica Campestris (Sarson) were estimated twice a day i.e. early morning and afternoon. The fodder samples were collected from different villages of Okara, Pattoki and Ravi areas of the Province Punjab. Nitrate contents of different parts of the fodder plants were estimated qualitatively through the Diphenylamine Filed Test (DFT) and quantitatively by spectrophotometry. The nitrate levels were highest in Jowar, followed by Jai, Shaljam, Makai, Bajra and Sarson. The concentrations were lower in the afternoon in the leaves and in mature crops as compared to stem parts, immature plants, and in samples collected from plants during morning hours. The nitrate concentration was lower in samples collected from Ravi area, as compared to samples collected from villages of Pattoki and Okara. Blood samples were collected from animals feeding on above fodders; Spectrophotometry analysis of blood samples from these animals showed abnormally high levels of nitrite. In conclusion, nitrate contents were higher (>5000 ppm) in stem parts of common livestock fodder harvested in early morning and therefore, high level of nitrite found in blood of animals fed with the fodder containing high nitrate contents. This high level of nitrates in fodder crops constitutes a threat to the health and productivity of dairy animals.
Research Article · Volume 51, Issue 1, 16 December 2018 · Open Access
Influence of Nitrogen Fertilizer on Nitrate Contents of Plants: A Prospective Aspect of Nitrate Poisoning in Dairy Animals
· · · · · · · · ·
Affiliations & Notes ⌄
- 1Department of Clinical Medicine and Surgery, University of Veterinary and Animal Sciences, Lahore-54000 2Department of Epidemiology and Public Health, University of Veterinary and Animal Sciences, Lahore-54000 3Department of Microbiology, University of Veterinary and Animal Sciences, Lahore-54000 4Department of Animal Nutrition, University of Veterinary and Animal Sciences, Lahore-54000 5Department of Livestock Production, University of Veterinary and Animal Sciences, Lahore-54000 6College of Ve
Article Info ⌄
- Journal:
- Pakistan Journal of Zoology
- Published:
- 16 December 2018

From the article
- The nitrate contents were highest in Sorghum bicolor (P0.05).
- High nitrate level in plants is associated with frequent or heavy use of nitrogen fertilizers in the field, maturity of the plants, parts of plants (stems) and harvesting time.
- Livestock fed on high nitrate content fodder increases blood nitrite levels.
- Fertility program focused on educating farmers on fodder crop nitrate contents would be valuable in reducing nitrate toxicity rates in livestock populations.
Selected from the article's own text.
Abstract
Introduction
Nitrate is a normal constituent of plants and is primary source of nitrogen in the soil. All plants contain some nitrates, but excessive amounts are likely to occur in forage which has been grown under conditions of excessive fertilization and/or stress . Any stress conditions which cause an abrupt decrease in plant growth may contribute to plant nitrate accumulation, even with a normal nitrogen supply. The buildup of nitrates in the soil brought on by excessive fertilization with poultry litter or animal manure is also a common cause of nitrate accumulation in plants . The application of excessive nitrogen (N) fertilizer on agricultural land to improve both quality and yield of crops has markedly increased around the world . Occasionally, plants accumulate excessive amounts of nitrate, resulting in high livestock mortality rates . Outbreaks of nitrate toxicity occur in farm animals throughout the world, due to consumption of fodder containing high amounts of nitrate.
In many parts of the world, forage derived from crops after grain harvest is often fed to cattle, buffaloes, sheep and goats . During cultivation of green fodder especially in cereal crops like Maize (Makai), Sorghum (Jowar) and Oats (Jai), the nitrogen fertilizers are applied, therefore the level of unutilized nitrates on the surface of plant serves as a rich source of nitrate in animal diet . Many animal species are susceptible to nitrate and nitrite poisoning; but cattle are considered as most susceptible because of the rapid conversion of nitrate to the more toxic nitrite form by rumen microorganisms ; ; .
Nitrate itself is not toxic to livestock but in ruminants nitrate is reduced to nitrite by rumen microbes which utilize this as a nitrogenous source by converting it into ammonia . Under normal circumstances, nitrate (NO3) is reduced in the rumen in a series of steps to nitrite (NO2), ammonia (NH3), and eventually to microbial proteins . Nitrite builds up and is absorbed into blood stream, combining with the ferrous ion (Fe +2) of hemoglobin (Hb) to form met-hemoglobin (met-Hb). Met-Hb is a poor transporter of oxygen in the body and animal suffers from oxygen deficiency . Sudden death, abortion, decreased milk production, interference with conversion of carotene to vitamin A, and decreased growth rates have been attributed to nitrate toxicity .
Nitrate toxicity is a serious problem worldwide, and recent studies have indicated that nitrate content in ground and well water is increasing ; ; , creating a health hazard to both animals and humans. The most common cause of nitrate toxicity in farm animals is the consumption of feed or water containing high levels of nitrates . Nitrate levels higher than 0.5% (5000 ppm) in animal feed are potentially deleterious to the health and productivity of ruminants. Nitrate concentrations in common livestock fodder have not been studied in Pakistan and the guidelines found today in literature are based on limited research data and have not been updated to more recent findings on nutrition and physiology. Therefore the present study was designed (i) to determine the nitrate contents in commonly used livestock fodder, (ii) to evaluate the effect of harvesting time (morning and afternoon) on nitrate level of the plants, (iii) to calculate the accumulation of nitrate contents in different growth stages and parts of the plant body, (iv) to determine the effect of excessive use of nitrogen fertilizer on nitrate accumulation in plants in different areas, and (v) to determine the nitrite contents in blood of dairy animals.
Materials and methods
Sample collection
Plant samples (n=600) were collected from different villages of Pattoki, Okara and Ravi Campus, University of Veterinary and Animal Sciences (UVAS), Lahore-Punjab, Pakistan. 100 samples of each fodder crops viz. Sorghum bicolor (Jowar), Pennisetum glaucum (Bajra), Zea mays (Makai), Avena sativa (Jai), Brassica rapa (Shaljam) and Brassica campestris (Sarson) were collected. To evaluate the effect of harvesting time on nitrate level of the plants, 50% of the samples were collected in the morning while 50% were harvested in the afternoon.
Diphenylamine field test (DFT)
Screening of nitrate levels of different fodder plants was performed using diphenylamine field test (DFT) as described by Housholder et al. (1966). This method is used to screen for the presence and the levels of nitrates in livestock fodder. This solution was prepared by dissolving 0.5g Diphenylamine (SIGMA-ALDRICH) in 20 ml distilled water. Concentrate sulfuric acid (Merck, Germany) was added to make final volume of 100 ml. The solution was left to cool at room temperature. The solution was stored in dark brown glass bottle to prevent light exposure during field use. Stems of the plants were cut in longitudinal sections and 1-2 drops of diphenylamine indicator solution were added using a glass dropper. Positive samples show intense blue color within 10 seconds.
Estimation of nitrates
The fodder plants positive (>5000 ppm) to DFT were subjected for further quantitative analysis using spectrophotometer (UV-1700 VIS spectrophotometer of SHIMADZU Company). Nitrate levels in plant materials were determined spectrophotometerically using the powder mixture (Bray’s indicator) as described by Woolley et al. (1960). The Bray’s indicator is mixture of 100gm of barium sulfate, 75gm of citric acid, 10 gm of manganese sulfate dihydrate, 4gm of sulfanilic acid, 2gm of powdered zinc, and 2gm of 1-naphthylamine. 50gm of barium sulfate was ground with 2gm of 1-naphthylamine and 10gm of manganese sulfate dehydrate. Another 50gm barium sulfate was ground and mixed with 2gm zinc powder, 75gm citric acid and 4gm sulfanilic acid; all ingredients were mixed together and stored in dark brown glass bottle. This powder mixture was used for spectrophotometric analysis. For nitrite estimation, Brays indicator powder was used without zinc and manganese sulphate.
Nitrate contents of different parts of the plant body including stem and leaves were also determined through a spectrophotometer. A calibration curve for nitrate was made first using known standards (0.5, 1, 1.5, 2, 2.5, 3, 3.5, 4, 4.5 and 5 mg/ml) of nitrate and absorbance was measured at a wave length of 520 nm. To minimize error, micropipettes (Socorex Swiss) were used to measure the volumes.
The total Nitrate contents in ppm (mg/kg) were calculated by the following equation:
y = 0.0478x + 0.3263
Where x is unknown concentration and y is unknown absorbance.
x (mg/ml) = y - 0.3263/0.0478

Determination of nitrite in blood samples
A total of 300 blood samples were collected from cattle and buffaloes (n=150 each) from the same study area with the history of recent feeding/ grazing on the fodder containing high nitrate contents.
The calibration curve was linear (R2 = 0.9994) in the range 0.1-1 μg NO2/mL and was described by the following equation:
y = 0.1805x+ 0.0785
Statistical analysis
The data were analyzed by using one way and two way analysis of variance (ANOVA) and different group means were compared by Dunken Multiple Range Test (DMRT) and at 95% level of significance. A statistical software package “SPSS 20.00” was used for statistical analysis.
Results
All samples were positive to DFT. On pouring diphenylamine solution, positive plant samples showed intense blue color within 10 seconds as shown in Figure 1.
The mean values of overall nitrate contents were determined in common livestock fodder crops. The nitrate contents were highest in Sorghum bicolor (P<0.05), followed by Avena sativa and Brassica campestris while the lowest in Brassica rapa. The NO3 contents of Pennisetum glaucum, Zea mays and Brassica rapa were non significantly different from each other (P>0.05). A significant difference (P<0.05) was observed among NO3 contents of Sorghum bicolor, Pennisetum glaucum, Avena sativa and Brassica campestris. The NO3 concentrations of Sorghum bicolor , Avena sativa and Brassica campestris were significantly higher (P<0.05) than Pennisetum glaucum, Zea mays and Brassica rapa but the NO3 contents of Brassica campestris were significantly higher than Pennisetum glaucum, Zea mays and Brassica rapa (Table I).
There was a significant difference (P<0.05) in nitrate contents of morning and afternoon samples of Sorghum bicolor, Pennisetum glaucum, Zea mays, Avena sativa, Brassica campestris and Brassica rapa (Table I).
Table I.- Overall nitrate (NO3) contents in various plant species in morning and afternoon.
| Plant species | NO3 contents (ppm) (n=100) | Time of collection and NO3 contents | |
| Morning (n=50) | Afternoon (n=50) | ||
| Sorghum bicolor (Jowar) | 8995.1 ±268.86 a | 9469.6±387.24a | 8520.6±364.62b |
| Pennisetum glaucum (Bajra) | 6762.3±154.21 b | 6900.8±199.59 a | 6623.7±235.51b |
| Zea mays (Makai) | 6938.5±154.73 bc | 7119.4±203.11 a | 6757.6±232.70 b |
| Avena sativa (Jai) | 8019.0±161.54 d | 8433.2±246.95 a | 7604.8±193.54 b |
| Brassica campestris (Sarson) | 7371.5±155.08 ce | 7757.2±236.73 a | 6985.2±187.28b |
| Brassica rapa (Shaljam) | 6522.9±139.96 bcf | 6652.4±197.14 a | 6393.4±199.01b |
Values are Mean±SE. Means in column 1 bearing different superscript letters are statistically significantly different (P<0.05). Means row-wise in column 2 & 3 bearing different superscript letters are statistically significantly different.
Table II.- Overall nitrate (NO3) contents in various plant species in different areas.
| Plant species | Different areas mean nitrate (ppm) | ||
| Ravi campus UVAS (n=30) | Villages of Pattoki (n=40) | Villages of Okara (n=30) | |
| Sorghum bicolor (Jowar) | 7480.33±458.30a | 9737.25±342.70b | 9520.33±536.63bc |
| Pennisetum glaucum (Bajra) | 5622.67±201.22a | 7359.75±191.68 b | 7313.67±224.21bc |
| Zea mays (Makai) | 5697.73±225.36a | 7443.75±211.2 b | 7505.67±256.67bc |
| Avena sativa (Jai) | 7278.33±221.03a | 8268.25±191.31b | 8427.33±393.62bc |
| Brassica rapa (Shaljam) | 5249.67±178.48a | 7112±192.09 b | 7010.67±211.72bc |
| Brassica campestris (Sarson) | 6584.03±295.67a | 7653.75±222.85 b | 7782.67±257.56bc |
Values are Mean±SE. Means in the same row bearing different superscript letters (a, b, c) are statistically significantly different (P<0.05).
The nitrate concentrations were significantly higher (P< 0.05) in samples collected form villages of Pattoki and Okara as compared to Ravi campus UVAS, Lahore. When compared statistically, a non-significant difference was also observed in the fodder samples of Pattoki and Okara villages as shown in Table II.
The nitrate levels of plants at different heights were statistically significant (P<0.05). All plant species showed a gradual increase in the nitrate contents with the increase in height of plants and vice versa. Highest nitrate contents were detected in the plants with a height range of 76-90cm (Sorghum bicolor) and lowest with a height of 201cm and above as shown in Figure 2.
A significant difference (P<0.05) in nitrate contents of leaves and stem of all plant species was found. The nitrate contents in leaves of all plants species were significantly higher (P<0.05) than the stems as shown in Table III.
Table III.- Overall Nitrate contents (mg/kg) in leaves and stem of different plant species.
| Plant species | Plant part and NO3 contents | |
| Stem (n=100) | Leaf (n=100) | |
| Sorghum bicolor | 10412.8±205.23a | 7577.4±409.81b |
| Pennisetum glaucum | 7779.2±150.98 a | 5745.3±176.30 b |
| Zea mays | 7847.8±169.64 a | 6029.2±184.98 b |
| Avena sativa | 8778.4±238.85 a | 7577.4±409.81 b |
| Brassica rapa | 7076±180.15 a | 5969.8±184.96 b |
| Brassica campestris | 8039±232.93 a | 6704±157.33 b |
Values are Mean±SE. Means in the same row bearing different superscript letters (a, b) are statistically significantly different (P<0.05).
The blood NO2 values in cattle and buffaloes when fed different varieties of fodder have been shown in Table IV. Statistically the cattle and buffalo feeding on S. bicolor have significantly higher blood NO2 values than those feeding on P. glaucum, Z. mays, or B. rapa. On the other hand, no significant difference (P>0.05) was found in blood NO2 levels of cattle and buffaloes feeding on , P. glaucum, Z. mays, A. sativa, B. campestris and B. rapa.
Table IV.- Blood nitrite level (µg/ml) as affected by type of fodder in different animals.
| Fodder | n | Blood NO2 conc. |
| Cattle | ||
| Sorghum bicolor | 40 | 0.67±0.08a |
| Pennisetum glaucum | 23 | 0.39±0.04b |
| Zea mays | 32 | 0.43±0.04bc |
| Avena sativa | 25 | 0.53±0.07abcd |
| Brassica campestris | 18 | 0.45±0.09bcde |
| Brassica rapa | 12 | 0.31±0.05bcdf |
| Buffaloes | ||
| Sorghum bicolor | 38 | 0.63±0.08a |
| Pennisetum glaucum | 22 | 0.36±0.04b |
| Zea mays | 35 | 0.42±0.04bc |
| Avena sativa | 30 | 0.50±0.05abcd |
| Brassica campestris | 15 | 0.48±0.09abcde |
| Brassica rapa | 10 | 0.29±0.05bcdef |
Column means with different superscript letters are significantly different (P<0.05).
Discussion
Frequent use of nitrogen fertilizers in the soil causes nitrate accumulation in the plants . The climate of central Punjab is suitable for the cultivation of these fodder crops which are commonly used in animal feed. Through convenient sampling method, fodder samples (n=100 each plant species) were collected. The plants were subjected to DFT for detection of nitrate levels. DFT is the recommended qualitative test for nitrate detection in the field. The present DFT results are linked with the quantitative analysis as observed by Khanal et al. (2008) and Lemaire et al., (2008).
In the present findings, nitrate contents are highest in Sorghum bicolor (8995.1±26886) and lowest in Brassica rapa (6522.9±139.96) that is also higher than safe limit (<5000 ppm) . These results revealed that Sorghum bicolor and Brassica rapa are the natural accumulators of nitrate. In literature, it was found that these plants are most notorious accumulators of nitrate . There were no drought conditions when these samples were collected. These findings indicate that nitrate contents can vary among plant species. The nitrate contents of Pennisetum glaucum, Zea mays, Avena sativa, and Brassica campestris are also detected significantly higher than the safe limit for the animal feed because there was excess use of nitrogen fertilizer/animal manure/poultry manure in the fields where these plants were cultivated and the same findings were observed in other recent studies ; .
The nitrate levels were higher in different fodder crops harvested during the morning than the afternoon because nitrate reductase activity in leaves often decreases as sun arises ; . This “afternoon depression” of nitrate reductase may reflect its degradation and/or a block in its synthesis, and is usually paralleled by decreasing nitrate concentrations in the leaves. Anjana et al. (2006) have also reported lowest nitrate concentration at noon on a sunny day in spinach leaves.
Nitrate concentration was significantly higher in fodder plants collected from villages of Pattoki and Okara as compared to Ravi campus UVAS, Lahore. The reason could be the presence of excess nitrogen in soil due to application of nitrogen fertilizers (urea, ammonium nitrate, animal manure), to obtain higher yields of crops. However, in the present study the effect of environmental factors was neutralized, as climatic conditions were the same in villages of Pattoki, Okara and Ravi campus UVAS and the same findings were correlated with those of Sidhu et al. (2011).
Nitrate levels in the fodder plants decreases as the plants mature. It showed that distribution of nitrate varies with the age of plant. This might be due to the distribution of some nitrate in the grains at maturity ; ; . When plants mature there is decrease uptake or high enzyme activity that ultimately converts high nitrate contents into intermediate compounds which are readily taken up by the plants. The results confirmed the previous reports of reduced nitrate levels as plants mature .
Nitrate contents are higher in stems of numerous fodder crops than in leaves, as those parts which are closer to the ground contain more nitrates; roots and stem typically have higher nitrate levels, followed by leaves ; ; .
Cattle and buffalo grazing on S. bicolor showed significantly higher blood NO2 levels than those fed P. glaucum, Z. mays, or B. rapa. A non- significant difference was found between animals fed P. glaucum, Z. mays, A. sativa, B. campestris and B. rapa. Al-Qudah et al. (2009) reported increased nitrite levels in plasma (1.6±0.4mmol) for livestock, feeding on grass and water nitrite levels of1.48×103 ppm and 1.7×10³ ppm, respectively and similar findings were reported by Oruc et al. (2010).
Conclusions
High nitrate level in plants is associated with frequent or heavy use of nitrogen fertilizers in the field, maturity of the plants, parts of plants (stems) and harvesting time. Livestock fed on high nitrate content fodder increases blood nitrite levels. Present fodders grown in heavily fertilized soils are commonly used for dairy animals in the local area, as a result, high nitrate contents cause nitrate poisoning, affect livestock productivity. Fertility program focused on educating farmers on fodder crop nitrate contents would be valuable in reducing nitrate toxicity rates in livestock populations. There is an urgent need to develop a systematic testing program for determining soil and water nitrate content throughout Pakistan and to educate farmers regarding the consequences regarding excessive use of fertilizers.
Acknowledgement
Authors are thankful to the staff of Clinical Medicine Department for their co-operation.
Statement of conflict of interest
Authors declare that they have no conflict of interest.
Figures
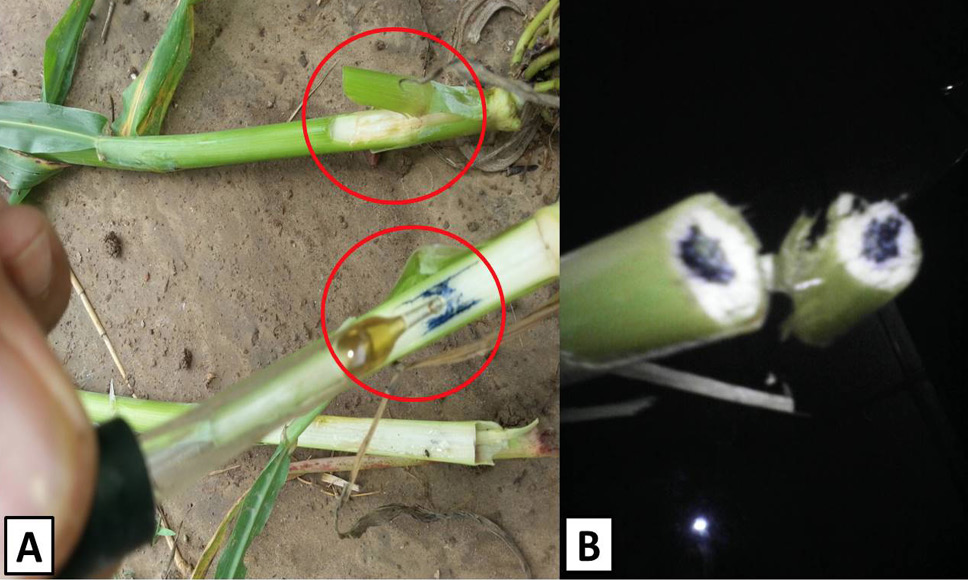
A, positive and negative DFT in stems of Avena sativa (Jai); B, stems of Zea mays (Makai) showed DFT positive.
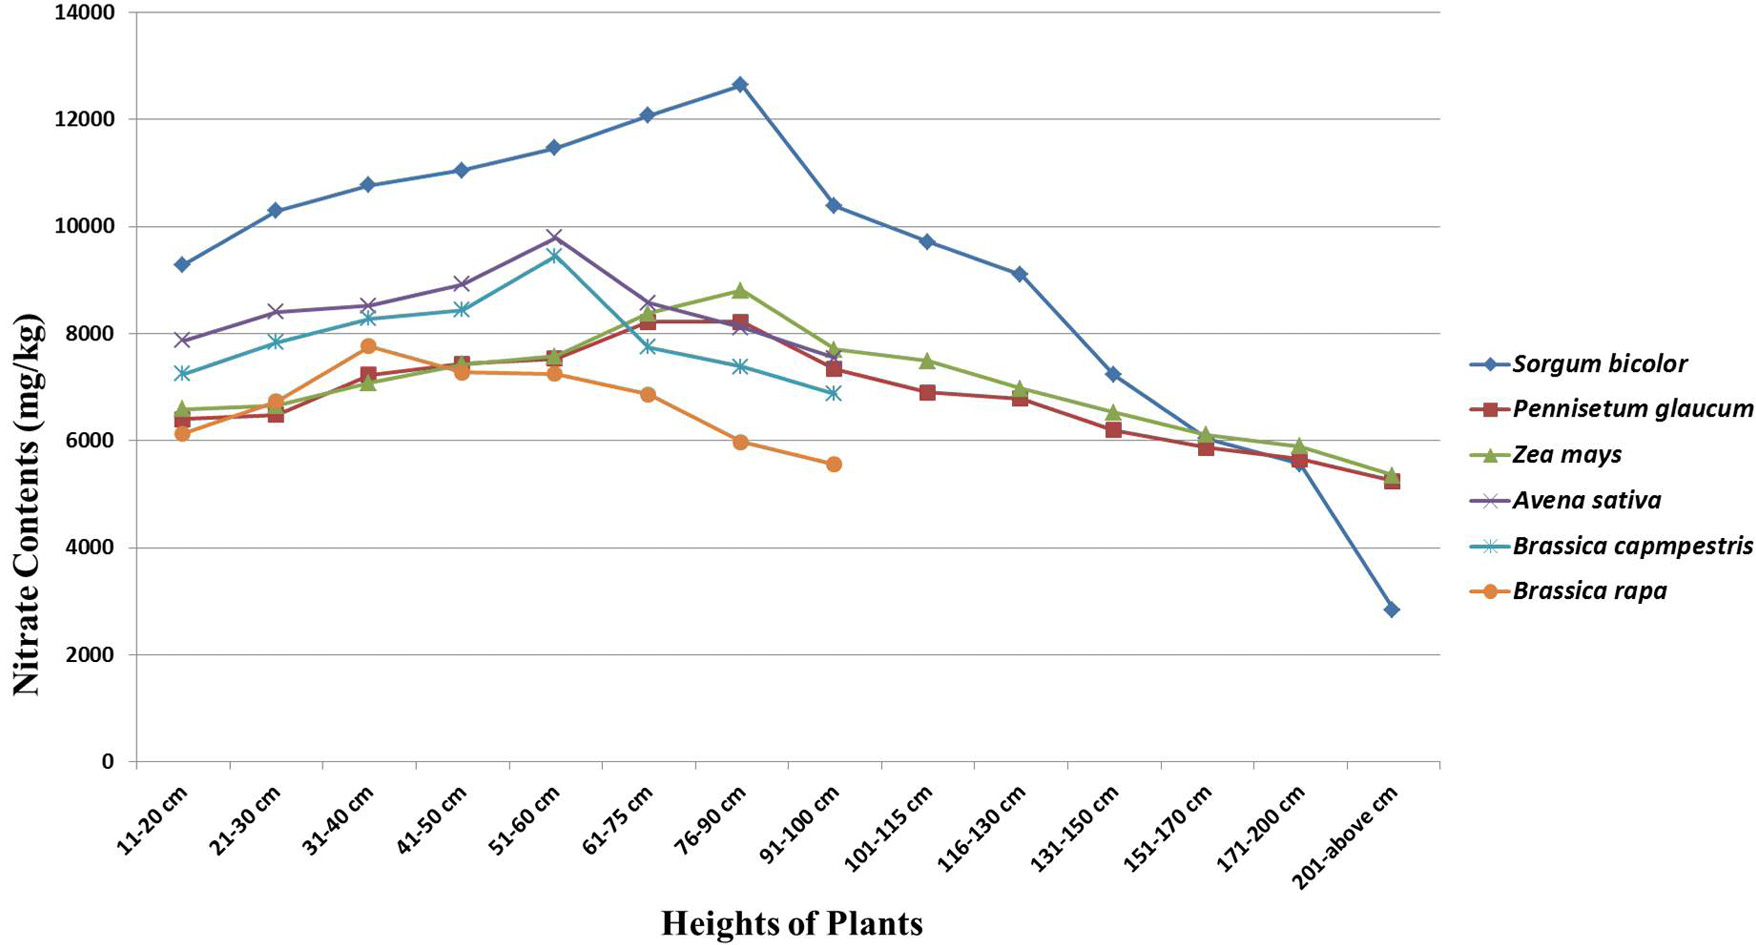
Nitrate contents (mg/kg) of fodder plants at different heights.
References
- Al-Qudah, K., Rousan, L. and Ereifej, K., 2009. Nitrate/nitrite poisoning in dairy cattle associated with consumption of forages irrigated with municipally treated wastewater. Toxicol. environ. Chem., 91: 163-170. https://doi.org/10.1080/02772240802051205[CrossRef]
- Anjana, S.U., Iqbal, M. and Abrol, Y., 2006. Are nitrate concentrations in leafy vegetables within safe limits. Curr. Sci., 90: 58-64.
- Basso, B. and Ritchie, J.T., 2005. Impact of compost, manure and inorganic fertilizer on nitrate leaching and yield for a 6-year maize–alfalfa rotation in Michigan. Agric. Ecosyst. Environ., 108: 329-341. https://doi.org/10.1016/j.agee.2005.01.011[CrossRef]
- Beland, G., Akeson, W. and Manglitz, G., 1970. Influence of plant maturity and plant part on nitrate content of the sweetclover weevil-resistant species Melilotus infesta. J. econ. Ent., 63: 1037-1039.
- Bloom, A.J., Asensio, J.S.R., Randall, L., Rachmilevitch, S., Cousins, A.B. and Carlisle, E.A., 2012. CO2 enrichment inhibits shoot nitrate assimilation in C3 but not C4 plants and slows growth under nitrate in C3 plants. Ecology, 93: 355-367. https://doi.org/10.1890/11-0485.1[CrossRef]
- Burow, K.R., Nolan, B.T., Rupert, M.G. and Dubrovsky, N.M., 2010. Nitrate in groundwater of the United States, 1991−2003. Environ. Sci. Technol., 44: 4988-4997. https://doi.org/10.1021/es100546y[CrossRef]
- Devendra, C. and Sevilla, C., 2002. Availability and use of feed resources in crop–animal systems in Asia. Agric. Syst., 71: 59-73. https://doi.org/10.1016/S0308-521X(01)00043-9[CrossRef]
- Housholder, G., Dollahite, J. and Hulse, R., 1966. Diphenylamine for the diagnosis of nitrate intoxication. J. Am. Vet. Med. Assoc., 148: 662-668.
- Kaiser, W.M., Weiner, H., Kandlbinder, A., Tsai, C.B., Rockel, P., Sonoda, M. and Planchet, E., 2002. Modulation of nitrate reductase: Some new insights, an unusual case and a potentially important side reaction. J. exp. Bot., 53: 875-882. https://doi.org/10.1093/jexbot/53.370.875[CrossRef]
- Kamra, D.N., Agarwal, N. and Chaudhary, L., 2015. Nitrate/nitrite toxicity and possibilities of their use in ruminant diet. Rumen Microbiology: From Evolution to Revolution. Springer, pp. 343-353. https://doi.org/10.1007/978-81-322-2401-3_23[CrossRef]
- Khanal, D.R., Self, J., Hamar, D.W., Knight, A.P., 2008. Rapid field test for detecting nitrate concentrations in forages. Colorado State University, Fort Collins, Colorado, U.S.A.
- Knight, A.P. and Richard, G., 2001. A guide to plant poisoning of animals in North America. CRC Press, Boca Raton, Florida.
- Lee, C. and Beauchemin, K.A., 2014. A review of feeding supplementary nitrate to ruminant animals: Nitrate toxicity, methane emissions, and production performance. Canadian J. Anim. Sci., 94: 557-570. https://doi.org/10.4141/cjas-2014-069[CrossRef]
- Lemaire, G., Jeuffroy, M.H. and Gastal, F., 2008. Diagnosis tool for plant and crop N status in vegetative stage: Theory and practices for crop N management. Eur. J. Agron., 28: 614-624. https://doi.org/10.1016/j.eja.2008.01.005[CrossRef]
- Malagoli, P., Laine, P., Rossato, L. and Ourry, A., 2005. Dynamics of nitrogen uptake and mobilization in field-grown winter oilseed rape (Brassica napus) from stem extension to harvest: I. Global N flows between vegetative and reproductive tissues in relation to leaf fall and their residual N. Annls. Bot., 95: 853-861. https://doi.org/10.1093/aob/mci091[CrossRef]
- Malhi, S., Gill, K., McCartney, D. and Malmgren, R., 2004. Fertilizer management of forage crops in the Canadian Great Plains. Rec. Res. Develop. Crop Sci., 1: 237-271.
- Man, H.M., Abd-El Baki, G.K., Stegmann, P., Weiner, H. and Kaiser, W.M., 1999. The activation state of nitrate reductase is not always correlated with total nitrate reductase activity in leaves. Plant, 209: 462-468. https://doi.org/10.1007/s004250050749[CrossRef]
- Manassaram, D.M., Backer, L.C. and Moll, D.M., 2007. A review of nitrates in drinking water: Maternal exposure and adverse reproductive and developmental outcomes. Environ. Hlth. Perspect, 114: 320-327. https://doi.org/10.1289/ehp.8407[CrossRef]
- Masoero, F., Gallo, A., Zanfi, C., Giuberti, G. and Spanghero, M., 2011. Effect of nitrogen fertilization on chemical composition and rumen fermentation of different parts of plants of three corn hybrids. Anim. Feed Sci.Technol., 164: 207-216. https://doi.org/10.1016/j.anifeedsci.2011.02.001[CrossRef]
- McIlwain, P. and Schipper, I., 1963. Toxicity of nitrate nitrogen to cattle. J. Am. Vet. med. Assoc., 142: 502-505.
- Mickelson, S., See, D., Meyer, F.D., Garner, J.P., Foster, C.R., Blake, T.K. and Fischer, A.M., 2003. Mapping of QTL associated with nitrogen storage and remobilization in barley (Hordeum vulgare L.) leaves. J. exp. Bot., 54: 801-812. https://doi.org/10.1093/jxb/erg084[CrossRef]
- O’Hara, P. and Fraser, A., 1975. Nitrate poisoning in cattle grazing crops. N.Z. Vet. J., 23: 45-53. https://doi.org/10.1080/00480169.1975.34192[CrossRef]
- Oruc, H.H., Akkoc, A., Uzunoglu, I. and Kennerman, E., 2010. Nitrate poisoning in horses associated with ingestion of forage and alfalfa. J. Equin. Vet. Sci., 30: 159-162. https://doi.org/10.1016/j.jevs.2010.01.055[CrossRef]
- Ozmen, O., Mor, F. and Ayhan, U., 2003. Nitrate poisoning in cattle fed Chenopodium album hay. Vet. Hum. Toxicol., 45: 83-84.
- Ozmen, O., Mor, F., Sahinduran, S. and Unsal, A., 2005. Pathological and toxicological investigations of chronic nitrate poisoning in cattle. Toxicol. environ. Chem., 87: 99-106. https://doi.org/10.1080/02772240400007104[CrossRef]
- Qiu, W., Wang, Z., Huang, C., Chen, B. and Yang, R., 2014. Nitrate accumulation in leafy vegetables and its relationship with water. J. Soil Sci. Pl. Nutr., 14: 761-768. https://doi.org/10.4067/S0718-95162014005000061[CrossRef]
- Sekhon, G., 1995. Fertilizer-N use efficiency and nitrate pollution of groundwater in developing countries. J. Contam. Hydrol., 20: 167-184. https://doi.org/10.1016/0169-7722(95)00067-4[CrossRef]
- Sidhu, P., Bedi, G., Meenakshi, V.M., Sharma, S., Sandhu, K. and Gupta, M., 2011. Evaluation of factors contributing to excessive nitrate accumulation in fodder crops leading to ill-health in dairy animals. Toxicol. Int., 18: 22-28. https://doi.org/10.4103/0971-6580.75848[CrossRef]
- Soetan, K., Olaiya, C. and Oyewole, O., 2010. The importance of mineral elements for humans, domestic animals and plants-A review. Afri. J. Fd. Sci., 4: 200-222.
- Soomro, F., Rafique, T., Michalski, G., Ali, S.A., Naseem, S. and Khan, M.U., 2017. Occurrence and delineation of high nitrate contamination in the groundwater of Mithi sub-district, Thar Desert, Pakistan. Environ. Earth Sci., 76: 355-362. https://doi.org/10.1007/s12665-017-6663-0[CrossRef]
- Tokarnia, C.H., Döbereiner, J. and Peixoto, P.V., 2002. Poisonous plants affecting livestock in Brazil. Toxicon, 40: 1635-1660. https://doi.org/10.1016/S0041-0101(02)00239-8[CrossRef]
- Ward, M.H., Kilfoy, B.A., Weyer, P.J., Anderson, K.E., Folsom, A.R. and Cerhan, J.R., 2010. Nitrate intake and the risk of thyroid cancer and thyroid disease. Epidemiology, 21: 389-394. https://doi.org/10.1097/EDE.0b013e3181d6201d[CrossRef]
- Westcott, M., Cash, S., Jacobsen, J., Carlson, G. and Welty, L., 1998. Sap analysis for diagnosis of nitrate accumulation in cereal forages. Commun. Soil Sci. Pl. Anal., 29: 1355-1363. https://doi.org/10.1080/00103629809370032[CrossRef]
- Woolley, J., Hicks, G. and Hageman, R., 1960. Plant analyses, rapid determination of nitrate and nitrite in plant material. J. Agric. Fd. Chem., 8: 481-482. https://doi.org/10.1021/jf60112a016[CrossRef]
Services
Article usage statistics
Loading…