Research Article · Volume 12, Issue 5, 3 March 2024 · Open Access
In Tuberculous Cattle Transiting Early Peripartum Period Specific In Vitro PBMC Stimulation Induces an Increase of CD14 Expressing Cells, B B2 Cells, and CD25 Cells with Half IFNγ Production
· · · · · · ·
Affiliations & Notes ⌄
1Sanidad Animal y Medicina Preventiva (SAMP), Facultad Ciencias Veterinarias (FCV), Centro de Investigación Veterinaria de Tandil (CIVETAN), Universidad Nacional del Centro de la Provincia de Buenos Aires (UNCPBA) CICPBA, CONICET, Pinto 399, Tandil, Buenos Aires, Argentina
2Instituto de Investigaciones Biomédicas en Retrovirus y SIDA, Facultad de Medicina, Universidad de Buenos Aires, Paraguay 2155, Ciudad Autónoma de Buenos Aires, Argentina
3Instituto de Agrobiotecnología y Biología Molecular (IABIMO), INTA-CONICET, Dr. Nicolás Repetto y De Los Reseros S/Nº B1686IGC, Hurlingham, Buenos Aires, Argentina
4Estación Experimental Agropecuaria Balcarce, Instituto Nacional de Tecnología Agropecuaria, Ruta 226 Km 73.5, Balcarce, Argentina
5SAMP, FCV, CIVETAN, UNCPBA, CICPBA, CONICET, Pinto 399, Tandil, Buenos Aires, Argentina
6Veterinary Microbiology and Pathology Department, College of Veterinary Medicine, Washington State University, Pullmann, WA, USA. *Correspondence | María Julia Traversa, Sanidad Animal y Medicina Preventiva (SAMP), Facultad Ciencias Veterinarias (FCV), Centro de Investigación Veterinaria de Tandil (CIVETAN), Universidad Nacional del Centro de la Provincia de Buenos Aires (UNCPBA) CICPBA, CONICET, Pinto 399, Tandil, Buenos Aires, Argentina
Regarding the processing and presentation of the antigen, CD14 expressing cells increased significantly in both PPDb study groups and B B2 cells increased significantly in PPDbEPPp study group.
B B2 cells from cows in PPDbEPPp displayed a statistically significant response to PPDb stimuli (p=0.004) (Figure 2C) from a mean resting value of 8.97% to a mean stimulated of 24.92% (Table 3).
After PPDb stimulation, the proportion of CD14 expressing cells increased significantly in both study groups of PPDb reactors, although they had lower resting values.
Results from this study suggest that in naturally M. bovis infected dairy cows, the early peripartum period might not influence the presentation of PPDb by CD14 expressing cells, and might upregulate the expansion of B B2 and CD25 lymphocytes and lower IFNγ production when PBMC are in vitro specifically stimulated.
Selected from the article's own text.
Abstract
The objective of this study was to evaluate activation, expansion, and cytokine production after Mycobacterium bovis in vitro specific stimulation of peripheral blood mononuclear cells (PBMC) subpopulations from Argentinian Holstein cows that reacted to the bovine purified protein derivatives (PPDb) caudal fold skin test and were transiting the early peripartum period (EPPp). Flow cytometry, interferon gamma (IFNγ) production, and metabolic activity assessed peripheral blood mononuclear cells (PBMC) stimulation. The study enrolled 19 Argentinian Holstein cows older than two years classified into four groups, one of PPDb reactors that transited the EPP period (PPDbEPPp) (n=5), another of PPDb reactors that did not transit the EPP period (PPDbNoEPPp) (n=5), the third of no PPDb reactors that transited the EPP period (NoPPDbEPPp) (n=5), and the last of no PPDb reactors that did not transit the EPP period (NoPPDbNoEPPp) (n=4). PPDb reactors came from two dairy farms with endemic bovine tuberculosis (TB) and nonreactors from a dairy farm free of PPDb reactors for 12 years. In PPDb reactors, CD14 expressing cells increased significantly after specific stimulation. In PPDbEPPp group, B B2 cells expanded significantly (p=0.004), and cells with the activation marker CD25 (or interleukin-2 receptor α chain) expanded significantly (p= 0.03) with half IFNγ production. Results from this study suggest that in naturally M. bovis infected dairy cows EPP period would not influence the presentation of PPDb by CD14 expressing cells. However, a deregulated immune response might occur because B B2 and CD25 lymphocyte subsets expanded with a lowered IFNγ production.
Mammalian tuberculosis is a chronic granulomatous infectious disease caused by members of the Mycobacterium tuberculosis complex that affects cattle and a wide range of other mammalian species, including human beings (WOAH, 2022). Within this complex Mycobacterium bovis is the major causative agent of bovine tuberculosis (TB) . TB poses a public health threat because of its zoonotic nature and is worldwide reported in cattle generating significant financial loss . Zoonotic TB has been associated with the extrapulmonary form in children, usually caused by the consumption of unpasteurized milk from infected cows . World Health Organization points out that human tuberculosis surveys need adjustments to include children and extrapulmonary tuberculosis because they focus only on bacteriologically confirmed tuberculosis in adults (WHO, 2019, 2020). In Argentina between 2018 and 2019, Garrahan Pediatric Hospital reported three cases of pediatric zoonotic TB in immunocompetent patients. Two cases exhibited extrapulmonary disease and referred ingestion of dairy products purchased in informal markets ; . The reduction of M. bovis infection in cattle should be the pillar of disease prevention in humans .
M. bovis is an acid-fast intracellular pathogen, and the cell-mediated immune response is essential in its control ; . In M. bovis infected host, immune protection and diagnosis depends on cell-mediated immunity . The tuberculin intradermal diagnostic test detects cell-mediated immunity in M. bovis infected cattle, either as the caudal fold test or the single cervical test ; . The former showed 68–96.8% sensitivity and 96–98.8% specificity, and the latter 80–91% and 75.5–96.8%, respectively . The single tuberculin test occasionally presents false positive and false negative reactions. Cross reactivity to other mycobacteria or sensitization by other allergens can cause non-specific responses that lead to false positive reactions. Anergy present during the late stage of infection, the pre-allergic period in early cases (until 3–6 weeks post-infection), desensitized animals by PPD administration during the preceding 8 to 60 days, old cattle, postparturient desensitization, low potency tuberculin, subcutaneous injection (rather than intradermal), or bacterial contamination of the tuberculin can lead to false negative reactions .
T helper (Th) 1 cell-mediated immune response in infected cattle is characterized by the production of IFNγ capable of activating the microbicidal pathways of macrophages. LTCD4 appears to be the dominant population producing IFNγ while LTγδ releases it in lower levels, and LTCD8 has a greater involvement in the apoptosis of infected cells . After TB infection, changes in LT subpopulations occur and comprise three phases. First LTγδ decreases, and then increases (suggesting the recruitment at the site of infection and clonal expansion), second LTCD4:LTCD8 ratio increases, and third this ratio decreases . TB progression also triggers a shift from a Th1 response towards a Th2 response with associated anergy of cell mediated immunity and the development of humoral immune response . A 91% of the bovines that show humoral specific immune response present macroscopic TB lesions, and in 73% of the cases, lesions match generalized TB .
During mammalian reproduction, the mother fails to reject the fetal allograft because some immunological mechanisms allow maternal fetal tolerance . The most critical phase of the productive life of high yielding dairy cows occurs from 3 weeks before to 3 weeks after calving. This lapse is known as the early peripartum period (EPPp) and is also called transition . During the EPPp, healthy cows go from a non-lactating to a lactating state and from a pregnant to a non-pregnant condition; thereby fundamental changes occur. This situation could be considered a physiological adaptation however, when changes are dramatic and long lasting, adaptations are difficult. Dairy EPPp cows struggle to regain homeostasis, but some adaptive mechanisms may be dysregulated. For example, reduced immunological competence and overt systemic proinflammatory response are present. Transcriptomic studies described increased activities in the circulatory cells that belong to the immune system, indicating that its functions are not suppressed but are deregulated. In addition, in this lapse of multiple aggressions, the overt and systemic proinflammatory response occurs with a release of proinflammatory cytokines capable of attenuating the cellular immune response .
Kerr et al. (1946) reported adverse effects of pregnancy on TB diagnosis because they showed that of 20 bovines positive to the tuberculin test, seven lost the capacity for immunological reaction after parturition, and four to six weeks after parturition those bovines recovered this capacity. Buddle et al. (1994) described that pregnancy did not appear to affect the susceptibility to M. bovis infection. Recently, a cross-sectional study surveyed 1865 farmed cattle from 79 herds in selected dairy-intensive districts of Bangladesh. This study identified pregnancy as a risk factor associated with TB infection at cattle level, a risk factor that also increased the odds of TB infection by 1.7 times . As there is little information about the role of pregnancy in the ongoing of TB immune response in naturally infected cattle, the objective of this study was to evaluate activation, expansion, and IFNγ production after M. bovis in vitro specific stimulation of PBMC leukocyte subpopulations from Argentinian Holstein cows that reacted to the tuberculin skin test and were transiting the EPP period.
MATERIALS AND METHODS
Study design
This study enrolled 19 Argentinian Holstein cows older than two years housed on three private dairy farms. Two farms had endemic TB confirmed by the single caudal fold test with PPDb (SENASA, 2012) and by the presence of disseminated granulomatous lesions. The third farm had never presented PPDb reactors for 12 years. The EPPp was established between three weeks before birth and three weeks after, according to Van Kampen and Mallard (1997). Ten of the 19 cows reacted to the single PPDb caudal fold test and came from dairy farms with endemic TB. PPDb cows were sub-classified into two study groups based on EPP period establishment. One group consisted of PPDb reactors that transited the EPP period (PPDbEPPp) (n=5). The second group consisted of PPDb reactors that did not transit the EPP period (PPDbNoEPPp) (n=5). The remaining nine cows did not react to the PPDb caudal fold test and came from a dairy farm that had not reported TB for 12 years. PPDb negative cows were also sub-classified into two groups based on EPP period establishment. The third group consisted of non PPDb reactors that transited the EPP period (NoPPDbEPPp) (n=5). The last group consisted of non PPDb reactors that did not transit the EPP period (NoPPDbNoEPPp) (n=4).
Specimen collection and blood cell count
Noncoagulated blood (15 mL) was extracted by jugular venipuncture using ethylenediaminetetraacetic acid (EDTA) (ANTICOAGULANT W, WIENER, Rosario, Argentina) from all cows in this study. Samples were collected once morning milking ended. Immobilization was done according to welfare rules with a nontraumatic halter. Absolute blood cell populations and relative leukocyte differential counts were rated with a coulter (BC 3000 PLUS MINDRAY, Shenzhen, Popular Republic of China) and Giemsa stained blood smears (MERCK, Saint Paul MN, EEUU), respectively.
Lymphocyte stimulation assay
To perform the specific stimulation assay PBMC were separated by gradient centrifugation from bovine noncoagulated blood. Blood was diluted in PBS (1:3) and layered onto Histopaque 1077 (SIGMA-ALDRICH, Saint Louis, EEUU). Diluted blood was centrifuged under 400 g for 30 minutes at room temperature with a swinging bucket without a brake (SORVALL RC-3C, SORVALL THERMO SCIENTIFIC ™, Waltham, USA). PBMC were collected, and washed twice in PBS, and Trypan blue vital staining assessed viability. PBMC were resuspended, at a concentration of 1x10⁶ PBMC/mL, in RPMI 1640 media (SIGMA-ALDRICH) supplemented with 0.3 g/L glutamine (SIGMA-ALDRICH), 2g/L sodium bicarbonate (SIGMA-ALDRICH), 50 mg/L gentamicin (SIGMA-ALDRICH), and 10% bovine fetal serum (PAA LABORATORIES GmbH, Cölbe, Germany).
To determine in-vitro PBMC specific activity 500 µL (1x10⁶) of suspension were set in duplicated tubes; one was to define resting initial values and the other to define values after specific stimulation or final values. Specific stimulation was with PPDb (CDV Serie 044, Ciudad Autónoma de Buenos Aires, Argentina) at a final concentration of 20 µg/mL ; . PPDb stimuli were certified by the Argentinian National Animal Health Authority (SENASA) under WOAH standards, derived from inactivated AN 5 strain, and the concentration was 1mg/ml containing 32.500 UI/ml. Incubation lasted six days at 37°C in a 5% CO2 chamber ; . To measure PBMC metabolic activity and viability the colorimetric experiment with thiazolyl blue tetrazolium bromide (MTT) was performed .
Flow cytometry (FC)
Dual-color indirect immunolabelling of duplicates and FC defined resting and stimulated PBMC sets and subsets percentages. Autofluorescence and nonspecific reaction to secondary antibody (Ab) controls were included. For dual-color indirect immunolabelling primary monoclonal antibodies (MAb) and secondary Ab were in cocktail of two. Each MAb was at 15 µg/mL, and each secondary Ab was in a 1:200 dilution . MAb were mouse IgG1 and IgM isotypes; secondary Ab were goat antimouseIgG1 conjugated to phycoerythrin (PE), and goat antimouse IgM conjugated to fluorescein isothiocyanate (FITC) (Jackson IMMUNO RESEARCH LABORATORIES INC, Bar Harbor, USA). Table 1 details MAb used during dual indirect immunolabelling, MAb specificity and cells recognized, and fluorescence channel. During primary and secondary PBMC immunolabeling incubation periods lasted 15 minutes under darkness and refrigeration. PBMC were washed, fixed with formalin solution, and stored under darkness. A flow cytometer BD FACSCanto™ (BD™, Franklin Lakes, USA) acquired ten thousand fixed PBMC. FCS EXPRESS 3 trial version (De Novo Software, Los Angeles, USA) processed acquisition data of resting and stimulated PBMC populations
Table 1: MAb and secondary Ab applied during secondary immunolabeling of bovine PBMC.
MAb
Molecule recognized
Cells expressing the molecule
Fluorescent
BAQ95A
CD2 (MIgG1)
T lymphocytes
PE
BAQ44A
CD unknown (MIgM)
B B2 lymphocytes
FITC
CAM36A
CD14 (MIgG1)
Monocytes
PE
CACT148A
WC1 TcR1 (MIgM)
γδ T lymphocytes
FITC
CACT138A
CD4 (IgG1)
T helper/inducer lymphocytes
PE
BAQ111A
CD8 (MIgM)
T cytotoxic/suppressor lymphocytes
FITC
CACT116A
CD25 (IgG1)
IL -2 receptor
PE
GC42A
CD45Ro (IgG1)
Recall activated lymphocytes
PE
Leukocytes sets and subsets were indirectly immunolabeled with specific MAb and secondary Ab. MAb were mouse IgG1(MIgG1) and IgM(MIgM) isotypes. Ab were goat anti-mouseIgG1 conjugated to phycoerythrin (PE) or goat anti-mouseIgM conjugated to fluorescein isothiocyanate (FITC). Minor leukocyte populations were labeled with PE and major ones with FITC so that minority populations were labeled with the fluorochromes that exhibit the highest emission capability.
and subpopulations. PBMC gates were defined with a side scatter (SSC) and forward scatter (FSC) dot plot. Then, a second dot plot was performed to define fluorescence in PE and FITC channels. To corroborate gates in fluorescence channels a histogram determining fluorescence peaks was set, and data from those peaks were backgated to the second dot plot. Statistical information to obtain percentages of each population or subpopulation was requested.
Cytokine assay
IFNγ production was quantified in duplicates with a sandwich ELISA (BOVIGAM, PRIONICS GmbH, Zurich, Switzerland) in PBMC stimulation assay culture media, following the manufacturer protocol. The colorimetric signal was read with a microplate reader under 450 nm. The results were the mean optical density (OD) of duplicate supernatants plus the standard deviation . To complement the cytoquine assay PBMC metabolic activity was measured with the colorimetric experiment with MTT. Plates were read with a microplate reader under a 570 nm filter and stimulation index (SI) was expressed as the ratio between PPDb treated PBMC and concanavalin-A treated PBMC .
Statistical analyses
Statistical analyses were performed with GRAPHPAD PRISM trial version 9.0.0 for Windows, GraphPad Software, San Diego, California USA, www.graphpad.com. Stimulated PBMC subsets were statistically compared against resting PBMC subsets with a multiple paired t test. p adjusted values were chosen, and the significance level was p<0.05. Statistical analyses of the other variables were performed with one-way ANOVA followed by Dunett’s multiple comparisons test, and the significance level was p<0.05. If normality could not be assumed Kruskal and Wallis test replaced the one-way ANOVA, and the significance level was p<0.05.
RESULTS and Discussion
The average hematology parameters of cows under study are summarized in Table 2. Average absolute counts of red blood cells and platelets (data not shown) were within bovine hematological reference ranges for healthy cattle. The average absolute leukocyte counts were higher than the reported ranges for healthy cattle in all study groups, and there were no statistically significant differences between groups. The differential leukocyte counts (data not shown) were also within normal ranges for healthy cattle , and there were no statistically significant differences between groups.
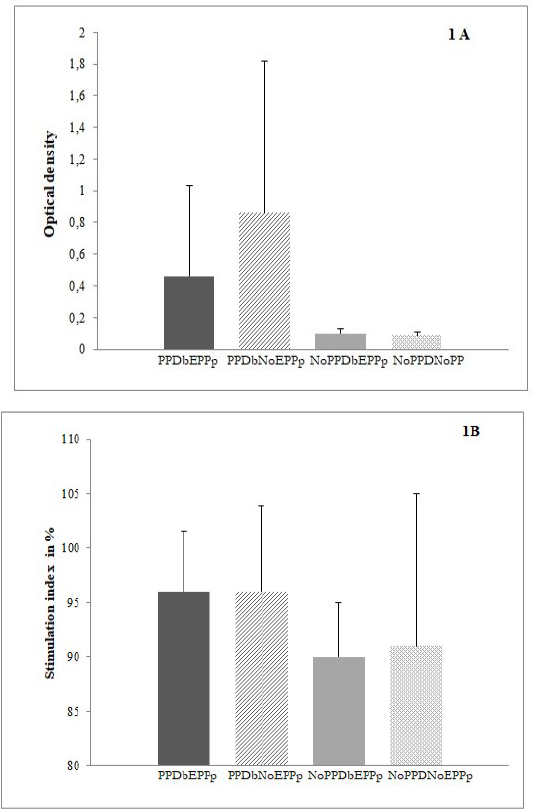
After six days in culture with PPDb, PBMC were alive, metabolically active, and produced IFNγ. Figure 1A shows PBMC activation through stimulation indexes from the MTT assay. The difference between MTT assay average stimulation indexes between study groups was not statistically significant. Figure 1B displays cytokine production through optical densities (OD) from the IFN-γ assay. PBMC produced higher levels of IFNγ in both PPDb reactor groups. PPDbNoEPPp cows and PPDbEPPp cows presented a mean OD value of 0.86±0.96 and 0.46±0.57, respectively. Even though IFNγ mean production in PPDbNoEPPp cows almost doubled the production of PPDbEPPp cows, differences were not statistically significant (p=0.06).
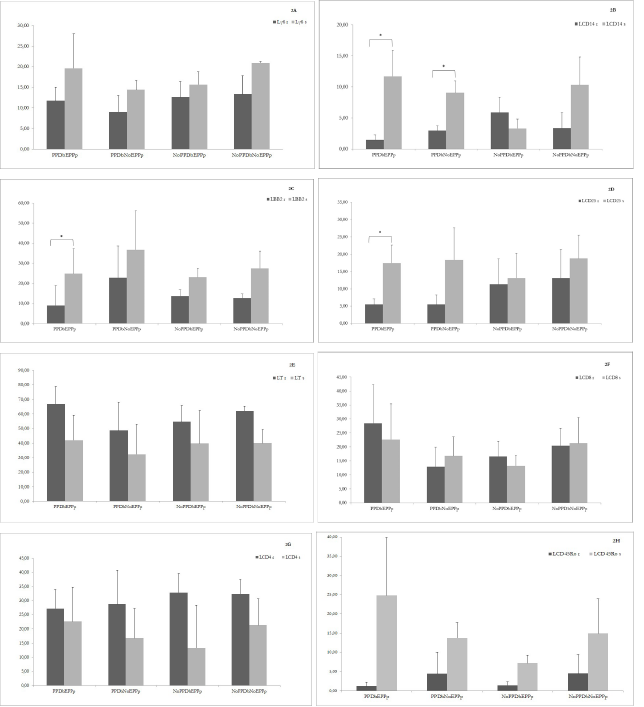
WC1 γδ TCR cells responsible for recognizing PPDb antigens did not display statistically significant increase response in cows from the groups under study with stimulation assay measured by flow cytometry (Figure 2A).
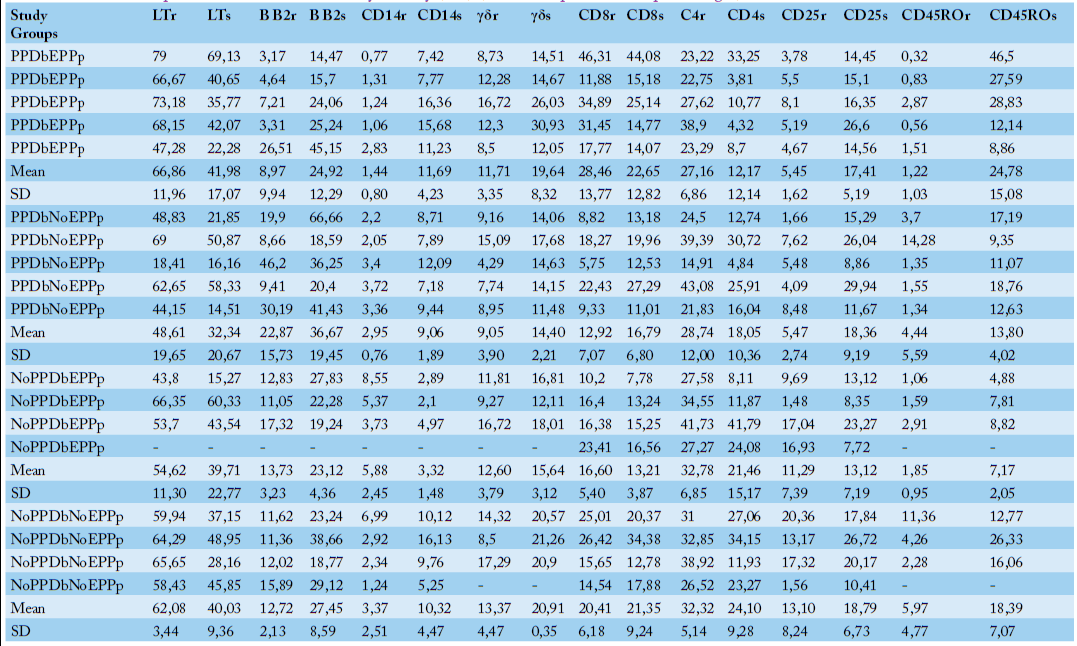
Regarding the processing and presentation of the antigen, CD14 expressing cells increased significantly in both PPDb study groups and B B2 cells increased significantly in PPDbEPPp study group. PPDbEPPp cows presented CD14 mean resting values of 1.44% and mean stimulated values of 11.69% (p=0.008), and PPDbNoEPPp cows showed values of 2.95% and 9.06% (Table 3) (p=0.005), respectively (Figure 2B). B B2 cells from cows in PPDbEPPp displayed a statistically significant response to PPDb stimuli (p=0.004) (Figure 2C) from a mean resting value of 8.97% to a mean stimulated of 24.92% (Table 3).
After stimuli, PBMC from PPDb reactor cows showed the highest percentages of cells expressing CD25 activation marker (interleukin 2 receptor α chain). The increase was statistically significant in PPDbEPPp study group (p=0.03) (Figure 2D). PPDbEPPp cows presented a mean stimulated value of 17.41% from a mean resting value of 5.45% (Table 3).
Respecting the adaptive cellular immune response, the mean stimulated LT values were lower than resting values in all the experimental groups (Figure 2E). In the PPDbEPPp study group, the resting LT mean value was 66.86%, while the NoPPDbNoEPPp study group presented 62.08% (Table 3). In NoPPDbEPPp and PPDbNoEPPp study groups those values were 54.62% and 48.61% respectively (Table 3).
CD8 cytotoxic T cells presented a weak response in the two study groups that did not transit the EPP period, and in the two groups that transited the EPP period, CD8 T cells response was negative (Figure 2F). In the PPDbNoEPPp group, CD8 T cells mean resting percentage was 12.92%, and the mean stimulated percentage was 16.79%. In the NoPPDbNoEPPp group, these percentages were 20.41% and 21.35%, respectively (Table 3).
CD4 helper T cells survived but presented a negative response in all study groups (Figure 2G). However, in PPDb negative cattle resting CD4 T cells were higher than in PPDb positive cattle. CD4 T cells resting values were 32.78% in the NoPPDbEPPp group and 32.32% in the NoPPDbNoEPPp group (Table 3).
CD45Ro recall activated T cells presented a positive response in the four study groups (Figure 2H). The mean resting values of CD45Ro T cells in both groups of animals that went through the EPP period were lower than those presented by both groups that did not go through the EPP period. In PPDbEPPp cows, resting CD45Ro T cells was 1.22%, and in the NoPPDbEPPp cows, it was 1.85% (Table 3).
Specific in vitro immune response of TB natural host was characterized, quantitatively and functionally because limited research has been conducted in M. bovis naturally infected dairy cows transiting the early peripartum period. Quantitative characterization was carried out with differential leukocyte counts and functional characterization with specific stimulation assays based on flow cytometry counts, IFNγ production, and color based MTT assay.
All study groups showed higher absolute leukocyte and lymphocyte counts than reported values for healthy cattle . According to leukogram patterns interpretation and statistical analyses, leukocytosis and lymphocytosis can be considered physiologic ; . NoPPDbEPPp study group showed a physiologic neutrophilic profile with no increment in band neutrophils and without lymphopenia ; . Even though leukocytosis and lymphocytosis were physiologic in this study, some authors describe in tuberculin
Table 2: Absolute differential leukocytes counts in PPDbEPPp, PPDbNoEPPp and NoPPDbEPPp cattle (cells/µL).
Study group
Leukocytes
Lymphocytes
Monocytes
Segmented
neutrophils
Band
neutrophils
Basophils
Eosino-phils
PPDbEPPp
7,900
5,767
395
1,501
79
0
158
PPDbEPPp
16,100
7,889
161
7,406
161
0
483
PPDbEPPp
9,600
5,376
0
3,936
96
0
192
PPDbEPPp
22,700
13,620
227
8,172
227
0
454
PPDbEPPp
15,500
10,850
310
3,720
155
0
465
Mean
14,360
8,700
219
4,947
144
0
350
Standard deviation
5,879
3,504
160
2,777
59
0
161
PPDbNoEPPp
17,000
5,100
340
10,540
170
0
850
PPDbNoEPPp
40,700
13,838
814
17,501
407
0
8,140
PPDbNoEPPp
15,900
12,720
0
2,544
0
0
636
PPDbNoEPPp
7,300
2,701
146
4,015
0
0
438
PPDbNoEPPp
18,500
13,505
0
4,995
0
0
0
Mean
19,880
9,573
260
7,919
115
0
2,013
Standard deviation
12,427
5,263
340
6,152
179
0
3,440
NoPPDbEPPp
28,500
11,400
855
15,960
285
0
0
NoPPDbEPPp
43,000
16,340
430
25,800
430
0
0
NoPPDbEPPp
11,000
4,180
110
5,940
110
0
660
NoPPDbEPPp
12,600
4,662
378
6,300
126
0
1134
Mean
23,775
9,146
443
13,500
238
0
449
Standard deviation
15,056
5,820
308
9,422
151
0
553
reactor cattle leukocytosis ; and lymphocytosis ; ; ; .
In the present study, all study groups showed physiological leukograms, but when FC assessed PBMC characterization, differences between leukocyte subsets became detectable. NoPPDbNoEPPp study group showed resting percentages of LTCD4, LTCD8, and LTγδ within reported values for healthy cattle that did not transit early peripartum period and lowered CD14 cells percentage . NoPPDbEPPp study group presented resting LT, LTCD4, and LTCD8 values within reported ones for healthy cattle that transited the early peripartum period . Both study groups that were PPDb reactor showed LTCD4:LTCD8 ratios (data not shown) according to those described in tuberculous cattle , and LTCD4 and LTCD8 percentages accorded to reported values for tuberculous cattle (Manzo-Sandoval et al., 2023). The PPDbEPPp group showed the lowest LTCD4:LTCD8 ratio, with the highest LTCD8 absolute count and percentage, but the PPDbNoEPPp group had the lowest LTCD8 counts. Furthermore, both PPDb reactor study groups showed lower resting CD14 expressing cells percentages than percentages reported for healthy cattle that did not transit EPPp , and the lowest one belonged to the PPDbEPPp study group. Regarding resting LTγδ counts in PPDb reactor study groups, values agreed with those reported in tuberculous cattle .
In our four study groups, specific lymphocyte stimulation with PPDb caused increased expression of the activation marker CD25, IFNγ production, and metabolically active PBMC survival until the stimulation assay ended. After PPDb stimulation, the proportion of CD14 expressing cells increased significantly in both study groups of PPDb reactors, although they had lower resting values. In cattle, the CD14 molecule is expressed mainly on macrophages and monocytes . Macrophages and monocytes are antigen presenting cells that play a central role in innate immunity against infection and help initiate cell mediated adaptative immunity . Our results suggest that in naturally M. bovis infected dairy cows, the early peripartum period would not influence the response to PPDb by CD14 expressing cells.
In the current study, B B2 lymphocytes increased significantly after specific stimuli in tuberculin reactor cattle that transited the early peripartum period. The B B2 marker is present in most ruminants B lymphocytes (with equivalence to CD19 marker) , has no known human orthologue (Foote et al., 2007; , and may play a role in immunoglobulin production in vaccinated cattle (Foote et al., 2007). The B B 2 subset demonstrated a trend towards a higher number in Mycobacterium avium subsp. paratuberculosis naturally infected cows in the clinical stage of disease in specifically stimulated cells . Our results suggest that the early peripartum period in naturally M. bovis infected dairy cows can induce the expansion of B B2 lymphocytes after specific stimuli; this finding might be part of a Th2 immune profile.
CD25 lymphocytes expanded significantly in PPDbEPPp study group. CD25 is the interleukin 2 receptor α chain , and interleukin 2 (IL2) is a cytokine that, by interacting with CD25 can assume pleiotropic functions (Ross and Cattrell, 2018). In human tuberculosis CD25 is a phenotype marker of LTCD4 regulatory subsets ; Ahmed and Vyakarnam, 2020). Unlike human tuberculosis, in bovine tuberculosis, LTγδ perform regulatory functions . In bovine, LTγδ coexpress low levels of CD25 and releases lower levels of INFγ than LTCD4 . In M. bovis experimentally infected cattle, CD25 is also coexpressed by activated LTCD8 that produces lowered levels of INFγ .
In our study, IFNγ production carried out by PPDb stimulated PBMC from PPDbNoEPPp study group almost doubled the production of PPDbEPPp study group. Relating the IFNγ detection and the reproductive stage in cattle, Buddle et al. (1994) reported that in the first test after calving, the IFNγ production by PPDb stimulated PBMC was lower than the production before calving.
CONCLUSIONs and recommendations
Results from this study suggest that in naturally M. bovis infected dairy cows, the early peripartum period might not influence the presentation of PPDb by CD14 expressing cells, and might upregulate the expansion of B B2 and CD25 lymphocytes and lower IFNγ production when PBMC are in vitro specifically stimulated. The expansion of B B2 cells might indicate antibody synthesis that can be detected with serological diagnostic tests, complementing the single tuberculin test in infected tuberculin false negative cows during the early peripartum period. The same happens with the Bovigam assay because the expansion of CD25 lymphocytes in M. bovis infected cows during the early peripartum period might point out the activation of some subsets that might have lowered, but still detectable, IFNγ production. This study provides information on the influence of the transition period in bovine tuberculosis in vitro immune response, a field not extensively studied.
ACKNOWLEDGMENT
This work was supported by Secretaría de Ciencia Arte y Tecnología Universidad Nacional del Centro de la Provincia de Buenos Aires, Instituto Nacional de Tecnología Agropecuaria Estación Experimental Agropecuaria Balcarce, Instituto de Investigaciones Biomédicas en Retrovirus y SIDA and Monoclonal Antibody Center Washington State University. We thank Claudia Morsella for performing the sandwich ELISA for IFN-γ determination.
Novelty Statement
In tuberculous cows, CD14 cells specifically stimulated increased significantly, suggesting that early peripartum period might not influence antigen acquisition and presentation.
In naturally M. bovis infected dairy cows transiting early peripartum period, specifically stimulated B B2 (BAQ44A+) lymphocytes expanded significantly.
After stimuli, PBMC from PPDb reactor cows showed increased percentages of cells expressing the CD25 activation marker (interleukin-2 receptor α chain), but in PPDb reactor cows transiting early peripartum period, the increase was statistically significant.
IFNγ production was half in specifically stimulated PBMC from tuberculin reactor cattle transiting early peripartum period.
In PPDb reactor dairy cows that go through early peripartum period and are false negative to the single intradermal tuberculin test, serological tests and IFNγ detection assays could be helpful as complementary tests.
AUTHOR’S CONTRIBUTION
MJT conceived and conducted the research and the experiments and wrote the manuscript. MS acquired flow cytometry. MAC Statistically analyzed stimulation assay results. ER statistically designed the study. FP, SE and MCJ supervised and oversaw the research. WCD developed immunolabeling protocol. MCJ and WCD conceptualized the manuscript. MCJ and WCD contributed equally to the research.
Conflict of interests
We confirm that no competing interests exist with any company or institution mentioned in the manuscript.
Figures
Figure 1:.
IFN-γ production and MTT reduction to formazan of PBMC after PPDB stimuli.
IFN-γ production in mean OD ± SD(Graphic 1A) and metabolic activity of PBMC after PPDB stimuli measured through MTT stimulation index in mean percentages ± SD (Graphic 1B). PBMC were from cows PPDbEPPpï‚¢ , PPDbNoEPPp â–¨, NoPPDbEPPp ï‚¢ and NoPPDbNoEPPp â–‘.
Figure 2:.
Resting (r) and stimulated (s) leukocytes subsets before and after PPDb stimuli. Resting (r) ï‚¢ and stimulated (s) ï‚¢ LTγδ (Graphic 2A), CD14 leukocytes (Graphic 2B), B B2 (Graphic 2C), CD25 activation marker (Graphic 2D), LT (Graphic 2E), LTCD8 (Graphic 2F), LTCD4 (Graphic 2G) and CD45Ro (Graphic 2H) are shown in mean percentages with standard deviation bars. Resting and stimulated leukocytes subsets were set with FACS before and after PPDb stimuli (20 µg/mL), respectively. Values were compared with multiple paired t test and significance was signaled with * when p<0.05
Table 3:.
Individual resting (r) and stimulated (s) mean leukocytes subsets with standard deviation (SD) in PPDbEPPp, PPDbNoEPPp, NoPPDbEPPp, and NoPPDbNoEPPp cattle obtained with flow cytometry (FC) (results are presented in percentages).
References
Ahmed A, Vyakarnam A (2020). Emerging patterns of regulatory T cell function in Tuberculosis. Clin. Exp. Immunol., 202(3): 273-287. https://doi.org/10.1111/cei.13488[CrossRef]
Baldwin, C.L., Damani-Yokota, P., Yirsaw, A., Loonie, K., Teixeira, A.F., Gillespie, A. Special features of γδ T cells in ruminants. Molecular Immunology, 2021; 134:161-169. https://doi.org/10.1016/j.molimm.2021.02.028[CrossRef]
Blanco FC, Gravisaco MJ, Bigi MM, García EA, Marquez C, McNeil M, Jackson M, Bigi F (2021). Identifying bacterial and host factors involved in the interaction of Mycobacterium bovis with the bovine innate immune cells. Front. Immunol., 12: 674643. https://doi.org/10.3389/fimmu.2021.674643[CrossRef]
Borham M, Oreiby A, El-Gedawy A, Hegazy Y, Khalifa HO, Al-Gaabary M, Matsumoto T (2022). Review on bovine tuberculosis: An emerging disease associated with multidrug-resistant Mycobacterium species. Pathogens, 11(7): 715. https://doi.org/10.3390/pathogens11070715[CrossRef]
Buddle BM, Aldwell FE, Pfeffer A, de Lisle GW, Corner LA (1994). Experimental Mycobacterium bovis infection of cattle: Effect of dose of M. bovis and pregnancy on immune responses and distribution of lesions. N. Z. Vet. J., 42: 167-172. https://doi.org/10.1080/00480169.1994.35814[CrossRef]
Davis WC, Hamilton MJ (2008). Use of flow cytometry to develop and characterize a set of monoclonal antibodies specific for rabbit leukocyte differentiation molecules. J. Vet. Sci., 9(1): 51-66. https://doi.org/10.4142/jvs.2008.9.1.51[CrossRef]
de Macedo Couto R, Santana GO, Ranzani OT, Waldman EA (2022). One Health and surveillance of zoonotic tuberculosis in selected low-income, middleincome and high-income countries: A systematic review. PLoS Negl. Trop. Dis., 16(6): e0010428. https://doi.org/10.1371/journal.pntd.0010428[CrossRef]
Eclinpath Com (2021). Cornell University. https://eclinpath.com/hematology/leukogram-changes/leukogram-patterns/ (September 14th, 2023)
Foote MR, Nonnecke BJ, Beitz DC, Waters WR (2007). Antigen-specific B-cell responses by neonatal calves after early vaccination. J. Dairy Sci., 90(11): 5208-5217. https://doi.org/10.3168/jds.2007-0285[CrossRef]
Garbaccio SG, Garro CJ, Delgado F, Tejada GA, Eirin ME, Huertas PS, Leon EA, Zumárraga MJ (2019). Enzyme-linked immunosorbent assay as complement of intradermal skin test for the detection of Mycobacterium bovis infection in cattle. Tuberculosis (Edinb), 117: 56-61. https://doi.org/10.1016/j.tube.2019.05.006[CrossRef]
Guerra-Maupome M, Palmer MV, Waters WR, McGill JL (2019). Characterization of γδ T cell effector/memory subsets based on CD27 and CD45R expression in response to Mycobacterium bovis Infection. Immun. Horizons, 3(6): 208-218. https://doi.org/10.4049/immunohorizons.1900032[CrossRef]
Harp JA, Waters TE, Goff JP (2004). Lymphocyte subsets and adhesion molecule expression in milk and blood of periparturient dairy cattle. Vet. Immunol. Immunopathol., 102(1-2): 9-17. https://doi.org/10.1016/j.vetimm.2004.05.006[CrossRef]
Highton E, Mussini MS, Perez MG, Izaguirre MJ, Taicz M, Niño N, Simboli N, Bologna R (2018). Infección por Mycobacterium bovis en pacientes inmunocompetentes: reporte de dos casos pediátricos. In: Sociedad Argentina de Infectología Pediátrica (eds), Congreso internacional de infectología pediátrica y vacunas, 1st edn. p. 96. CABA, Argentina.
Hodgkin PD (2005). Quantitative rules for lymphocyte regulation: The cellular calculus and decisions between tolerance and activation. Tissue Antigens, 66(4): 259-266. https://doi.org/10.1111/j.1399-0039.2005.00475.x[CrossRef]
Javed MT, Ahmad L, Irfan M, Ali I, Khan A, Wasiq M, Farooqi FA, Latif MS, Cagiola M (2010). Haematological and serum protein values in tuberculin reactor and non-reactor water buffaloes, cattle, sheep and goats. Pak. Vet. J., 30(2): 100-104. http://www.pvj.com.pk/pdf-files/30_2/100-104%20_9115_.pdf
Kerr WR, Lamont HG, McGirr JL (1946). Studies on tuberculin sensitivity in the bovine. Vet. Rec., 58(42): 451-453.
Killick KE, Browne JA, Park SD, Magee DA, Martin I, Meade KG, Gordon SV, Gormley E, O’Farrelly C, Hokamp K, MacHugh DE (2011). Genome-wide transcriptional profiling of peripheral blood leukocytes from cattle infected with Mycobacterium bovis reveals suppression of host immune genes. BMC Genom., 12: 611-629. https://doi.org/10.1186/1471-2164-12-611[CrossRef]
Liébana E, Girvin RM, Welsh M, Neill SD, Pollock JM (1999). Generation of CD8+ T-cell responses to Mycobacterium bovis and mycobacterial antigen in experimental bovine tuberculosis. Infect. Immun., 67(3): 1034-1044. https://doi.org/10.1128/IAI.67.3.1034-1044.1999[CrossRef]
Maggioli MF, Palmer MV, Thacker TC, Vordermeier HM, Waters WR (2015). Characterization of effector and memory T cell subsets in the immune response to bovine tuberculosis in cattle. PLoS One, 10(4): e0122571. https://doi.org/10.1371/journal.pone.0122571[CrossRef]
Manzo-Sandoval A, Jaramillo-Meza L, Olguín-Alor R, Sánchez-Torres LE, Díaz-Otero F (2023). Application of multiparametric flow cytometry panels to study lymphocyte subpopulations in tuberculin-positive cattle. Vet. Sci., 10(3): 197. https://doi.org/10.3390/vetsci10030197[CrossRef]
Maue AC, Waters WR, Davis WC, Palmer MV, Minion FC, Estes DM (2005). Analysis of immune responses directed toward a recombinant early secretory antigenic target six-kilodalton protein–culture filtrate protein 10 fusion protein in Mycobacterium bovis-infected cattle. Infect. Immun., 73(10): 6659–6667. https://doi.org/10.1128/IAI.73.10.6659-6667.2005[CrossRef]
Mohankumar S, Nalini TS, Kumar AKR, Ravikumar P, Azeemulla HR (2011). Hematological and biochemical studies in tuberculin test positive reactors. Int. J. Pharma Bio Sci., 2(4): 16-23.
Pastoret PP, Griebel P, Bazin H, Govaerts A (1998). Immunology of cattle. In: Academic Press (eds), Hanbook of Vertebrate Immunology, 1st edn. Cambridge, UK. pp. 439-484. https://doi.org/10.1016/B978-012546401-7/50015-9[CrossRef]
Pollock JM, Pollock DA, Campbell DG, Crockard AG, Girving RM, McNair J, Neill SD, Mackie DP (1996). Dynamic changes in circulating and antigen-responsing T-cell subpopulations post-Mycobacterium bovis infection in cattle. Immunology, 87: 236-24. https://doi.org/10.1046/j.1365-2567.1996.457538.x[CrossRef]
Pollock JM, Welsh MD, McNair J (2005). Immune responses in Bovine Tuberculosis: Towards new strategies for the diagnosis and control of disease. Vet. Immunol. Immunopathol., 108: 37-43. https://doi.org/10.1016/j.vetimm.2005.08.012[CrossRef]
Quevillon EL, Díaz F, Jaramillo L, Lascurain R, Gutiérrez-Pabello JA, Castañeda FA, Arriaga C, Pérez R, González XE (2013). Comparison of immune peripheral blood cells in tuberculin reactor cattle that are seropositive or seronegative for Mycobacterium bovis antigens. Vet. Immunol. Immunopathol., 153: 194-201. https://doi.org/10.1016/j.vetimm.2013.02.016[CrossRef]
Ramayo LG, Soba MG, Mundo SL (2005). Evaluación de la inmunidad celular en bovinos: prueba de proliferación de linfocitos in vitro. Invest. Vet., 7(1): 63-70. Available at: https://www.redalyc.org/articulo.oa?id=179114156008 (accessed 14 Sep 2023).
Rhodes SG, Hewinson RG, Vordermeier HM (2001). Antigen recognition by γδ T cells in Bovine tuberculosis. J. Immunol., 166(9): 5604-5610. https://doi.org/10.4049/jimmunol.166.9.5604[CrossRef]
Roberts T, Beyers N, Aguirre A, Walzl G (2007). Immunosuppression during active tuberculosis is characterized by decreased interferon-γ production and CD25 expression with elevated forkhead box P3, transforming growth factor-β, and interleukin-4 mRNA levels. J. Infect. Dis., 195(6): 870-878. https://doi.org/10.1086/511277[CrossRef]
Roland L, Drillich M, Iwersen M (2014). Hematology as a diagnostic tool in bovine medicine. J. Vet. Diagn. Invest., 26(5): 592-598. https://doi.org/10.1177/1040638714546490[CrossRef]
Roperto S, Varano M, Russo V, Lucà R, Cagiola M, Gaspari M, Ceccarelli DM, Cuda G, Roperto F (2017). Proteomic analysis of protein purified derivative of Mycobacterium bovis. J. Transl. Med., 15: 68. https://doi.org/10.1186/s12967-017-1172-1[CrossRef]
Ross SH, Cattrell DA (2018). Signaling and function of interleukin-2 in T lymphocytes. Ann. Rev. Immunol., 36: 411-433. https://doi.org/10.1146/annurev-immunol-042617-053352[CrossRef]
Servicio Nacional de Sanidad Animal y Calidad Agroalimentaria (SENASA), (2012). Resolución 128/2012 Plan Nacional de Control y Erradicación de la Tuberculosis Bovina en la República Argentina. Available at: http://servicios.infoleg.gob.ar/infolegInternet/anexos/195000-199999/195314/texact.htm (accessed 14 Sep 2023)
Shaheenur ISK, Rumi TB, Kabir SML, van der Zanden AGM, Kapur V, Rahman AKMA, Ward MP, Bakker D, Ross GA, Rahim Z (2020). Bovine tuberculosis prevalence and risk factors in selected districts of Bangladesh. PLoS One, 15(11): e0241717. https://doi.org/10.1371/journal.pone.0241717[CrossRef]
Schiller I, Oesch B, Vordermeier HM, Palmer MV, Harris BN, Orloski KA, Buddle BM, Thacker TC, Lyashchenko KP, Waters WR (2010). Bovine tuberculosis: A review of current and emerging diagnostic techniques in view of their relevance for disease control and eradication. Transb. Emerg. Dis., 57: 205-220. https://doi.org/10.1111/j.1865-1682.2010.01148.x[CrossRef]
Sohn EJ, Paape MJ, Peters RR, Fetterer RH, Talbot NC, Bannerman DD (2004). The production and characterization of anti-bovine CD14 monoclonal antibodies. Vet. Res., 35: 597–608. https://doi.org/10.1051/vetres:2004035[CrossRef]
Stabel JR, Bannantine JP, Humphrey S (2022). B cell phenotypes and maturation states in cows naturally infected with Mycobacterium avium subsp. paratuberculosis. PLoS One, 17(12): e0278313. https://doi.org/10.1371/journal.pone.0278313[CrossRef]
Traversa MJ, Saracco M, Davis WC, Eluchans M, González F, Paolicchi F, Estein SM, Rodríguez EM, Jorge MC (2010). Experimental error control during immune monitoring by flow cytometry of positive reactors to bovine tuberculin skin test. Transl. Biomed., 1(3-4): 17.
Trevisi E, Minuti A (2018). Assessment of the innate immune response in the periparturient cow. Res. Vet. Sci., 116: 47-54 https://doi.org/10.1016/j.rvsc.2017.12.001[CrossRef]
Van Kampen C, Mallard BA (1997). Effects of peripartum stress and health on 21 circulating bovine lymphocyte subsets. Vet. Immunol. Immunopathol., 59(1-2): 79-9. https://doi.org/10.1016/S0165-2427(97)00069-X[CrossRef]
Vega Saldaña M, Sosa LS, González MN, Izaguirre MJ (2019). Mycobacterium bovis Tuberculosis in a child in the Commune n° 8, Buenos Aires City. Arch. Argent. Pediat., 117(5): e532-e535/e532.
World Health Organization (2019). Global tuberculosis report. Available at: https://iris.who.int/bitstream/handle/10665/329368/9789241565714-eng.pdf?sequence=19
World Health Organization (2020). Global tuberculosis report. Available at: https://iris.who.int/bitstream/handle/10665/336069/9789240013131-eng.pdf?sequence=1 (accessed 29 Jan 2024)
World Organization for Animal Health (2022). Chapter 3.1.13. mammalian tuberculosis (infection with Mycobacterium tuberculosis complex). Available at: https://www.woah.org/fileadmin/Home/eng/Health_standards/tahm/3n_tuberculosis.pdf (accessed 29 Jan 2024).
In Tuberculous Cattle Transiting Early Peripartum Period Specific In Vitro PBMC Stimulation Induces an Increase of CD14 Expressing Cells, B B2 Cells, and CD25 Cells with Half IFNγ Production · ResearchersLinks