Research Article · Volume 14, Issue 4, 8 September 2026 · Open Access
Impact of Rumen Passage Rate on Effective Degradability of Feeds: Comparison between In Situ and In Vitro Gas Test Approaches
· · · · ·
Affiliations & Notes ⌄
- 1Department of Animal Nutrition and Feed Technology, Faculty of Animal Science, IPB University, IPB Dramaga Campus, Bogor-West Java, 16680, Indonesia. *Correspondence | Despal, Department of Animal Nutrition and Feed Technology, Faculty of Animal Science, IPB University, IPB Dramaga Campus, Bogor-West Java, 16680, Indonesia
- 2Email: despal@apps.ipb.ac.id
Article Info ⌄
- Journal:
- Journal of Animal Health and Production
- Published:
- 8 September 2026

From the article
- The forage-to-concentrate (F:C) ratio influenced rumen passage rate and the ED of feeds measured by the in situ method.
- Higher concentrate levels accelerated rate of passage and reduced ED, while diets rich in forage slow transit rate and increase ED.
- The balanced 50:50 F:C ratio provided the most stable rumen environment, linking moderate passage rate with optimal fermentation conditions.
- Overall, the 50:50 F:C ratio offers the most efficient and balanced rumen fermentation profile.
Selected from the article's own text.
Abstract
INTRODUCTION
Feed evaluation in ruminant nutrition commonly uses in situ and in vitro approaches to characterize the rate and kinetics of rumen degradation key parameters for ration formulation and predicting animal performance (Ørskov and McDonald, 1979; Getachew et al., 2004). The in situ nylon-bag technique exposes feed directly to the rumen environment and microbial populations, allowing degradation to occur under near-natural conditions. In contrast, the in vitro gas production method quantifies fermentation in a controlled system, generating consistent and reproducible estimates of feed fermentability and microbial activity.
A major factor influencing in situ degradation is the rate of digesta flow from the rumen. This rate is largely determined by diet composition, particularly the forage-to-concentrate ratio, which affects rumen retention time, particle size reduction, and fermentation dynamics (Chen et al., 2015; Zhang et al., 2017). Concentrate-rich diets typically increase digesta flow due to rapid starch fermentation, whereas forage-based diets slow rumen outflow and extend retention time, allowing more complete degradation (Arini and Kafiar, 2014).
Understanding the interaction between diet, digesta flow, and degradability is essential for interpreting nylon-bag results. The effective degradability (ED) parameter integrates both the degradation rate and rumen outflow rate; therefore, variations in digesta flow among animals or diets can alter ED values and reduce consistency across treatments (Ørskov and McDonald, 1979). In contrast, in vitro gas production estimates are not affected by digesta flow, providing a more stable assessment of degradability under standardized conditions (Blümmel et al., 1997).
Variation in forage-to-concentrate ratios provides a practical model for testing this interaction because these ratios influence both microbial ecology and rumen passage dynamics. Clarifying the extent to which in situ values are affected by digesta flow and whether in vitro gas production provides a more stable reference can strengthen feed evaluation protocols and improve the interpretation of degradability parameters. In this study, we investigated how different forage-to-concentrate ratios influence rumen digesta flow and examined the consequences for feed degradability measured using in situ and in vitro gas production methods. Specifically, we aimed to: (1) quantify digesta flow rates across diets with differing forage-to-concentrate ratios; (2) determine the ED of representative feed components using in situ nylon-bag incubation; and (3) compare in situ degradability with in vitro gas production kinetics. We hypothesized that ED values from the in situ method would vary according to digesta flow rate, whereas gas test results would remain relatively stable across diets. This comparison provides insight into the advantages and limitations of each approach and highlights the interaction between diet composition, rumen dynamics, and degradability estimates.
MATERIALS AND METHODS
Experimental animals and diets
The experiment was carried out using three rumen-fistulated Friesian Holstein (FH) bulls with an average body weight of 540 ± 28 kg. Animals were individually housed in pens and allocated to experimental diets with different forage-to-concentrate (F:C) ratios: P1: 60% Napier grass + 40% concentrate, P2: 50% Napier grass + 50% concentrate and P3: 40% Napier grass + 60% concentrate. Animals were adapted to their respective diets for 14 days before data collection. Feeding was based on dry matter (DM) requirements adjusted for body weight (BW) and expected average daily gain (ADG) according to NRC (2001). Feed allocation was not given as a fixed percentage of BW, but was calculated to fulfill the nutrient requirements of each animal. Feeding was conducted twice daily at 08:00 and 16:00, and refusals were recorded to calculate daily intake. Feed chemical composition was analyzed using Near Infrared Reflectance Spectroscopy (NIRS), while total digestible nutrient (TDN) content was estimated according to Indah et al. (2020). Chemical composition of the treatment rations is shown in Table 1.
Table 1: Chemical composition of treatment rations
|
Parameters |
Forage: concentrate ratio |
||
|
60:40 (P1) |
50:50 (P2) |
40:60 (P3) |
|
|
Dry matter (%) |
91.83 |
92.34 |
93.05 |
|
Ash (% DM) |
10.39 |
9.76 |
9.92 |
|
Crude protein (% DM) |
6.83 |
7.63 |
8.03 |
|
Ether extract (%) |
4.64 |
5.68 |
6.6 |
|
Crude fiber (%) |
22.59 |
20.92 |
19.32 |
|
Nitrogen-free extract (%) |
47.38 |
48.35 |
49.18 |
|
Total digestible nutrient (%) |
50.57 |
54.59 |
57.81 |
TDN = Total Digestible Nutrient was calculated according to Indah et al. (2020) TDN = 2.79 + 1.17CP + 1.74EE -0.295CF + 0.81NFE
Measurement of feed intake and rate of passage
Feed intake (X) of the ration by the fistulated bull is measured by subtracting the feed and nutrients offered from the residue. Passage rate was calculated from the feed intake. The formula for forage was Kp = 3.362 + 0.614X1, while the Kp formula for concentrate was Kp = 2.904 + 1.375X1 – 0.020X2. Where Kp is the rate of passage (%/h), X1 is feed intake (kg/d), and X2 is concentrate in ration (%). These equations were adopted from NRC (2001).
Rumen condition
Rumen condition and fermentation products as the effect of different forage-to-concentrate ratios was measured from rumen fluid collected from a fistula. Parameters measured include pH, protozoal and bacterial populations, fermentation product (total VFA and partial VFA, ammonia, and methane). Rumen pH was measured using a Hanna pH meter (Hanna Instruments, HI98191, Cluj-Napoca, Romania). Protozoal and bacterial (amylolytic, cellulolytic, and total bacteria) populations were measured using Ogimoto and Imai (1981). Total VFA was measured using the steam distillation method and NH3 was measured using Conway method. The measurement followed a similar method used by Zahera et al. (2024). Partial VFA was measured using gas chromatography, while CH4 was calculated based on partial VFA. Methane was estimated using Moss et al. (2000) formula based on VFA profile.
CH4 (mM) 0.45 C2 – 0.275 C3 + 0.40 C4
Where; CH4 = methane (mM), C2 = acetate (mM), C3 = propionate (mM) and C4 = butyrate (mM).
Degradability of tested feed (In Situ)
Feed degradability of corn grain, Napier grass, and the complete rations was determined using the nylon bag (in situ) technique Ørskov and Mcdonald (1979). Feed samples (5 g DM, ground to pass a 2-mm screen) were weighed into nylon bags (pore size 40–50 µm). Bags were incubated in the fistulated rumen for 0, 3, 6, 9, 12, 24, 48, and 72 h. After removal, bags were rinsed thoroughly under running water, dried at 60 °C for 48 h, and weighed. Residues were oven-dried for 24 h at 105 °C to determine dry matter (DM) degradability and were subsequently ashed at 600 °C for 4 h to determine organic matter (OM) degradability. Nutrient content of the tested feed is shown in Table 2.
Table 2: Chemical composition of the tested feed
|
Parameters |
Corn |
Napier grass |
Complete dairy ration |
|
Dry matter (%) |
91.98 |
89.61 |
93.05 |
|
Ash (% DM) |
2.44 |
13.67 |
9.92 |
|
Crude protein (% DM) |
7.79 |
10.43 |
8.03 |
|
Ether extract (%) |
5 |
3.71 |
6.6 |
|
Crude fiber (%) |
1.98 |
31.25 |
19.32 |
|
Nitrogen-free extract (%) |
74.77 |
30.55 |
49.18 |
|
Total digestible nutrient (%) |
80.58 |
36.98 |
57.81 |
TDN = Total Digestible Nutrient was calculated according to Indah et al. (2020) TDN = 2.79 + 1.17CP + 1.74EE -0.295CF + 0.81NFE
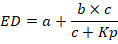
Degradation kinetics were modeled as p=a + b × (1−e−ct) where a is the soluble fraction, b the potentially degradable fraction, and c the degradation rate constant of b. ED was calculated as:

with Kp obtained from passage rate measurements.
Research design and data analysis
The experiment was designed in a Latin square 3 x 3. All data were analyzed using analysis of variance (ANOVA), and treatment means were compared with Tukey’s test at P<0.05. Pearson’s correlation was used to evaluate relationships between in situ and in vitro parameters. Correlation analysis was conducted between kinetic parameters (a, b, a+b, c, and ED) obtained from in situ and in vitro methods for corn, Napier grass, and complete rations. Statistical analyses were conducted using SPSS (version 25).
RESULTS
Feed intake and passage rate
Feed intake and passage rate from rations with different forage-concentrate ratios are shown in Table 3. Total Dry Matter Intake (DMI) of fistulated bulls did not differ significantly among treatments (P > 0.05), with an average of 8.51 ± 0.03 kg/day. The forage-concentrate ratio altered the intake distribution: treatment P1 had the highest forage consumption (5.06 ± 0.08 kg/day) and the lowest concentrate consumption (3.43 ± 0.04 kg/day), while P3 showed the opposite pattern with higher concentrate consumption (5.15 ± 0.07 kg/day) and lower forage consumption (3.35 ± 0.11 kg/day). The rate of passage showed significant differences (P < 0.05) between treatments, indicating an increase with the addition of concentrate. P1 showed the lowest rate (6.42 ± 0.04 %/h), P2 was in the middle (6.73 ± 0.06 %/h), and P3 had the highest rate (7.31 ± 0.09 %/h).
Table 3: Feed intake and passage rate
|
Parameters |
Forage: concentrate ratio |
Average |
|||
|
60 : 40 (P1) |
50 : 50 (P2) |
40 : 60 (P3) |
P-value |
||
|
Forage intake (kg/d) |
5.06 ± 0.08c |
4.24 ± 0.04b |
3.35 ± 0.11a |
0.003 |
4.22 ± 0.85 |
|
Concentrate intake (kg/d) |
3.43 ± 0.04a |
4.28 ± 0.07b |
5.15 ± 0.07c |
0.037 |
4.28 ± 0.86 |
|
Dry matter intake (kg/d) |
8.49 ± 0.12 |
8.54 ± 0.11 |
8.50 ± 0.18 |
0.412 |
8.51 ± 0.03 |
|
Rate of Passage (%/h) |
6.42 ± 0.04a |
6.73 ± 0.06b |
7.31 ± 0.09c |
0.031 |
6.82 ± 0.06 |
Note: P1 = 60% Napier grass + 40% concentrate, P2 = 50% Napier grass + 50% concentrate, P3 = 40% Napier grass + 60% concentrate. Means in the same row with different superscripts differ significantly (P<0.05).
Table 4: Rumen condition and fermentation products of treatment ration.
|
Parameters |
Forage: concentrate ratio |
||||
|
60 : 40 (P1) |
50 : 50 (P2) |
40 : 60 (P3) |
P-value |
Average |
|
|
Rumen pH |
6.97 ± 0.08 |
7.11 ± 0.04 |
7.01 ± 0.12 |
0.966 |
7.02 ± 0.08 |
|
Total bacteria (log CFU/mL) |
10.47 ± 1.40 |
10.32 ± 1.11 |
10.28 ± 1.14 |
0.981 |
10.36 ± 1.06 |
|
Amylolytic bacteria (log CFU/mL) |
10.31 ± 1.20 |
10.95 ± 1.13 |
10.48 ± 1.31 |
0.965 |
10.58 ± 1.09 |
|
Cellulolytic bacteria (log CFU/mL) |
10.17 ± 0.04 |
10.00 ± 0.07 |
10.17 ± 0.31 |
0.710 |
10.11 ± 0.18 |
|
Protozoa population (log CFU/mL) |
6.40 ± 0.13 |
6.53 ± 0.01 |
6.56 ± 0.02 |
0.515 |
6.49 ± 0.10 |
|
NH3 (mM) |
8.93 ± 4.47 |
11.27 ± 2.25 |
7.91 ± 1.70 |
0.388 |
9.37 ± 3.03 |
|
VFA total (mM) |
99.10 ± 10.86 |
92.80 ± 8.15 |
101.07 ± 7.17 |
0.993 |
97.66 ± 8.73 |
|
Acetate (mM) |
37.21 ± 24.32 |
26.47 ± 21.01 |
34.03 ± 20.13 |
0.421 |
32.57 ± 21.82 |
|
Propionate (mM) |
16.18 ± 3.46 |
12.8 ± 8.08 |
12.43 ± 7.21 |
0.674 |
13.80 ± 6.25 |
|
Butyrate (mM) |
7.81 ± 3.79 |
8.45 ± 2.43 |
7.58 ± 3.78 |
0.164 |
7.95 ± 3.33 |
|
Acetate/propionate ratio |
2.24 ± 1.12 |
2.01 ± 0.59 |
2.69 ± 0.14 |
0.168 |
2.31 ± 0.62 |
|
Methane production (mM) |
18.29 ± 7.86 |
12.14 ± 8.78 |
15.54 ± 8.78 |
0.403 |
15.32 ± 3.08 |
Note: P1 = 60% Napier grass + 40% concentrate, P2 = 50% Napier grass + 50% concentrate, P3 = 40% Napier grass + 60% concentrate.
Rumen conditions and fermentation products
Rumen conditions and fermentation products of the treatment diets are shown in Table 4. Rumen pH values in all treatments remained within the normal physiological range for microbial activity (6.8–7.2; Van Soest, 1994). The highest pH value was observed in P2 (7.11 ± 0.04), followed by P3 (7.01 ± 0.12) and P1 (6.97 ± 0.08). The pH values obtained in this study did not show significant differences.
The total bacterial population was not significantly affected by the ratio of forage to concentrate, with an average of 10.36 ± 1.06 log CFU/mL, which is still considered normal. Amylolytic bacteria tended to be higher in P2 (10.95 ± 1.13 log CFU/mL), while cellulolytic bacteria were relatively stable (10 log CFU/mL) across all treatments. Protozoa populations were slightly higher in P2 (6.53 ± 0.01 log CFU/mL) and P3 (6.56 ± 0.02 log CFU/mL) compared with P1 (6.40 ± 0.13 log CFU/mL). Concentrations of NH3 and total VFA were not significantly different among treatments. Partial VFA concentration also showed no significant differences, with acetate concentration being higher in P1 (37.21 ± 24.32 mM) and P3 (34.03 ± 20.13 mM) compared with P2 (26.47 ± 21.01 mM). Propionate was slightly higher in P1 (16.18 ± 3.46 mM) than in P2 (12.8 ± 8.08 mM) and P3 (12.43 ± 7.21 mM), while butyrate concentrations were relatively similar across treatments (7.58–8.45 mM). The acetate-to-propionate (C2:C3) was lowest in P2 (2.01 ± 0.59) compared with P1 (2.24 ± 1.12) and P3 (2.69 ± 0.14).
Methane production varied between treatments, ranging from 12.14 ± 8.78 mM in P2 to 18.29 ± 7.86 mM in P1, with a median value of 15.54 ± 8.78 mM in P3. Although these differences were not statistically significant (P > 0.05), the lowest methane concentration was observed in treatment P2 with a 50:50 ratio of forage to concentrate. These results suggest that a balanced forage-concentrate ratio can reduce rumen methane emission potential while maintaining stable overall fermentation activity.
Degradability of tested feed
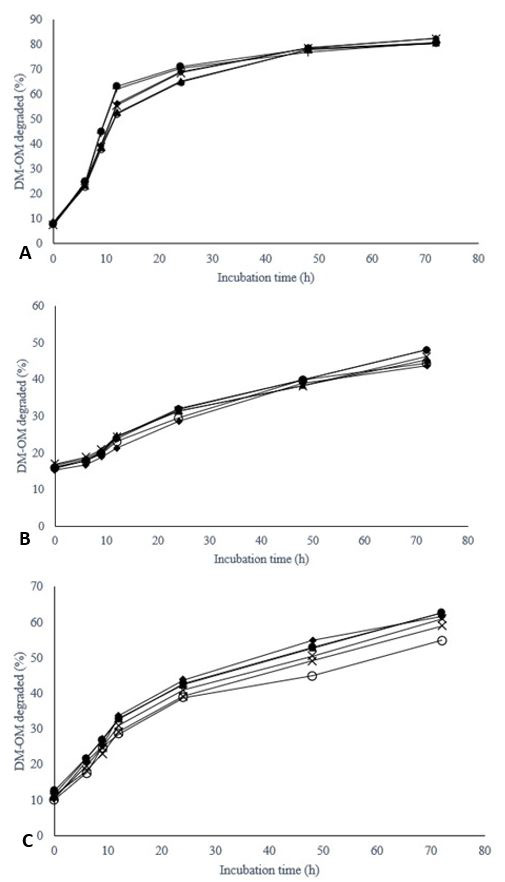
Corn exhibited the highest degradation rates among the tested feeds (Figure 1A). Rapid degradation occurred within the first 12 h reaching 60–65% for DM and slightly lower for OM. Degradation continued to increase gradually achieving more than 80% by 72 h of incubation. Across treatments, no major differences were detected, although P1 tended to have slightly higher ED values compared to P2 and P3.
The degradability of napier grass was markedly lower than that of corn (Figure 1B). At 72 h of incubation, DM and OM degradation reached only 45–48%. The degradation pattern was more gradual, with smaller increments compared to corn, indicating a slower fermentation rate. Differences among treatments were minimal.
The degradation pattern of the complete ration (Figure 1C) was intermediate between corn and napier grass, reflecting the contribution of both starch-rich and fiber-rich components. Degradability increases gradually, reaching 60–65% after 72 hours. Among the treatments, P1 and P2 tended to show slightly higher degradation than P3, which showed lower values at longer incubation times. The overall results confirm that feed type strongly determines degradation kinetics: Corn degrades rapidly and completely, Napier grass degrades slowly and incompletely, while complete rations fall between the two.
Kinetics of DM and OM degradation in situ
In situ kinetics were calculated from the disappearance of feed and nutrients from nylon bags at different incubation times, and are therefore expressed as percentages (%). The kinetics of corn degradation show a relatively small soluble fraction (a), ranging from 4.70 to 6.40% and a potentially degradable fraction (b) of 75 to 78% (Table 5). The total degradable fraction (a+b) exceeded 80%, confirming that corn starch is highly fermentable in the rumen. The degradation rate constant (c) was similar among treatments (0.07–0.08 h⁻¹). However, ED differed significantly (P<0.05), with the highest value in P1 (47.10%) compared to P2 (44.78%) and P3 (43.28%).
Table 5: Kinetic of DM degradation of the tested feeds.
|
Kinetics coefficients |
P1 |
P2 |
P3 |
P value |
|
Corn |
||||
|
a (%) |
4.70±1.42 |
5.09±0.84 |
6.40±1.52 |
0.148 |
|
b (%) |
76.43±1.96 |
77.83±2.03 |
75.40±1.32 |
0.345 |
|
a+b (%) |
81.13±0.59 |
82.93±1.59 |
81.80±0.41 |
0.383 |
|
c (/h) |
0.08±0.00 |
0.07±0.00 |
0.07±0.00 |
- |
|
ED (%) |
47.10±0.38b |
44.78±0.78ab |
43.28±0.91a |
0.039 |
|
Napier grass |
||||
|
a (%) |
14.62±0.41 |
15.56±1.01 |
13.67±0.40 |
0.268 |
|
b (%) |
47.27±1.16b |
39.92±1.65a |
44.22±2.10b |
0.029 |
|
a+b (%) |
61.89±1.28 |
55.49±1.58 |
57.89±2.28 |
0.107 |
|
c (/h) |
0.02±0.00 |
0.02±0.00 |
0.02±0.00 |
- |
|
ED (%) |
25.85±0.52 |
24.71±0.93 |
23.17±0.71 |
0.179 |
|
Complete ration |
||||
|
a (%) |
12.88±1.15b |
12.28±0.91b |
9.99±1.01a |
0.008 |
|
b (%) |
52.53±0.30a |
52.56±0.85a |
54.01±1.06b |
0.042 |
|
a+b (%) |
65.41±1.19b |
64.84±0.63ab |
64.00±2.05a |
0.040 |
|
c (/h) |
0.03±0.00 |
0.03±0.01 |
0.04±0.01 |
0.125 |
|
ED (%) |
29.61±1.15 |
29.59±2.27 |
28.89±2.47 |
0.578 |
Note: P1 = 60% Napier grass + 40% concentrate, P2 = 50% Napier grass + 50% concentrate, P3 = 40% Napier grass + 60% concentrate. Kinetic of parameters: a (%) = soluble fraction (readily degradable), b (%) = potentially degradable fraction, a+b (%) = total degradable fraction, c (/h) = degradation rate of fraction b, ED (%) = effective degradability. Means in the same row with different superscripts differ significantly (P<0.05).
Napier grass had a much larger soluble fraction (a: 13.67–15.56%) than corn, reflecting the presence of soluble sugars and easily degradable cell content. However, the potentially degradable fraction (b) was lower (39.92–47.27%), consistent with the high fiber and lignin content that limits microbial access. The highest b value was observed in P1 (47.27%), significantly higher than P2 and P3 (P < 0.05). The total degradable fraction (a+b) reached 55–62%, while the ED value was low (23–26%) and did not differ significantly between treatments.
Complete ration kinetic parameters show intermediate characteristics between corn and Napier grass. The soluble fraction (a) ranges from 10–13%, with P3 showing a significantly lower value (9.99%) than P1 and P2 (P < 0.01). The potentially degradable fraction (b) was 52–54%, with P3 being higher than P1 and P2 (P < 0.05). Consequently, the total degradable fraction (a+b) ranged from 64.0–65.4% and differed slightly between treatments (P < 0.05). The degradation rate constant (c) was 0.03–0.04 h⁻¹, not significantly affected by diet. The ED of the complete ration averaged 29%, with no significant treatment effects. Among the feeds, corn had the highest degradation potential, Napier grass the lowest, and the complete ration was in the middle.
The OM degradability of corn showed a low soluble fraction (a) ranging from 4.71–6.05%, while the degradable fraction (b) was consistently high (75.81–78.36%). The total degradation fraction (a+b) exceeded 80%, confirming the high fermentability of corn OM (Table 6). The degradation rate constant (c) ranged from 0.06–0.08 h⁻¹, with no significant differences between treatments. However, ED differed significantly (P < 0.01), with the highest value in P1 (47.60%), moderate in P2 (44.66%), and the lowest in P3 (40.25%).
Table 6: Kinetic of organic matter degradation of tested feeds.
|
Kinetic coefficient |
P1 |
P2 |
P3 |
P value |
|
Corn |
||||
|
a (%) |
4.82 ± 1.35 |
4.71 ± 0.70 |
6.05 ± 2.04 |
0.086 |
|
b (%) |
75.81 ± 2.00 |
78.36 ± 1.68 |
75.87 ± 1.87 |
0.137 |
|
a+b (%) |
80.63 ± 1.05 |
83.07 ± 1.76 |
81.92 ± 0.45 |
0.267 |
|
c (%/h) |
0.08 ± 0.01 |
0.07 ± 0.00 |
0.06 ± 0.00 |
0.100 |
|
ED (%) |
47.60 ± 1.77c |
44.66 ± 1.06b |
40.25 ± 1.23a |
0.008 |
|
Napier grass |
||||
|
a (%) |
14.98 ± 1.12 |
16.14 ± 1.23 |
14.54 ± 0.94 |
0.499 |
|
b (%) |
47.66 ± 1.95 |
44.15 ± 2.80 |
42.05 ± 4.46 |
0.149 |
|
a+b (%) |
62.64 ± 2.97 |
60.30 ± 1.82 |
56.59 ± 5.38 |
0.302 |
|
c (%/h) |
0.02 ± 0.00 |
0.02 ± 0.01 |
0.02 ± 0.01 |
0.500 |
|
ED (%) |
26.30 ± 1.54b |
24.73 ± 2.48b |
22.09 ± 0.72a |
0.026 |
|
Complete ration |
||||
|
a (%) |
10.98 ± 0.63 |
11.00 ± 1.26 |
10.17 ± 0.60 |
0.510 |
|
b (%) |
52.84 ± 0.15b |
52.62 ± 0.70b |
45.28 ± 0.19a |
0.001 |
|
a+b (%) |
63.82 ± 0.51b |
63.62 ± 1.92b |
55.45 ± 0.58a |
0.017 |
|
c (%/h) |
0.03 ± 0.00 |
0.03 ± 0.00 |
0.04 ± 0.00 |
- |
|
ED (%) |
27.81 ± 0.59 |
27.22 ± 1.46 |
26.18 ± 0.58 |
0.293 |
Note: P1 = 60% Napier grass + 40% concentrate, P2 = 50% Napier grass + 50% concentrate, P3 = 40% Napier grass + 60% concentrate. Kinetic of parameters: a (%) = soluble fraction (readily degradable), b (%) = potentially degradable fraction, a+b (%) = total degradable fraction, c (/h) = degradation rate of fraction b, ED (%) = effective degradability. Means in the same row with different superscripts differ significantly (P<0.05).
Napier grass showed a large soluble fraction (a = 14.54–16.14%) compared to corn, reflecting its water-soluble carbohydrates and cell solution. The potentially degradable fraction (b) ranged from 42.05–47.66%, with no significant differences between treatments. The total degradable fraction (a+b) was 56–63%. The ED value was low, ranging from 22.09% (P3) to 26.30% (P1), with significant differences between treatments (P < 0.05).
The soluble fraction (a) of the complete ration ranged from 10.17–11.00% and was not affected by treatment. However, the potentially degradable fraction (b) differed significantly (P < 0.01), with P1 and P2 showing higher values (52.6%) than P3 (45.28%). This resulted in a higher total degradable fraction (a+b) in P1 and P2 (63.6–63.8%) compared to P3 (55.45%). The average ED was 27% and did not differ significantly between treatments. Among feed types, corn had the highest OM degradation potential, Napier grass had the lowest, and complete rations were in between.

Kinetics gas production of tested feed
Gas production kinetics were derived from the volume of gas produced at different incubation times, and are expressed in milliliters (mL). The kinetics of corn gas production show a very small soluble fraction (a) ranging from 0.13 to 0.87 mL, and a large potentially degradable fraction (b) of 77–81 mL (Table 7). The total gas production potential (a+b) reached 78–81 mL across all treatments, confirming the high fermentability of corn starch. The gas production rate constant (c) was similar (0.05 h⁻¹) across diets, and the ED was 39.12–41.44 mL with no significant differences.
Table 7: Kinetics of gas production of tested feed.
|
Kinetic gas production |
P1 |
P2 |
P3 |
P value |
|
Corn |
||||
|
a (mL) |
0.13 ± 0.22 |
0.87 ± 0.54 |
0.78 ± 0.56 |
0.158 |
|
b (mL) |
81.06 ± 3.58 |
77.31 ± 5.13 |
79.57 ± 4.74 |
0.702 |
|
a+b (mL) |
81.19 ± 3.76 |
78.18 ± 5.61 |
80.35 ± 5.23 |
0.797 |
|
c (mL/h) |
0.05 ± 0.01 |
0.05 ± 0.01 |
0.05 ± 0.01 |
0.200 |
|
ED (mL) |
39.12 ± 0.98 |
40.87 ± 2.08 |
41.44 ± 1.08 |
0.230 |
|
Napier grass |
||||
|
a (mL) |
1.38 ± 0.16b |
0,31 ± 0.53a |
0,05 ± 0.09a |
0.032 |
|
b (mL) |
25.39 ± 2.60 |
22.01 ± 1.33 |
21.21 ± 0.70 |
0.186 |
|
a+b (mL) |
26.77 ± 2.66 |
22.31 ± 1.81 |
21.26 ± 0.61 |
0.139 |
|
c (mL/h) |
0.04 ± 0.01 |
0.09 ± 0.02 |
0.10 ± 0.01 |
0.013 |
|
ED (mL) |
12.17 ± 0.14a |
14.08 ± 0.43b |
14.23 ± 0.64b |
0.07 |
|
Complete ration |
||||
|
a (mL) |
2.16 ± 0.62 |
2.92 ± 0.46 |
2.75 ± 0.65 |
0.396 |
|
b (mL) |
31.78 ± 4.41 |
33.83 ± 4.11 |
30.53 ± 1.92 |
0.683 |
|
a+b (mL) |
33.94 ± 4.15 |
36.75 ± 4.53 |
33.28 ± 2.48 |
0.654 |
|
c (mL/h) |
0.05 ± 0.01 |
0.05± 0.01 |
0.06 ± 0.01 |
0.900 |
|
ED (mL) |
17.60 ± 0.74 |
19.85± 0.43 |
18.97 ± 0.74 |
0.053 |
Note: P1 = 60% Napier grass + 40% concentrate, P2 = 50% Napier grass + 50% concentrate, P3 = 40% Napier grass + 60% concentrate. Kinetic of parameters: a = soluble fraction (readily degradable), b = potentially degradable fraction, a+b = total degradable fraction, c (/h) = degradation rate of fraction b, ED = effective degradability. Means in the same row with different superscripts differ significantly (P<0.05).
Table 8: Correlation between kinetics in situ degradation and gas production
|
Treatment |
Parameter |
In situ DM |
In situ OM |
Gas |
DM vs Gas |
OM vs Gas |
Interpretation |
|
P1 |
a |
3.61–15.02 |
3.50–16.21 |
0.00–3.42 |
0.19 |
–0.07 |
Very weak |
|
b |
46.49–77.68 |
45.44–78.11 |
20.66–81.89 |
0.98 |
0.99 |
Very strong |
|
|
c |
0.02–0.08 |
0.02–0.09 |
0.04–0.10 |
–0.44 |
–0.46 |
Moderate |
|
|
ED |
25.24–47.46 |
24.79–49.63 |
13.71–43.18 |
0.99 |
0.97 |
Very strong |
|
|
P2 |
a |
4.24–16.72 |
4.23–17.42 |
0.00–2.63 |
0.70 |
0.57 |
Moderate |
|
b |
38.62–80.04 |
40.92–80.00 |
22.56–84.45 |
0.96 |
0.98 |
Very strong |
|
|
c |
0.02–0.07 |
0.01–0.07 |
0.03–0.06 |
0.29 |
0.38 |
Weak |
|
|
ED |
23.92–45.38 |
21.99–45.50 |
12.02–39.90 |
0.99 |
0.98 |
Very strong |
|
|
P3 |
a |
5.42–14.12 |
4.42–15.62 |
0.00–3.44 |
–0.25 |
–0.26 |
Weak |
|
b |
41.81–76.40 |
38.73–77.66 |
20.41–84.96 |
0.98 |
0.98 |
Very strong |
|
|
c |
0.02–0.07 |
0.01–0.06 |
0.04–0.11 |
–0.83 |
–0.84 |
Very strong (negative) |
|
|
ED |
22.51–44.30 |
21.29–41.67 |
13.60–42.50 |
0.98 |
0.99 |
Very strong |
Note: P1 = 60% Napier grass + 40% concentrate, P2 = 50% Napier grass + 50% concentrate, P3 = 40% Napier grass + 60% concentrate. Kinetic of parameters: a (%) = soluble fraction (readily degradable), b (%) = potentially degradable fraction, c (/h) = degradation rate of fraction b, ED (%) = effective degradability, DM = dry matter, OM = organic matter.
Napier grass showed different gas production characteristics with a higher soluble fraction (a) in P1 (1.38 mL) compared to P2 and P3 (0.31 and 0.05 mL, respectively; P < 0.05). The degradable fraction (b) ranged from 21.2 to 25.4 mL with no significant differences between treatments. Total gas potential (a+b) was 21–27 mL, much lower than corn, reflecting the limited fermentability of structural carbohydrates. Interestingly, the degradation rate constant (c) was significantly higher in P2 (0.09 h⁻¹) and P3 (0.10 h⁻¹) compared to P1 (0.04 h⁻¹), suggesting that a concentrate-rich donor diet may have increased microbial activity in the soluble fraction of Napier grass. ED was lowest in P1 (12.17 mL) and higher in P2 and P3 (14 mL) with a significant trend (P = 0.07).
For the complete rations, the soluble fraction (a) was 2.16–2.92 mL, while the potentially degradable fraction (b) was 30–34 mL. Total gas potential (a+b) ranged from 33–37 mL with no significant treatment differences. The rate constant (c) was stable (0.05–0.06 h⁻¹). ED tended to be higher in P2 (19.85 mL) than in P1 and P3 (17.60 and 18.97 mL, respectively) with a near-significant effect (P = 0.053). Across feeds, gas production kinetics confirmed the expected ranking: corn > complete ration > Napier grass.
Correlation between the kinetic degradation and the gas production of the tested feed
The gas produced is inherently correlated with organic matter disappearance because gas is generated from the fermentation of organic matter in the rumen. Because the two methods use different units and measurement principles, the comparison between in situ and gas production results should focus on the similarity of their kinetic patterns (rate and shape of the curves), rather than on any direct numerical comparison between the values. The correlation analysis between in situ degradability (DM and OM) and gas tests showed in Table 8. In all treatments, the slow-degradable fraction (b) and ED consistently showed a very strong positive correlation (r = 0.96–0.99), indicating a high level of agreement between the two methods.
In contrast, the readily degradable fraction (a) showed only weak to moderate correlations, depending on the treatment. At a 50:50 ratio, the correlation was moderate (r = 0.57–0.70), while at 60:40 and 40:60, the correlation was weak or very weak. The rate constant (c) was generally inconsistent, with weak to moderate correlations at the 60:40 and 50:50 ratios, and even a strong negative correlation (r ≈ –0.83 to –0.84) at the 40:60 ratio, indicating an opposite trend between the in situ and gas test results for this parameter.
Overall, the 50:50 forage-concentrate ratio provided the most consistent results, with strong correlations not only for b and ED but also moderate agreement for a. This suggests that in balanced diets, the two methods complement each other better than in diets dominated by forage or concentrate.
DISCUSSION
Feed intake and passage rate
Digesta flow rate decreased as the proportion of forage in the ration increased, reflecting not only the higher cellulose and hemicellulose content of forages but also several physical and physiological mechanisms that regulate rumen passage. Forage-based diets as larger particles and is more fibrous, requiring intensive chewing to achieve the particle size necessary to pass through the reticulo-omasal orifice (Hossain, 2021). This slows the transition of particles from the floating mat layer to the liquid phase, where smaller and denser particles are more easily transported toward the omasum (Kammes and Allen, 2012). In contrast, concentrate-rich diets produce smaller, denser, and more fragile particles move more quickly out of the rumen, thereby accelerating passage rate (Dufreneix et al., 2019).
Rumen stratification further contributes to these dynamics. High-forage diets promote the formation of a fibrous raft that traps gas and large particles, increasing rumen retention time, whereas higher concentrate levels reduce raft formation and enhance mixing, turnover, and digesta transit (Krämer et al., 2013). Physical characteristics such as particle density, fragility, and hydration status also determine whether particles remain in the raft layer or enter the liquid phase. Liquid flow patterns independently affect digesta movement: concentrates stimulate fermentation and increase liquid turnover, which enhances the washout of small particles and solubles through the rumen (Allen, 1997).
Temporal feeding patterns additionally influence passage dynamics. Concentrate-rich diets often lead to larger and more discrete meals, increasing rumen motility and fluid flow, whereas forage-dominant diets result in slower, more continuous intake behaviors that prolong digesta retention (Robles et al., 2007). Taken together, these mechanisms explain why concentrate supplementation increases digesta flow, while higher passage rates reduce the time available for microbial attack, thereby decreasing degradability as measured using the in situ method (Bayat et al., 2007).
Total DMI did not differ significantly among treatments, indicating that cattle adjusted their intake patterns to maintain nutrient supply despite changes in forage-to-concentrate ratios. Treatment P2 resulted in the highest DMI due to the balanced ratio of forage and concentrate. The relatively high fiber content ensures that rumination activity and rumen function are maintained, while the increased protein and energy from concentrates help meet the nutrient requirements of livestock more efficiently. The combination of forage and concentrates in this treatment is not only palatable, but also allows livestock to optimize feed consumption. A 50:50 ratio of forage and concentrate resulted in optimal DMI without disrupting rumen pH stability and microbial fermentation (Chen et al., 2015).
Rate of passage decreased as the proportion of forage in the ration increased. This likely reflects the higher cellulose and hemicellulose content in forages, which slows rate of passage due to increased rumen retention. Increasing the proportion of concentrate feed can effectively improve feed intake and accelerate the flow rate. Higher flow rates can reduce degradability in the rumen (Firkins 2021) as measured using the in situ method.
Rumen conditions and fermentation products
The fermentability balance of the ration plays an important role in maintaining rumen conditions that support the formation of biohydrogenation intermediates, including CLA. Rations with adequate proportions of forage are able to create a more stable rumen environment that is conducive to CLA formation (Anzhany et al., 2022). The rumen pH values obtained in this study were slightly higher than the optimal rumen pH value according to Suharti et al. (2018) in the range of 6.6-6.9. Despite the slightly higher pH values compared to the normal range, the rumen pH values in this study indicate all treatments sustained a favorable condition for microbial activity, without any signs of acidosis. The slight increase in P2 may indicate a more balanced fermentation between forage and concentrate, while lower pH in P1 and P3 may reflect dominance of fiber or starch fermentation, respectively. However, the differences were small, confirming that all diets maintained rumen conditions suitable for cellulolytic and amylolytic microbes.
Total bacterial populations were not significantly affected by treatments, indicating that the rumen microbiota maintained a stable population under varying forage-to-concentrate ratios. This is thought to be related to the relatively similar DM content between treatments, which can provide a balanced nutrient substrate for microbial growth, especially bacteria (Saragih et al., 2018). Amylolytic bacteria tended to be higher in P2, reflecting the availability of starch substrate. In contrast, cellulolytic bacteria were relatively stable across treatments. This is related to the crude fiber content between treatments, which shows relatively similar values and therefore does not trigger significant changes in the cellulolytic bacteria population. As long as sufficient fiber is available in the feed, the cellulolytic bacteria population tends to remain stable in the rumen (Xie et al., 2018).
Protozoal populations were higher in P2 and P3, consistent with their preference for concentrate-rich diets and higher starch availability. Protozoa are known to be sensitive to dietary shifts and their higher numbers in concentrate-based diets may be associated with greater starch fermentation and hydrogen transfer for methanogenesis (Jouany, 1994). Despite these changes, forage-to-concentrate ratios did not significantly affect NH3 and total VFA concentrations in the rumen. In contrast, Manatbay et al. (2014) explained that a lower forage ratio significantly increased NH3 and total VFA concentrations compared to higher forage in an in vitro study. This may be due to the rumen ecosystem’s ability to adjust to changes in the roughage-to-concentrate ratio through adjustments in rumen microorganisms (Chen et al., 2015) so that overall fermentative activity was similar across diets.
The pattern of VFA production across treatments reflects substrate availability. Higher acetate levels in P1 and P3 correspond to greater fermentation of fibrous and non-fibrous carbohydrates, respectively, while the higher propionate concentration in P1 suggests enhanced glucogenic fermentation when the forage proportion is greater. A low acetate/propionate ratio indicates that P2 has low methane production and high feed efficiency. The higher the acetate/propionate ratio, the lower the feed efficiency (Hikmawan et al., 2019). The lowest acetate/propionate ratio was found in P2, which created optimal fermentation in the rumen and low methane emissions.
The lowest methane production was observed in P2, suggesting that the P2 diet with a balanced forage-concentrate ratio not only improves microbial balance but also reduces methane production. This is consistent with the low acetate and butyrate values in P2 reflecting lower hydrogen capture and methane potential, and the higher acetate and butyrate values in P1 and P3 likely increasing hydrogen availability for methanogenesis (Tenzin et al., 2022).
A balanced 50:50 diet (P2) increased amylolytic activity, a more favorable acetate to propionate ratio, and the potential for reduced methane production without disrupting total bacterial populations or overall fermentation activity. These findings support the hypothesis that a moderate ratio of forage and concentrate provides optimal rumen conditions for animal performance and environmental sustainability.
Degradability of tested feed
Rapid degradation in corn reflects its high starch content, which provides an easily fermentable substrate for rumen microbes. A previous study (Jemiman et al., 2025) has also reported that concentrates are easily digestible, thereby stimulating microbial growth and enhancing the fermentation process in the rumen, which is consistent with the findings of this study. In contrast, the low degradability of Napier grass is consistent with its high Neutral Detergent Fiber (NDF) and lignin content, which restrict microbial attachment and enzymatic hydrolysis (Van Soest, 1994). The minimal differences among treatments indicate that the forage-to-concentrate ratio of donor animals had a limited influence on the degradation of such fibrous feeds, as fiber digestion is primarily constrained by structural properties rather than microbial environment. For the complete rations, the intermediate degradation pattern arises from the mixture of starch and fiber-rich components. The higher concentrate levels (P3) may increase passage rate and reduce the time available for microbial colonization of fibrous particles, thereby lowering ED.
These findings indicate feed composition is the dominant factor determining in situ degradation kinetics. The forage-to-concentrate ratio of donor animals had a limited impact on corn and Napier grass degradability but appeared to influence the degradability of complete rations, likely through its effect on passage rate. The reduced degradation in P3 supports the hypothesis that faster passage associated with concentrate-rich diets lowers the degradability measured in situ.
Kinetics of DM and OM degradation in situ
The soluble fraction (a) of the feed mainly consists of starch (Rosmalia et al., 2022). Although cornmeal is rich in starch, cornstarch does not dissolve in cold water because it consists of linear and helical amylose and branched amylopectin (Cornejo et al., 2018), resulting in low solubility. The soluble fraction in DM and OM in this study was lower than that reported by Despal et al. (2022). The OM degradability pattern of corn parallels that of DM, indicating that the 60:40 ratio of forage-to-concentrate provided more favorable rumen conditions for starch fermentation, possibly due to a balance between sufficient retention time (the longest flow rate among the treatments) and microbial activity. In contrast, the higher proportion of concentrate in P3 may have accelerated passage rate, reducing the time available for complete starch degradation despite similar degradation potential. This observation is consistent with the slow but nearly complete degradation pattern of starch reported by Getachew et al., (2004).
DM and OM degradability in Napier grass have the larger soluble fraction (a) reflects the presence of water-soluble carbohydrates and other easily fermentable components, but lower potentially degradable fraction (b) indicating that while soluble carbohydrates are readily fermented, the overall degradation is constrained by fiber structure and lignification. Napier grass is rich in crude fiber consisting of hemicellulose, cellulose, lignin, and silica. The bonds between hemicellulose and cellulose with lignin make it difficult for rumen microbial enzymes to digest (Cornejo et al., 2018), thereby reducing degradation potential and effective degradation. The lower ED observed in P3 suggests that higher concentrate diets in donor animals may reduce fiber-attached microbial populations or shorten rumen retention time, thereby limiting fiber degradation. Similar patterns have been reported in tropical forages where high lignin content restricts microbial access (Van Soest, 1994).
In complete rations, the balance of forage and concentrate in the ration influenced the kinetic parameters in DM and OM degradability, like partitioning between soluble (a) and potentially degradable fractions (b), but had a limited impact on the overall ED remained stable. This reflects a compensatory relationship between rapidly and slowly degradable components in complete ration. The values were lower than those reported by Despal et al. (2022) in situ study with dairy cattle.
Across feeds, corn had the highest degradation potential, Napier grass the lowest, and complete rations were intermediate, as expected from their nutrient composition. These results support the hypothesis that rumen passage rate, modulated by dietary forage-to-concentrate ratio, has a critical role in determining ED measured by the in situ method (Ørskov and McDonald, 1979; Van Soest, 1994).
Kinetics gas production of tested feed
Gas production is a good indicator for assessing digestibility, fermentation, and microbial protein production (Rodriguez et al., 2015). A higher proportion of concentrate in the ration indicates better nutrient availability for rumen microbes (Elghandour et al., 2014). This result indicates that the highest effective degradation values for corn and napier grass were obtained in treatment P3 (highest concentrate ratio), and the highest complete ration degradation values were obtained in treatment P2 (medium concentrate ratio). Meanwhile, an increase in fiber content due to an increase in the proportion of forage can have a negative effect on microbial growth and fermentation due to a reduction in readily available energy and protein as well as structural carbohydrate content in the ration (Elghandour et al., 2015), which causes a decrease in the digestibility and fermentation of the ration (Kumar et al., 2013). In this study, the lowest effective degradation value in all tested feeds was found in treatment P1.
The gas production kinetics of the tested feeds were relatively consistent across dietary treatments, suggesting that the in vitro gas test reflects the intrinsic fermentability of feed substrates. Unlike the in situ method, where ED values varied significantly (Tables 5–6), gas production kinetics were less influenced by rumen passage rate, as also reported by Blümmel et al. (1997). The lower total gas potential of Napier grass reflects the limited fermentability of its structural carbohydrates. Interestingly, higher degradation rate constants in P2 and P3 indicate that concentrate-rich donor diets may enhance microbial activity on soluble fractions of Napier grass. This pattern suggests that donor animals receiving more concentrate provide rumen inoculum with greater fermentative capacity toward fibrous feeds.
The slightly higher ED of complete rations in P2 supports the notion that a balanced 50:50 forage-to-concentrate ratio yields optimal rumen inoculum for complete ration fermentation, consistent with the stable gas production profile but differing from the in situ degradability trend (Tables 5–6). Moreover, the gas test results demonstrated greater stability across donor diets compared with in situ degradability, supporting the hypothesis that in vitro gas production is less affected by rate of passage and more reflective of intrinsic feed fermentability (Menke and Steingass, 1988).
Correlation between the kinetic degradation and the gas production of the tested feed
The very strong correlations observed for parameter b and ED across all treatments highlight that gas production kinetics are closely aligned with in situ degradability when evaluating the slowly degradable fraction and ED. These parameters are critical for predicting ruminal fermentation and nutrient availability, suggesting that the gas test can reliably substitute or complement the in situ method in these aspects. In line with the research by Guadayo et al. (2019), ED values ranged from 0.92 to 0.98, indicating that the gas production method can be used to estimate ED values in situ. This study supports the current results, emphasizing that the gas production technique can reliably estimate the degradability potential of feeds evaluated through in situ incubation.
However, the inconsistent results for parameter a (rapidly degradable fraction) and c (rate constant) indicate that gas production may not fully capture the dynamics of the soluble and fractional degradation rates measured in situ. The strong negative correlation of c at the 40:60 treatment suggests that increased concentrate levels may alter fermentation patterns in ways that are differently reflected by the two techniques. Among the tested treatments, the 50:50 forage-to-concentrate ratio provided the most stable correlations across parameters indicating that a balanced rumen environment allows both methods to express degradability potential consistently.
These findings confirm our hypothesis that ED determined by the in situ method is influenced by rumen passage rate, while the in vitro gas test reflects intrinsic feed fermentability and remains relatively stable across dietary conditions. Consequently, integrating both techniques provides complementary perspectives for accurately evaluating feed degradability under varying rumen environments. Therefore, the 50:50 ratio can be recommended as a suitable basal diet for fistulated cattle in comparative degradability studies.
CONCLUSION
The forage-to-concentrate (F:C) ratio influenced rumen passage rate and the ED of feeds measured by the in situ method. Higher concentrate levels accelerated rate of passage and reduced ED, while diets rich in forage slow transit rate and increase ED. The balanced 50:50 F:C ratio provided the most stable rumen environment, linking moderate passage rate with optimal fermentation conditions. An important new finding is that the in situ method is highly sensitive to movement rate, while in vitro gas tests reflect intrinsic fermentability and remain consistent across treatments. Overall, the 50:50 F:C ratio offers the most efficient and balanced rumen fermentation profile.
ACKNOWLEDGEMENT
The authors declare that this manuscript has not been published or submitted elsewhere. All authors have contributed significantly and agree with the content of the manuscript. All authors agree to the conditions outlined in the copyright assignment form. The Indonesian Ministry of Education funded this study within the scheme of Higher Education-Master Thesis Research (PPS-PTM) Program with contract number 23271/IT3.D10/PT.01.03/P/B/2025.
Novelty Statement
This study demonstrates that dietary forage-to-concentrate ratio alters rumen passage rate and consequently affects effective degradability measured by the in situ method, whereas in vitro gas production kinetics are comparatively less influenced by passage rate and primarily reflect the intrinsic fermentability of feed substrates. The strong agreement between the two methods for the slowly degradable fraction and effective degradability, together with their differing responses for soluble and degradation-rate fractions, highlights their complementary value in feed evaluation. The findings also indicate that a balanced 50:50 forage-to-concentrate ratio provides a suitable rumen environment for comparative degradability assessment.
Author’s Contribution
Balqis Naila Ath-Thifa carried out the experimental work, performed the laboratory analyses, and prepared the initial draft of the manuscript. Despal conceived and supervised the study, provided methodological guidance, contributed to data interpretation, and critically revised the manuscript. Heri Ahmad Sukria contributed to the study design, data validation, and interpretation of the findings. Muhammad Naufal Farras provided technical supervision, oversaw the experimental procedures, and ensured methodological accuracy. Yasmin Azizah and Selphie Rahmatantri assisted with sample preparation, laboratory analyses, and data collection. All authors reviewed, revised, and approved the final version of the manuscript.
Ethical approval
The cannulation surgery of animals was carried out by a licensed veterinarian and followed the protocol for handling and care of animals according to the IPB University Animal Ethics Committee.
Generative AI and AI assisted technology statement
The authors declare that no generative AI and AI assisted technology was used in the creation of this manuscript.
Conflict of interest
The authors have declared no conflict of interest.
Figures

A: Dry matter (DM) and organic matter (OM) degradation profiles of corn (A), Napier grass (B), and complete rations (C) that underwent ruminal incubation: , P1 DM; , P2 DM; ï´, P3 DM; +, P1 OM; ×, P2 OM; o, P3 OM.
References
- In vitro gas production was determined using the method of Close and Menke (1986). Feed samples (230 mg DM) were incubated in 100-mL calibrated glass syringes with 30 mL of buffered rumen fluid. Rumen fluid was collected before morning feeding, filtered through four layers of cheesecloth, and mixed with Menke’s buffer in a 1:2 (v/v) ratio under continuous CO₂ flushing. Incubations were conducted at 39 °C, and gas volume was recorded at 0, 3, 6, 9, 12, and 24 h. Gas production parameters were fitted to the exponential model: G = a + b × (1 − e−ct) where a represents the gas from the soluble fraction, b the gas from the insoluble but fermentable fraction, and c the rate constant of gas production. Gas production kinetics, which represent the feed degradation process, were used as a reference for in situ (nylon bag) degradation.
Services
Article usage statistics
Loading…