
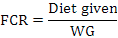
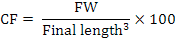
The effect of varying salinity levels (15‰ to 40‰ with 5‰ increment) on growth, feed efficiency and meat quality of red tilapia, Oreochromis sp. (mean body weight 5±0.07g) were investigated. Juveniles of red tilapia were randomly distributed into seawater tanks (60 cm × 30 cm × 45 cm each). Ten fish were stocked in each tank with 2 replications. Fish were fed with commercial floating pellet (35% protein) at 3% body weight per day for 40 days. Results showed that fish growth was significantly (P<0.05) higher in term of weight gain, WG % of initial weight, mean daily WG, SGR, feed conversion and survival rate from 15‰ to 30‰ salinity than those reared in 35‰ and 40‰ salinity. Condition factor was found to be significantly higher on 40‰ salinity than 15‰ to 35‰ salinity. Feed conversion ratio remained non-significant in all salinity levels. Present study proves that red tilapia can be reared up to 30‰ salinity to get optimum growth and maximum survival rate. Biochemical analysis of fish meat showed that moisture, protein, lipid, ash and crude fiber were not significantly (P>0.05) affected by salinity level. The hematological parameters like hematocrit, cholesterol and plasma triglycerides were similar among fish fed on different salinity level (P < 0.05).
Research Article · Volume 50, Issue 2, 24 January 2018 · Open Access
Impact of Different Salinity Levels on Growing Performance, Food Conversion and Meat Quality of Red Tilapia (Oreochromis sp.) Reared in Seawater Tanks
· · · ·
Affiliations & Notes ⌄
- 1Centre of Excellence in Marine Biology, University of Karachi, Karachi, Pakistan 2Livestock and Fisheries Department, Directorate of Fisheries, Govt. of Sindh, Pakistan 3Department of Life Sciences, The Islamia University of Bahawalpur, Bahawalpur, Pakistan 4Department of Earth, Environment and Life Sciences, University of Genoa, Italy , * Corresponding author: ghulamabbas@uok.edu.pk
Article Info ⌄
- Journal:
- Pakistan Journal of Zoology
- Published:
- 24 January 2018

Abstract
The full text of this article is available as a PDF — use Download PDF above.
Figures





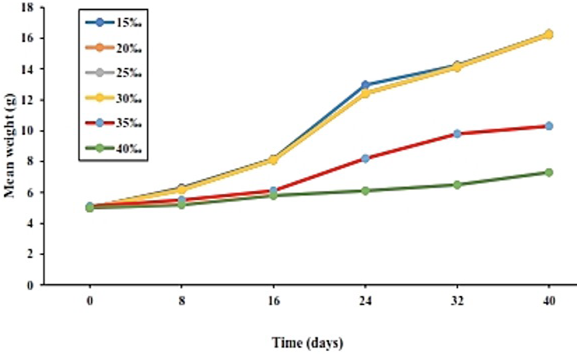
Relationship between mean fish weight and time for fish reared at different salinity level.
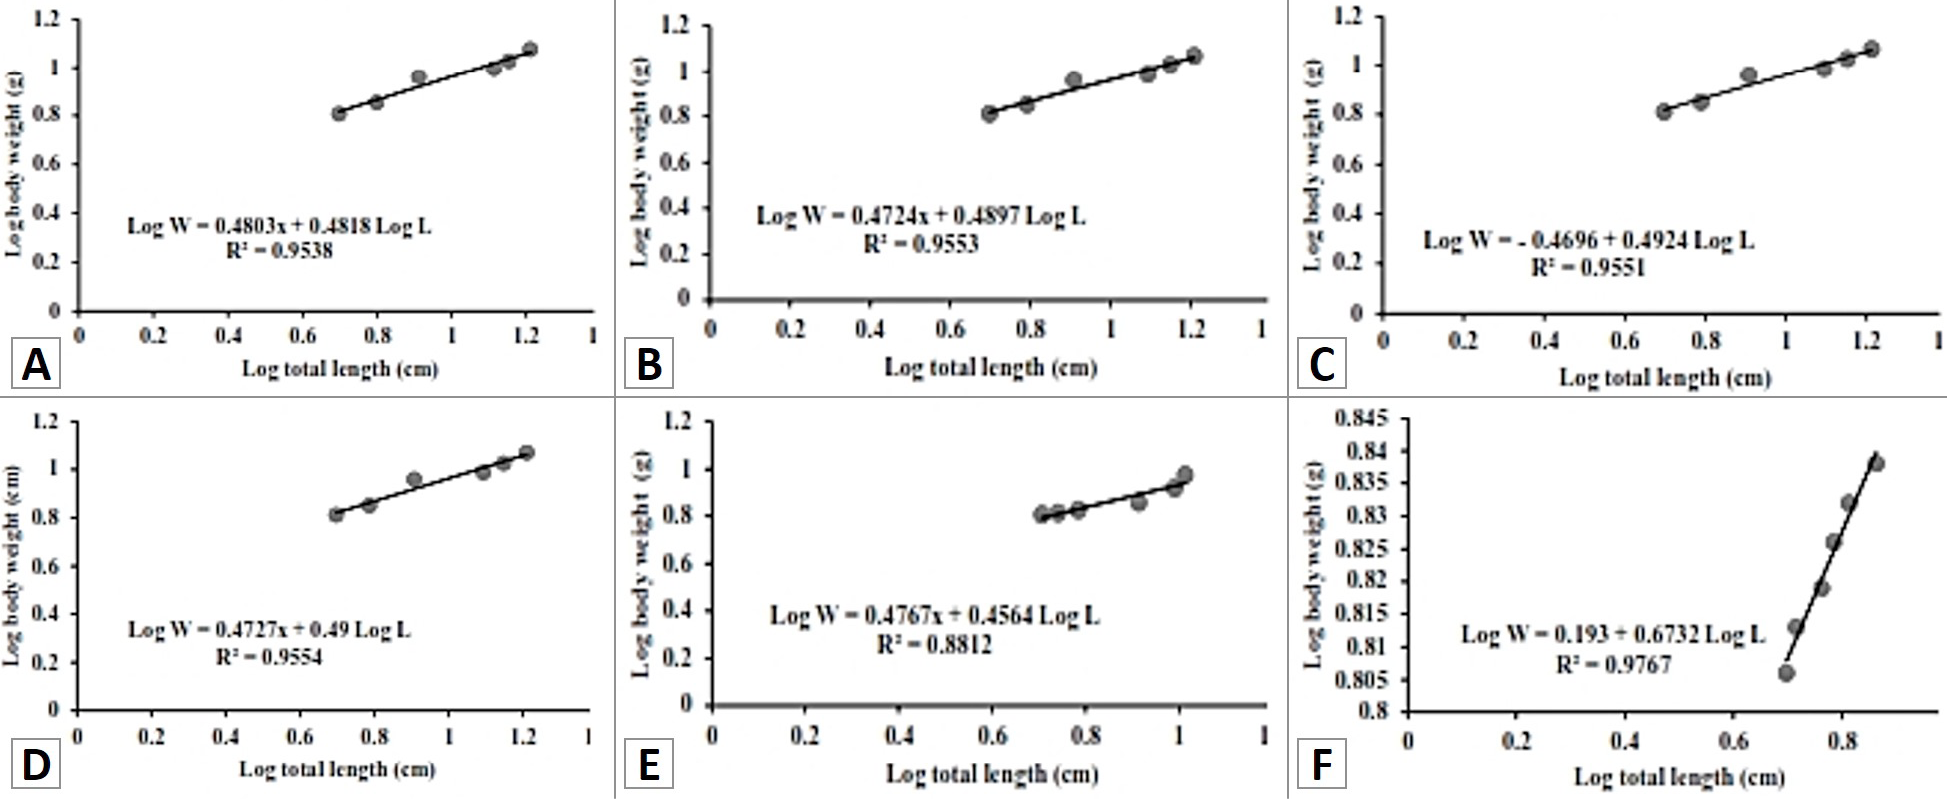
Length-weight relationship of red tilapia fingerlings Oreochromis sp. reared on different salinity levels (A, 15‰; B, 20‰; C, 25‰; D, 30‰; E, 35‰; F, 40‰).
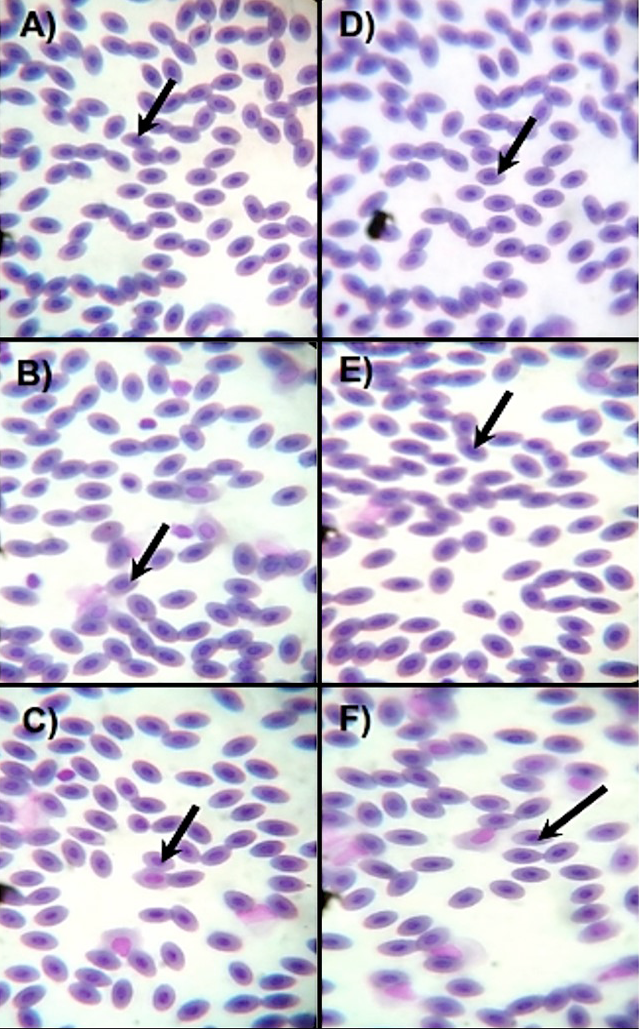
Blood smear of red tilapia fingerlings Oreochromis sp. reared on different salinity levels (A, 15‰; B, 20‰; C, 25‰; D, 30‰; E, 35‰; F, 40‰). Arrow, micronucleus (Giemsa stained: 1000X).
Cited by 1 article
In journals published by ResearchersLinks.
Services
Article usage statistics
Loading…