
To evaluate the genotypic effect on glucose homeostasis in chickens, we conducted the oral glucose tolerance test, and insulin sensitively test (OGTT and IST) in the fast- (FG) and slow- (SG) growing broilers. Each of 120 one-day-old males was raised in 10 batteries, respectively. In the OGTT test, ten broilers on d 42 fasted 12 h from each stock were randomly assigned into two groups: glucose and vehicle, respectively. The glucose group received a glucose syrup by oral gavage (2 g/kg BW), while the vehicle group received an equivalent volume of normal saline. In the IST test, twelve chickens on d 70 fasted 12 h from each stock were assigned into four groups, respectively. Each of 3 birds was injected with human insulin at the dosage of 40, 60, and 80 µg/ kg BW via intraperitoneal injection, respectively. In both trials, the blood glucose concentration was determined at 0, 10, 20, 40, 60, 120, and 180 min through small brachial blood vessels. As a result, the blood glucose of both group was increased immediately after being treated with glucose and reached peaks at 20 min, then recovered to the normal at 60 min. Birds treated with glucose had greater blood glucose concentration and area under the curve (AUC) in SG than those of FG (P > 0.05). Administration of insulin at 40 and 60 µg/kg BW dramatically decreased blood glucose level in FG but didn’t affect SG. And at 40 µg/kg BW insulin administration, FG had lower blood glucose than SG (P < 0.05). These results suggested that the growth speed greatly affects oral glucose tolerance and hypoglycemic response to exogenous insulin in chickens.
Short Communication · Volume 54, Issue 2, 27 January 2022 · Open Access
Glucose Homeostasis Differed in the Fast- and Slow- Growing Chickens (Gallus domestics)
· · · · · · ·
Affiliations & Notes ⌄
- 1Farm Animal Genetic Resources Exploration and Innovation Key Laboratory of Sichuan Province, Sichuan Agricultural University, Chengdu, Sichuan Province, P. R. China. 2Institute of Animal Nutrition, Key laboratory of bovine low carbon farming and safe production, Sichuan Agricultural University, Ya’an, 625014 Sichuan, P. R. China 3Department of Livestock Production, Shaheed Benazir Bhutto University of Veterinary and Animal Science Sakrand 67210, Sindh Pakistan. 4Department of Pharmacy, College o
Article Info ⌄
- Journal:
- Pakistan Journal of Zoology
- Published:
- 27 January 2022

From the article
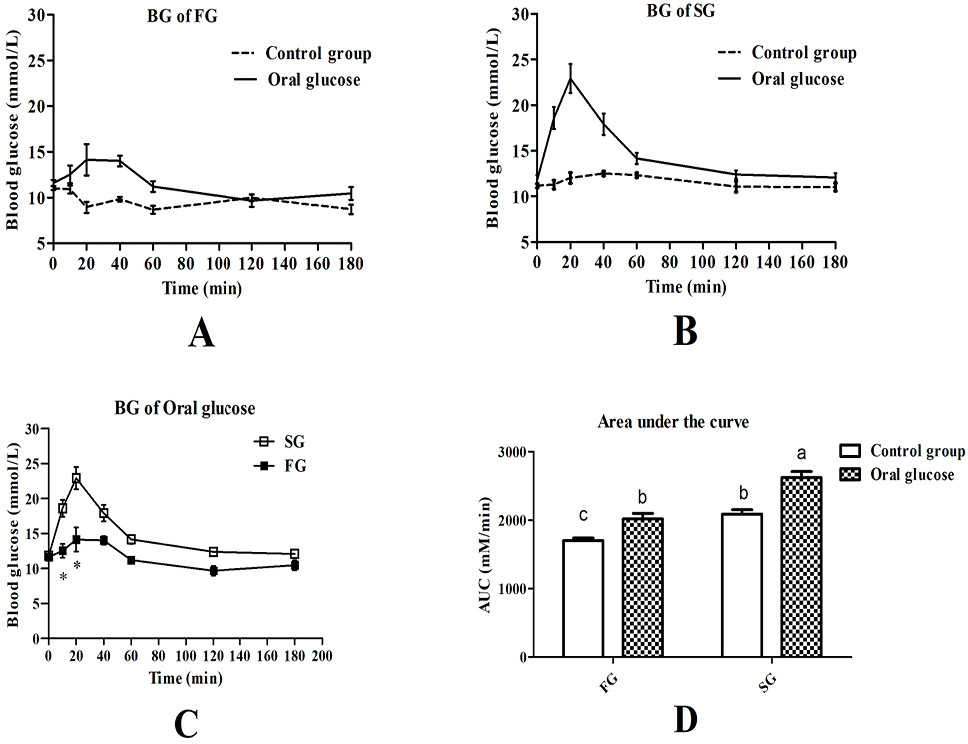
- The slower- growing chickens had significantly higher blood glucose than the faster- growing ones at 10 and 20 min when treated with oral glucose (P < 0.05, Fig. 2C).
- There was a significant effect genotype by treatment on the area of blood glucose curve; the glucose treated slow- growing chickens had the highest blood glucose than other groups (P < 0.05, Fig. 2D).
- The blood glucose increased from 0 to 10 min after insulin injection and then decreased from 20 to 180 min (Figs. 3A and 3B).
- The slower- growing birds have greater efficiency in dietary glucose absorbing and blood glucose clearing than the faster- growing ones, whereas the faster- growing birds are more sensitive to the exogenous insulin than their counterparts.
Selected from the article's own text.
Abstract
Materials and methods
All procedures for raising and slaughtering chickens were approved by Institutional Animal Care and Use Committee of Sichuan Agricultural University. The methods were conducted according to the approved rules.
In this experiment two stocks with different genetic backgrounds were used, Cobb 500, a fast-growing stock, introduced from the Branch Company of Chia Tai Group, Chengdu, China; HS1, a slow- growing line selected five generations for meat-production at the Poultry Farm of Sichuan Agricultural University. The HS1 is originated from the cross between a Hungary Babolna layer and a local breed from Guangdong provinces in China. It has black shanks, and the plumage of males and females are red and yellow, respectively. The growth charts of the two stocks were displayed in Figure 1. For each stock, a total of 120 one-day-old male chicks were randomly assigned into 10 groups, which were raised in batteries with a wire mesh floor and were provided feed and water ad libitum. Chickens were fed the same corn-soy pellet diet throughout the experiment duration. The diet contains 3,015 kcal energy/kg and 21.4 % crude protein to d 28; 3,100 kcal energy/kg crude protein and 19.9 % crude protein from d 29 to 42, and 3,180 kcal energy/kg and 18 % crude protein from d 43 to 70. There was continuous light during the first 3 d post-hatch, and the light: dark photoperiod was then gradually decreased to 18:6 by d 28. The next lighting program was 15 h from d 29 to 35 and then reduced to 10 h by d 70. The light intensity was 20 Lux to d 28 after which it was decreased to 5 Lux. During the first 7 days after hatch, the room temperature was maintained at 37℃, and it was maintained at 30℃ from d 8 to 14, and then gradually decreased to 20℃ by d 35. The light intensity was 20 Lux to d 28, and 5 Lux from d 29 to 70.
For oral glucose tolerance test (OGTT) on d 42, ten broilers with body weights verifying from 95 % to 105 % of the average stock body weight were randomly assigned into two groups: glucose (n = 5) and vehicle (n = 5), respectively. After a 12 h fasting (water available), chickens treated with glucose received a glucose syrup by oral gavage (2 g/kg BW; diluted in pure water as 40 % w/v), while chickens treated with vehicle received an equal amount of normal saline.
The blood glucose concentrations were measured after glucose administration at 0, 10, 20, 40, 60, 120, and 180 min through brachial blood vessels and by a handheld glucometer (Agamatrix, Inc., Salem, NH) as described by Zhao et al. (2014). The area under the curve (AUC) of blood glucose was measured according to the following formula.
AUC=1/2 × [X0 × (Y0 + Y1) + X1 × (Y1 + Y2) + … + X n-1 × (Y n-1 + Y n)]
Where X n= time (min), Y n= blood glucose concentration (mmol/L).
For insulin sensitivity test (IST) on d 70, each of 12 chickens fasted for 12 h with BW that ranged within 100 % ± 5 % average stock BW were subjected to insulin sensitively test (IST), respectively. Each of nine chickens was assigned into three insulin dosage groups (n = 3 per group), respectively. The birds were administered human insulin (Novolin® R, Novo Nordisk Pharmaceuticals Co., Ltd.) with the dosage of 40, 60, and 80 µg/ kg BW (Group T1, T2, and T3) by intraperitoneal injection (diluted in 1 × phosphate buffer solution, PBS). The other 3 birds were assigned into the vehicle treatment group, which received an equal amount of PBS (the Control). The blood glucose was measured after administration of insulin at 0, 10, 20, 40, 60, 120, and 180 min in both insulin and vehicle groups.
The ANOVA model used for blood glucose consisted of the main effects of stock, treatment, and the two-way interactions between them. All data were analyzed using the GLM procedure of JMP Pro v.10 (SAS Institute). When the F test was significant, Tukey’s test was further applied for multiple comparison analysis; significance was considered at P < 0.05.
Results
The results for the OGTT show significant effects of stock, treatment, time point, and the two-way interactions between them for blood glucose (P < 0.05) (Fig. 2). At 20 min after treatment, blood glucose of the treated groups was higher than the control (P < 0.05, Figs. 2A and 2B). The slower- growing chickens had significantly higher blood glucose than the faster- growing ones at 10 and 20 min when treated with oral glucose (P < 0.05, Fig. 2C). In addition, with the time passing by, blood glucose of the faster- growing stock increased slowly from 0 to 40 min after glucose treatment (Fig. 2C), while for the slower- growing stock blood glucose rose from 0 to 20 min sharply (Fig. 2C), and then decreased rapidly from 20 to 60 min (Fig. 2C). There was a significant effect genotype by treatment on the area of blood glucose curve; the glucose treated slow- growing chickens had the highest blood glucose than other groups (P < 0.05, Fig. 2D). Meanwhile, the treated group had a larger area under the curve (AUC) than the control while AUC was larger for the slower-growing birds than the faster- growing ones (P < 0.05, Fig. 2D).
For IST test, the blood glucose and AUC for both stocks treated with three insulin dosages are shown in Figure 3. Treatment, time point, and stock have significant influence on chicken blood glucose (P < 0.05). The blood glucose increased from 0 to 10 min after insulin injection and then decreased from 20 to 180 min (Figs. 3A and 3B). The difference between the control and insulin injection groups for blood glucose was significant in the faster- growing stock (P < 0.05, Fig. 3A) but not in the slower- growing stock (P > 0.05, Fig. 3B). Meanwhile, slower- growing birds had higher blood glucose than the faster- growing ones at 180 min with a low dose of insulin injection (P < 0.05, Fig. 3C). Furthermore, there was no significant difference among the insulin injection groups for blood glucose in the faster- growing chickens (P > 0.05, Fig. 3A), whereas the high-level insulin injection group had lowest blood glucose among the three insulin injection groups in slower- growing ones (P < 0.05, Fig. 3B). As shown in Figure 3D, the AUC of low-level insulin dosage group (40 mg/kg BW) was smaller than the control in the faster- growing stock (P < 0.05) but not in the slower- growing one (P > 0.05).
Discussion
There were significant differences in insulin sensitivity and glucose clearance rate between the hypophagic low weight and hyperphagic high weight lines of chicken ; . The low weight selected chickens responded more quickly to the glucose bolus and insulin treatment than the high weight selected .
In the present study, the OGTT results are in line with the results of previous studies. We found a higher peak in the slower-growing chickens than the faster- growing ones at 20 min post oral glucose treatment and the slower- growing birds quickly cleaned the blood glucose and reached the normal blood levels within 60 min post-gavage. Thus the slower- growing birds, like the low weight selected lines have greater efficiency in dietary glucose absorbing and blood glucose clearing. Pancreas, as a key endocrine organ of insulin, its relative weight (ratio of absolute pancreas weight to body weight) was heavier in low weight selected chickens than in high weight selected lines on both days 65 and 56 . Four glucose regulatory genes Preproinsulin, Preproglucagon, Glucose transporter 2, and Pancreatic duodenalhomeobox 1 expressed greater in low weight selected chicken pancreas than high weight selected one ; . Thus we deduce that there may be also pancreas physiology difference between the faster- and slower-growing chickens and it results in the oral glucose treating differences between them.
However, faster- growing chickens, unlike the high weight selected birds with insulin resistance , have more sensitive response than the slower-ones to the exogenous insulin. Their blood glucose dropped greatly after 20 min being accepted intraperitoneal injection with a slightly increase at first 10 min. The increased blood glucose after insulin injection probably was a stress response in birds. Tokushima et al. (2005) reported exogenous insulin stimulation increased the 2-deoxy-d-[1-3H] glucose uptake in soleus, extensor digitorum longus and pectoralis superficialis muscles. There are insulin receptors on the cell membrane surface of myofibers . In the present study, faster-growing chickens are more sensitive to the exogenous insulin partly because they have larger muscle weight, compared with the slower- growing ones. In our previous study, we found a huge weight difference between the faster- and slower- growing chickens. At d49, after the time we did glucose tolerance test, their breast muscle weights were 169.88±6.44 g (faster-) vs 43.49±1.76 g (slower-); leg muscle weights were 131.74±5.89 g (faster-) vs 56.18±2.16 g (slower-). On d70 we did insulin sensitive test, their breast muscle weights were 302.91±21.06 g (faster-) vs 89.09±3.47 g (slower-); leg muscle weights were 257.03±21.86 g (faster-) vs 131.34±4.81 g (slower-).
Conclusion
In summary, the growth speed greatly affected oral glucose tolerance and hypoglycemic response to exogenous insulin in chickens. The slower- growing birds have greater efficiency in dietary glucose absorbing and blood glucose clearing than the faster- growing ones, whereas the faster- growing birds are more sensitive to the exogenous insulin than their counterparts.
Acknowledgements
The authors would like to thank Paul B Siegel from Department of Animal and Poultry Sciences, Virginia Polytechnic Institute and State University, USAand Wei Zhang from Department of Animal and Avian Sciences, University of Maryland for their great comments on the paper.
This work was supported by the Natural Science Foundation (Number: 31872347) and Sichuan Science and Technology Plan Project (2019YFN0001) and Chengdu Science and Technology Project (2019-YF05-01351-SN).
Statement of conflict of interest
The authors have declared no conflict of interest.
Figures
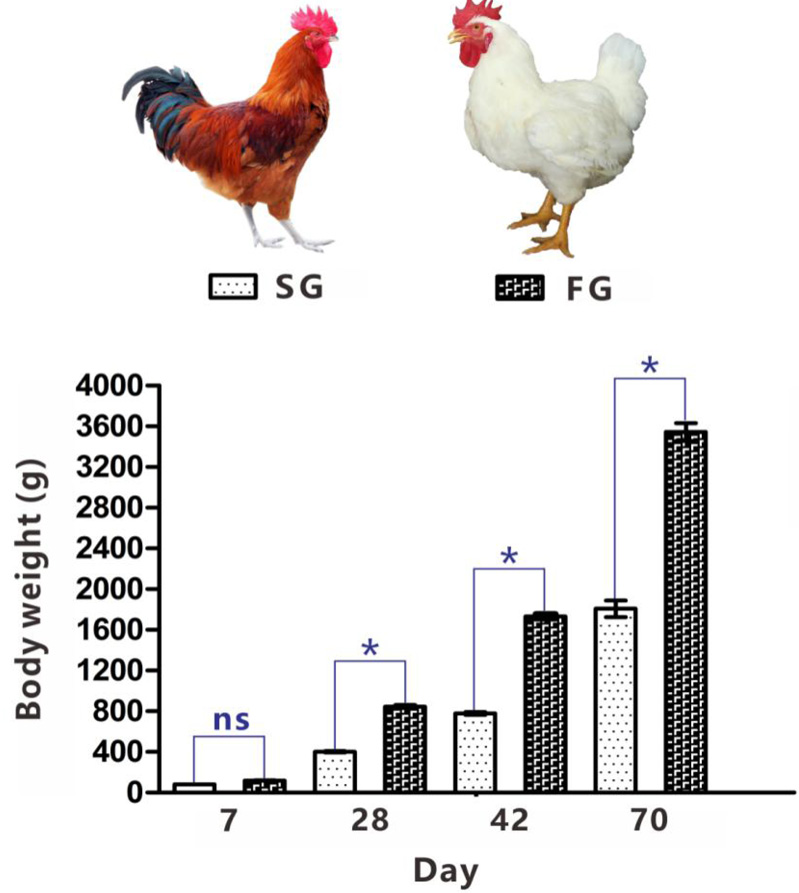
The body weights of faster- and slower- growing chickens (abbreviated as FG and SG) on d 7, 28, 42, and 70. They differed significantly on 28, 42, and 70, respectively. FG weights twice as much as SG on d 42 and 70, respectively. Standard deviations were shown as bars on columns.
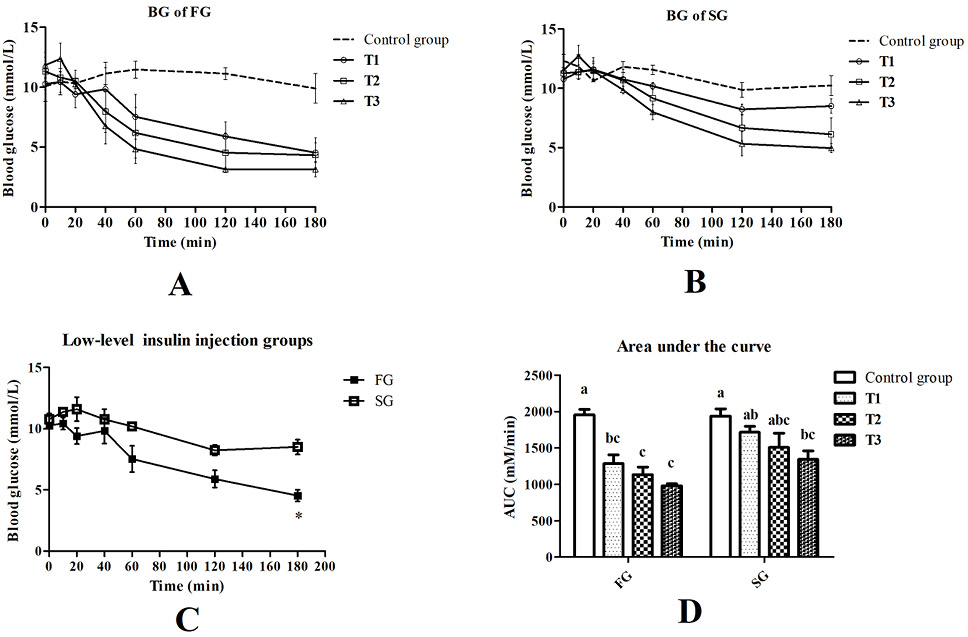
Blood glucose concentrations of the birds administered insulin. Mean ± standard error mean for 3 birds at each time point. (A) The blood glucose of faster- growing stock (FG) after phosphate buffer saline (PBS) and insulin injection within 180 min, respectively. (B) The blood glucose of slower- growing stock (SG) after phosphate buffer saline (PBS) and insulin injection within 180 min, respectively. (C) The blood glucose of FG and SG with insulin injection (40 mg/kg) within 180 min, respectively. When significant, differences between FG and SG chickens are indicated: * P < 0.05. (D) Glucose areas under the curve (AUC) for two stocks within 180 min. Means without a common lowercase differed significantly (P < 0.05). Control group, group with PBS injection; T1, 40 mg/kg BW insulin injection; T2, 60 mg/kg BW insulin injection; T3, 80 mg/kg BW insulin injection.
References
- Braun, E.J, and Sweazea, K.L., 2008. Comp. Biochem. Phys. B., 151: 0-9. https://doi.org/10.1016/j.cbpb.2008.05.007[CrossRef]
- Hu, H., Wei, Y., Wang, D., Ni, S., Chen, X., Zhao, Y., Liu, G, and Yang, Y., 2018. Rsc. Adv., 8: 2485-2489. https://doi.org/10.1039/C7RA11347A[CrossRef]
- Rice, B.B., Zhang, W., Bai, S., Siegel, P.B., Cline, M.A, and Gilbert, E.R., 2014. Gen. Comp. Endocr., 208: 1-4. https://doi.org/10.1016/j.ygcen.2014.08.010[CrossRef]
- Scanes, C.G, and Braun, E., 2012. Front Biol., 8: 134-159. https://doi.org/10.1007/s11515-012-1206-2[CrossRef]
- Simon, J., Guillaumin, S., Chevalier, B., Derouet, M., Guy, G, and Marche, G., 2000. Br. Poult. Sci., 41: 424-429. https://doi.org/10.1080/713654969[CrossRef]
- Simon, J., Rideau, N., Taouis, M, and Dupont, J., 2011. Gen. Comp. Endocriol., 171: 267-268. https://doi.org/10.1016/j.ygcen.2011.02.025[CrossRef]
- Sumners, L.H., Zhang, W., Zhao, X., Honaker, C.F., Zhang, S., Cline, M.A., Siegel, P.B, and Gilbert, E.R., 2014. Comp. Biochem. Physiol. A., 172: 57-65. https://doi.org/10.1016/j.cbpa.2014.02.020[CrossRef]
- Tokushima, Y., Takahashi, K., Sato, K, and Akiba, Y., 2005. Comp Biochem Physiol. B., 141: 43-48. https://doi.org/10.1016/j.cbpc.2005.01.008[CrossRef]
- Zhang, W., Kim, S., Settlage, R., Mcmahon, W, and Sumners, L.H., 2015. Neurogenetics, 16: 133-144. https://doi.org/10.1007/s10048-014-0435-8[CrossRef]
- Zhang, W., Sumners, L., Siegel, P.B., Cline, M.A, and Gilbert, E.R., 2013. Physiol. Genom., 45: 1084-1094. https://doi.org/10.1152/physiolgenomics.00102.2013[CrossRef]
- Zhao, X., Sumners, L.H., Gilbert, E.R., Siegel, P.B., Zhang, W, and Cline, M., 2014. Poult. Sci., 93: 617-624. https://doi.org/10.3382/ps.2013-03551[CrossRef]
Services
Article usage statistics
Loading…