
The heart of learning genetics is in realizing that how the likelihood of inheriting a particular trait can be predicted. This fundamental approach is the basis for plant and animal breeding to get desired varieties as well as performing genetic analysis including prediction of patterns of inheritance in family lines and to calculate the recurrence risk for relatives etc. Punnett square is used to describe the possible combinations of paternal and maternal alleles for a particular cross. Described here is a line-dot method using ternary genotype codes to determine genotype probabilities in a very quick and simple way. Also ternary genotype codes along with gender symbols and affection status are used to modify the Punnett squares. On applying these modified Punnett squares along polygonal shapes covers all possible parental combinations and their genotypic and phenotypic outcomes in offspring. In this way, simple illustrations incorporate a considerable amount of information that provides the opportunity to determine genotype and phenotype probabilities for monogenic Mendelian traits without the need to draw Punnett square for every parental genotype combination. These illustrations provide information for both forward (phenotype to genotype) as well as reverse genetics (genotype to phenotype) approaches.
Research Article · Volume 49, Issue 5, 13 August 2017 · Open Access
Genotype and Phenotype Probabilities by Ternary Code based Line-dot Method and Polygonal Illustrations
Affiliations & Notes ⌄
- 1Department of Bioinformatics and Biotechnology, Faculty of Basic and Applied Sciences, International Islamic University, H-10, Islamabad, Pakistan , * Corresponding author: imran.shabbir@iiu.edu.pk
Article Info ⌄
- Journal:
- Pakistan Journal of Zoology
- Published:
- 13 August 2017

From the article
- In conclusion, a straight forward and self explanatory way to illustrate genotype and phenotype probabilities is presented in the form of polygonal illustration.
- The purpose of this communication is not to provide just another alternative to Punnett squares or forked line method but to provide a way by which significant amount of information can be composed in a limited space in the form of simple illustrations.
- This method and polygonal illustrations are simple and easy as well as provide ready-to-use reference for genetic counselors, researchers, teachers and students of genetics.
- With the help of polygonal illustrations, prediction can be done in either direction as reverse genetics (genotype to phenotype prediction) or forward genetics (phenotype to genotype).
Selected from the article's own text.
Abstract
Introduction
Genetic conditions caused by a mutation in a single gene follow predictable patterns known as Mendelian inheritance. This inheritance is classified based on whether it is autosomal or sex-linked and whether it is following a dominant or recessive pattern. Punnett square approach is most commonly used to predict an outcome of a particular cross or breeding experiment (Bateson et al., 1906; Punnett, 1907). It provides a rundown of every possible arrangement of one maternal allele with one paternal allele for any locus/gene being studied in the cross. With reference to genotype on a single locus, there are twenty five different parent unions possible in nuclear pedigrees, six for each of autosomal dominant, autosomal recessive, X-linked dominant, X-linked recessive (6+6+6+6 = 24) and one for Y-linked inheritance pattern. Genetic literature including books generally describes only one or two combinations whereas other combinations can be drawn as required (Strachan and Read, 2010). To knowledge, no approach has been found in literature that provides a quick prediction of genotypic and phenotypic outcome of a particular cross for Mendelian inheritance without the need to draw genotype symbols from both parents through Punnett squares or alternative forked-line method.
This communication attempts to incorporate a good deal of genotype and phenotype probability information in the form of different illustrations. For this purpose, a number of approaches are employed which include i) Numeric coding of parental and offspring genotypes to simplify the symbolic representation, ii) A very quick “line-dot method” is described to draw genotype outcomes which is then elaborated into “line-dot hexagon” (Ld-hex), iii) Modifying Punnett squares with numeric coding and incorporating symbols to describe gender and affection status, iv) “Ternary coded genotype probability groups” that are also described in the form of “basic genotype hexagon” (bG-hex) (Figs. 1, 2). Finally, three polygonal illustrations are described including “detailed genotype hexagon” (dG-hex) (Fig. 3), “genotype-to-phenotype hexagon” (G2P-hex) (Fig. 4) and “phenotype-to-genotype square” (P2G-sq) (Fig. 5) that describe the genotype and phenotype probabilities for monogenic Mendelian inheritance.
Materials and Methods
Numeric/ternary coding
A ternary numeric code for representing genotypes was generated as 0 (having no allele affected), 1 (having one allele affected) and 2 (having both alleles affected) (Fig. 1A).
Line-dot method
To draw offspring outcomes from a parental cross using ternary numeric code, a method is described which uses line(s) drawn on four dots. For this purpose, line(s) are drawn vertically (for the first crossing parent) and horizontally (for the second crossing parent) according to their ternary genotype code written left to right. The genotype can be determined by counting number of lines passing through any dot (Fig. 1B).
Punnett square modifications
Punnett square representations were modified to contain more information with the help of ternary genotype codes written outside an appropriately sized square along its four corners. Also four gender symbols were incorporated inside the square to illustrate the appearance of affection status in a particular gender wherever apply. These gender symbols may be empty (normal), having a dot inside (carrier), dark filled (affected), lightly filled (affected for dominant mode and carrier for recessive mode) to represent the occurrence of a respective phenotype (Fig. 1C).
Numeric genotype probability groups
The genotype from the ternary coded Punnett square can also be written in straight line in numeric form by representing parents’ genotype (Pr and Ps) on the sides and possible genotype outcomes in four offspring (O) in the middle as [1—2110—1] (Fig. 1C, D). As there are six different cross combinations possible between parents on the basis of genotype, six distinct genotype probability groups are named G0, G1, G2b, G3, G4 and G2s representing [0—0000—0], [0—0011—1], [1—2110—1], [1—1122—2], [2—2222—2] and [0—1111—2], respectively (Fig. 1D). The genotype groups are named based on number of affected alleles shared by both parents (r + s) (Fig. 1D). Group G2 involve two affected alleles either each one of them coming from one parent so ‘both’ parents are involved (G2b) or two affected alleles coming from a ‘single’ parent (G2s) (Fig. 1D).
Avoiding diagonal shift of genotypes
The order of genotype of parents when written for a particular cross (e.g., F x M), if reversed as (M x F) cause diagonal shift of genotypes of offspring between the upper right side and lower left side of the Punnett square (Fig. 1E). This may lead to wrong interpretation of results, so this is avoided in the polygonal illustrations by using arrows, arrow heads and/or considering only one type of writing combination.
Polygonal illustrations
In order to provide information of all possible parental genotype combinations and their genotypic outcomes in offspring, different polygonal illustrations are described. These illustrations include line-dot hexagon (LD-hex) (Fig. 2A), basic genotype hexagon (bG-hex) (Fig. 2B), detailed genotype hexagon (dG-hex) (Fig. 3), genotype-to-phenotype hexagon (G2P-hex) (Fig. 4) and phenotype-to-genotype square (P2G-sq) (Fig. 5) that describe the genotype and phenotype probabilities for Mendelian inheritance.
Results and Discussion
Ternary numeric coding, line-dot approach and modified Punnett squares
Ternary numeric coding described in this communication works on the basis of number of affected allele(s) that constitute a genotype. Codes ‘0’ and ‘2’ represent homozygotes for normal and affected alleles, respectively. However, code ‘1’ represents a heterozygote with one affected allele. By this notion, it simplifies the genotype representation for autosomal as well as sex-linked inheritance by only using three numerals 0, 1 and 2 instead of two letter or other complex genotype symbols (Fig. 1A). Using these codes, the line-dot method describes a simple and quick way to find genotypic outcomes for offspring. Each dot represents a 25% (or ¼) chance of genotypic outcome in offspring. The number of lines passing through any dot represents the respective genotype (Fig. 1B). It can provide a quick numerical way of solving a Punnett square which was further modified to incorporate ternary codes and gender symbols with affection status (Fig. 1C).
As described in genotype probability groups (Fig. 1D), there are six possible parent unions on the basis of genotype as [0—0], [0—1], [—], [1—2], [2—2] and [0—2]. However, when writing three more combinations [1—0], [2—1], and [2—0] of the underlined groups are possible making them total of nine. In order to describe all nine possible parental crosses, hexagonal shapes are used with parent symbols along with respective genotype code connected by a marriage line. The offspring outcomes are described along the marriage line (Figs. 2, 3, 4). Also, in writing a particular cross, the order of parent genotype is important and reversing the order leads to diagonal genotype shift (Fig. 1D) that can mislead especially with ternary coded genotypes. To solve this problem, in the “hexagonal illustrations”, arrows or arrow heads are used to differentiate e.g., [0—1] as[ 0 → 1] and [1—0] as [1 → 0] (Figs. 2, 3, 4). However, in the “square illustration”, genotype shift is also avoided by always considering parent’s genotypes in the only order of (smaller genotype code x larger genotype code) or (n x N) for autosomal and (Father’s genotype code x Mother’s genotype code) or (F x M) for sex-linked inheritance (Fig. 5). Arrow heads are also added in order to further ease this consideration, so the direction of the arrow describes which parent is considered to be written first for a particular cross (Fig. 5).
Polygonal illustrations
For line-dot method, only one cross is elaborated in Figure 1B and rest of all possible combinations are presented along a line-dot hexagon (Ld-hex) (Fig. 2A) and their equivalent ternary coded Punnett square outcomes are described in simple genotype hexagon (sG-hex) (Fig. 2B). sG-hex is then further improved to detailed genotype hexagon (dG-hex) to incorporate autosomal (external hexagon) as well as sex-linked (internal hexagonal space) parent combinations and offspring outcomes (Fig. 3). Offspring genotype outcome is presented along the respective arrow head on the marriage line between two parent symbols when both parents have different genotype to avoid wrong interpretation due to diagonal shift of genotypes in offspring.
In genotype-to-phenotype hexagon (G2P-hex), along with genotypes, phenotypes are presented in the form of symbols depending upon dominant or recessive form of autosomal and sex-linked inheritance. The phenotypes described here assumes dominant-recessive model with full penetrance, however any other outcome including non-penetrance, co-dominance or incomplete dominance etc. can be easily imagined (Fig. 4).
G2P-hex also effectively describes why dominant mode does not skip any generation (because all kinds of parent unions involving at least one affected allele result in affected offspring) whereas recessive mode tend to skip generations (because of possibility of producing all normal offspring though carriers of disease in 0—1 and 0—2 parent unions in autosomal recessive and F1—M0 union in X-linked recessive modes). However, in dominant inheritance, generation skipping may occur due to non-penetrance (Fig. 4).
Genotype probability groups described in Figure 1D also represent all six sides of the hexagonal illustrations. All marriage lines with similar genotype combination from both parents that are parallel to each other belong to one group that lead to overall same genotypic outcome in offspring irrespective of gender, mode of inheritance or phenotypic outcomes. However, the group G4 [2—2222—2] exist only for autosomal inheritance and is not possible for sex-linked inheritance because male cannot be homozygous for either X or Y chromosome except if there is a chromosomal abnormality (Figs. 3, 4).
Another polygonal illustration, Phenotype-to-genotype square (P2G-sq) initiates with a square in the center of the illustration representing four marriage lines among normal and/or affected parents and incorporates all possible four parent phenotype combinations. Then each parent union is represented with all possible combinations of having a particular genotype in them and possibility of having a respective genotype and phenotype in their offspring (Fig. 5).
Probability calculation
The probability calculation from these illustrations is straight forward as each cross is described with four offspring each one of them with ¼ or 25% risk of having any genotype and thus associated phenotype. For example, in the genotype group G3 [1—1122—2], half (¼ + ¼ = ½) of offspring will be heterozygous (1) and remaining half (¼ + ¼ = ½) will be homozygous (2) for affected allele. However on the phenotype account, considering dominant trait, all (100%) offspring will be affected being either (1) or (2) whereas for recessive trait, there will be 50% chance of being affected (2) and 50% chance of being normal but carrier of affected allele (1) (Figs. 1D, 3, 4, 5).
Forward and reverse genetics approaches
The difference between forward and reverse genetic approaches is the order of studying genotype and phenotype. If the Phenotype is known and responsible genotype is explored, it is forward genetics (Phenotype → Genotype = P2G). On the other hand, Reverse genetics is when genotype is known and resulting phenotype is determined (Genotype → Phenotype = G2P). In this work, P2G-sq follow the forward approach describing the possible phenotypes of both parents first and then all possibilities of having a causative genotype in them as well as respective genotype and phenotype probabilities in offspring. However, G-hex follows the reverse genetic approach providing all the possibilities of parent combinations with known genotype and predicts the offspring genotype outcomes. Further, G2P-hex describes the possible phenotypes with respect to known genotypes in parents and offspring. Determining genotype and phenotype probabilities is important in genetic counseling, linkage analysis as well as in genetic evaluation programs. The probability determination described here will simplify the observation of genotype and phenotype for a particular monohybrid cross and assessment of risk of each offspring carrying a trait under study. These polygonal illustrations will be a useful tool for genetic counselors, researchers, teachers and students of genetics.
Potential applications
In essence, the methods and illustrations described in this communication tend to simplify the observation of genotype and phenotype probabilities for monogenic Mendelian inheritance. Described here are some of the potential benefits and applications:
Simple and easy to use
Line dot method and genotype probability grouping simplifies the Punnett squares and are self explanatory. With proper understanding and practice, monohybrid crosses can be solved in mind without need to draw on the paper. For example, any cross between two heterozygotes (Aa x Aa) can be coded to (1 x 1) and using line-dot method or following the genotype probability group G2b = [1—0112—1] will effectively tell that with each parent sharing genotype 1, ¼ or 25% offspring will be of genotype 0, ¼ + ¼ = ½ or 50% offspring will be of genotype 1 and remaining ¼ or 25% will be of genotype 2 (Fig. 1).
Reverse genetics-genotype to phenotype prediction
Genotype information can be effectively translated into phenotype by using G2P-hex (Fig. 4). For example, for an autosomal disorder, one parent is homozygous with normal alleles (0) and other parent is homozygous with affected alleles (2). One can find a cross (0 x 2) in the outer hexagon (for autosomal inheritance) where parent with genotype 0 will be normal and that of 2 will be affected. In this cross all the offspring will carry one affected allele with genotype 1. Therefore all the offspring will be affected or normal carriers considering autosomal dominant and autosomal recessive modes of inheritance, respectively (Fig. 4).
Forward genetics-phenotype to genotype prediction
Starting from parent’s phenotype, one can easily predict possible genotype and phenotype probabilities in offspring. Suppose a parental cross where father is affected and mother is normal for X-linked recessive disorder. In the P2G-sq (Fig. 5), this kind of parental cross lie on the right side of the central phenotype square showing normal mother on upper side and affected father on lower side joined vertically by marriage line. Along this cross on the right side are provided all possible genotypes that conform to the parental phenotype as well as genotype and phenotype outcomes possible in offspring for different possible modes of inheritance. For this example (X-linked recessive disorder), one can see two kinds of possible crosses under the label XR (Fig. 5). In both of these crosses, father is having genotype 1 having its only X chromosome mutated for the responsible gene. However, mother being normal can be either 0 or 1 on genotype account. If mother’s genotype is 0, offspring outcomes will be (all daughters = carriers, all sons = normal) and if mother’s genotype is 1, offspring outcomes will be (half daughters and sons = affected, remaining half of daughters and sons = normal with daughters carriers of disease).
Genetic counseling
These illustrations are particularly useful for genetic counselors because all possible parent unions with respect to genotype and phenotype and their outcomes in offspring are already provided in a self explanatory way. So these illustrations can be helpful in calculating the genotypic and phenotypic probability of a particular disorder following any Mendelian pattern of inheritance.
Pedigree analysis and inheritance prediction algorithm
These methods and illustrations provide basis for pedigree analysis/inheritance prediction and can be translated into such algorithm using bioinformatics’ approaches. The ternary genotype coding can be used to simplify the genotype labels.
Conclusion
In conclusion, a straight forward and self explanatory way to illustrate genotype and phenotype probabilities is presented in the form of polygonal illustration. The purpose of this communication is not to provide just another alternative to Punnett squares or forked line method but to provide a way by which significant amount of information can be composed in a limited space in the form of simple illustrations. These illustrations provide a quick reference to determine outcome of any parental cross. It has also been observed that with basic understanding and a little practice of line-dot method, the monohybrid crosses can be solved in mind without even writing on paper. Currently, the line-dot method has been provided for monogenic Mendelian traits; however, it can be extended for multigene traits. This method and polygonal illustrations are simple and easy as well as provide ready-to-use reference for genetic counselors, researchers, teachers and students of genetics. With the help of polygonal illustrations, prediction can be done in either direction as reverse genetics (genotype to phenotype prediction) or forward genetics (phenotype to genotype). Also, ternary coding can be used to simplify the genotype labels in bioinformatics based approaches. Based on these illustrations, pedigree analysis and/or inheritance prediction algorithm can also be designed. Further studies are required to elaborate the full potential of these methods and polygonal illustrations.
Acknowledgements
The author wishes to thank Shabbir Ahmed, Bushra Shabbir and Faiza Imran for their continuous support and helpful suggestions.
Statement of conflict of interest
Authors have declared no conflict of interest.
Figures
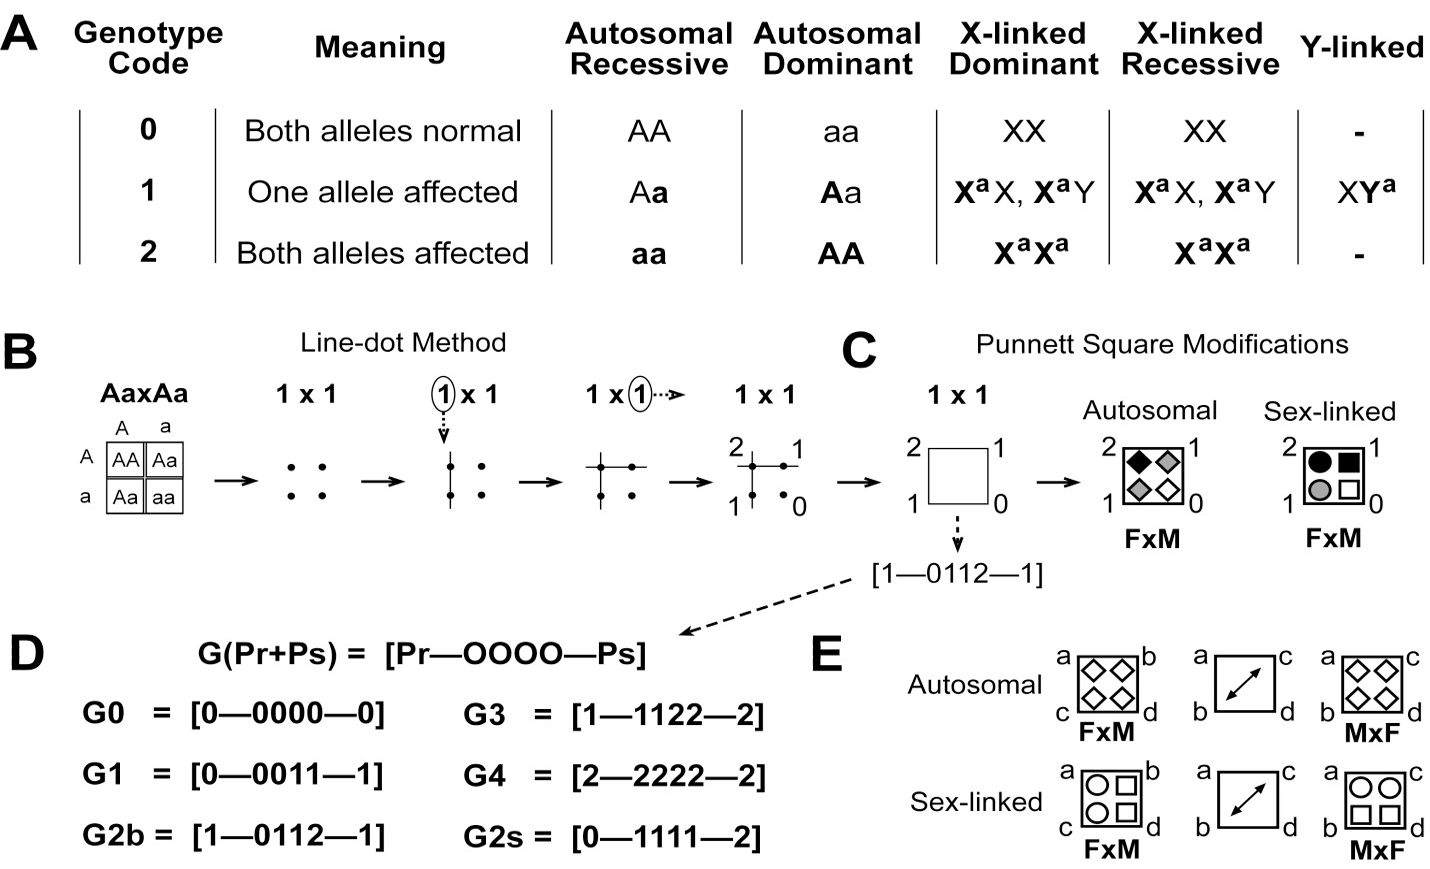
Overview of different approaches used. A, ternary coding for genotypes and their corresponding symbols generally used in literature. Bold symbols are affected alleles; B, line-dot method. Here, dot = 0, one line passing through a dot = 1, two lines passing through a dot = 2; C, Punnett square modifications. Unfilled symbols = normal, filled symbols = affected, light filled symbols = heterozygotes that will be affected for dominant and carrier for recessive conditions; D, ternary coded genotype probability groups. Parents’ genotype codes are on the sides and four offspring codes are in the middle. Group name is based on the total number of affected alleles (Pr and Ps) shared by parents. 2b = total of two affected alleles each allele shared by both parents, 2s = total of two affected alleles which are coming from single parent; E, diagonal shift of genotypes in autosomal and sex-linked outcomes described with diagonal pointing arrow.
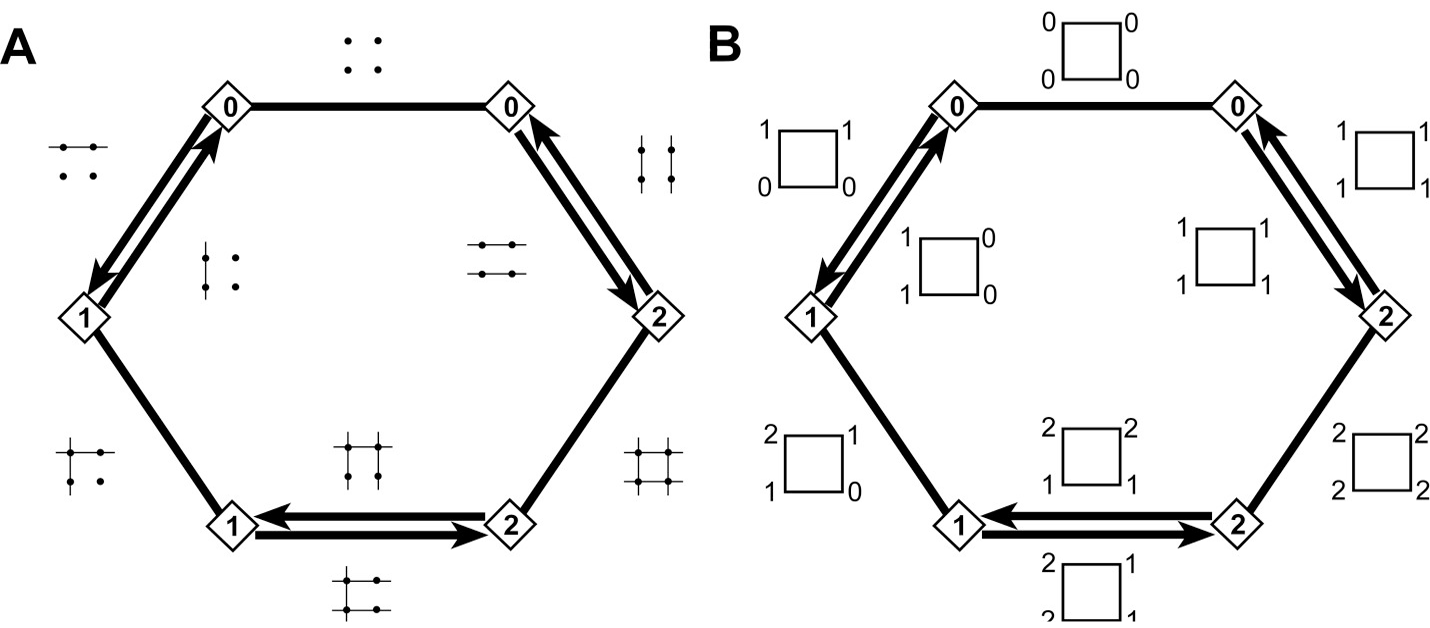
Basic hexagonal illustration approach. Here a line between two parent symbols (rhombus = either sex) represent marriage line as 1—1 means 1 x 1 and where genotype of both parents is different, two different writable crosses are possible as represented by arrows 0→1 = 0 x 1 and 1→0 = 1 x 0 etc. A, line-dot hexagon (Ld-hex) representing the line-dot offspring outcomes of nine possible writable parent genotype combinations. Here, dot = 0, one line passing through a dot = 1, two lines passing through a dot = 2; B, basic genotype hexagon (bG-hex) representing the ternary coded square offspring outcomes of nine possible writable parent genotype combinations.
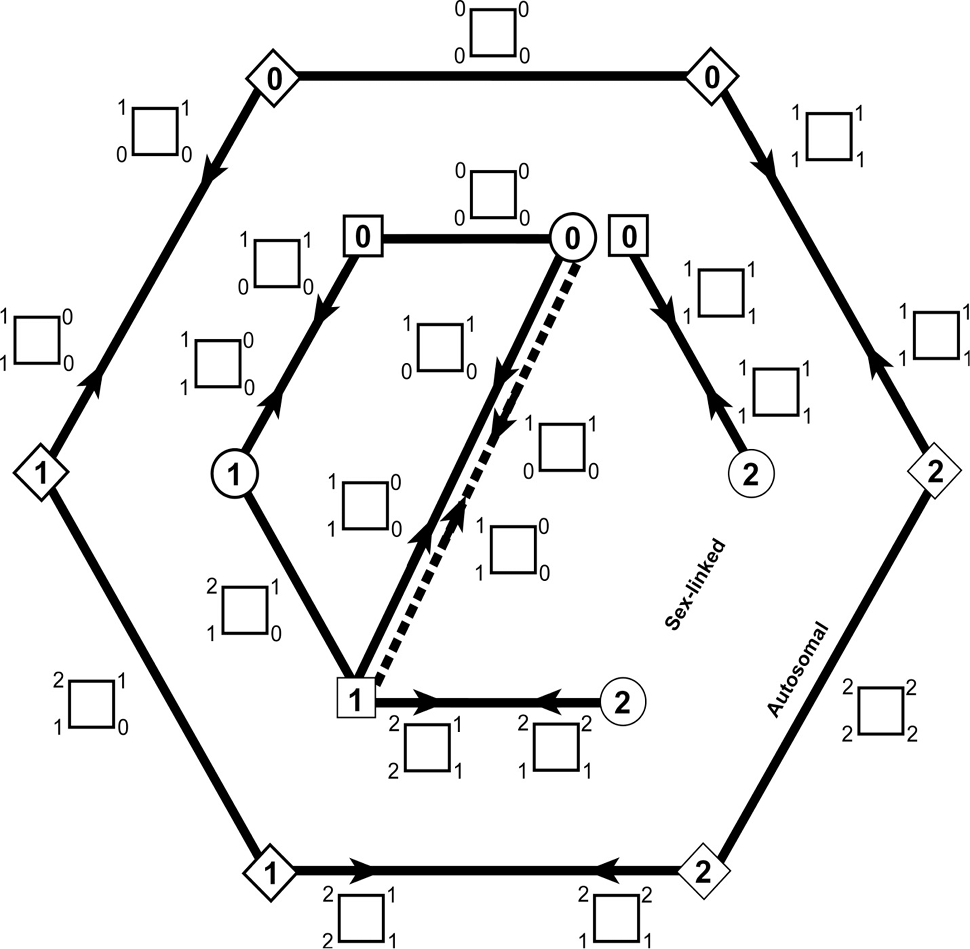
Detailed genotype hexagon (dG-hex) describing the probability of having a certain genotype in offspring after a parental cross. Solid lines in the outer hexagon between two rhombuses (parent with either sex) represent marriage for autosomal inheritance. Solid and dotted lines in the inner hexagon space between square (father) and circle (mother) represent marriage for X-linked and Y-linked inheritance, respectively. Genotype outcome in offspring are represented by ternary coded square along each marriage line. Wherever genotype code of both parents is different, two different writable crosses are possible so respective ternary coded square is represented along the relevant arrowhead. e.g., for a parental cross 0 x 1, the offspring outcomes are written along the arrow head near the parent 0 in the 0→1 direction.
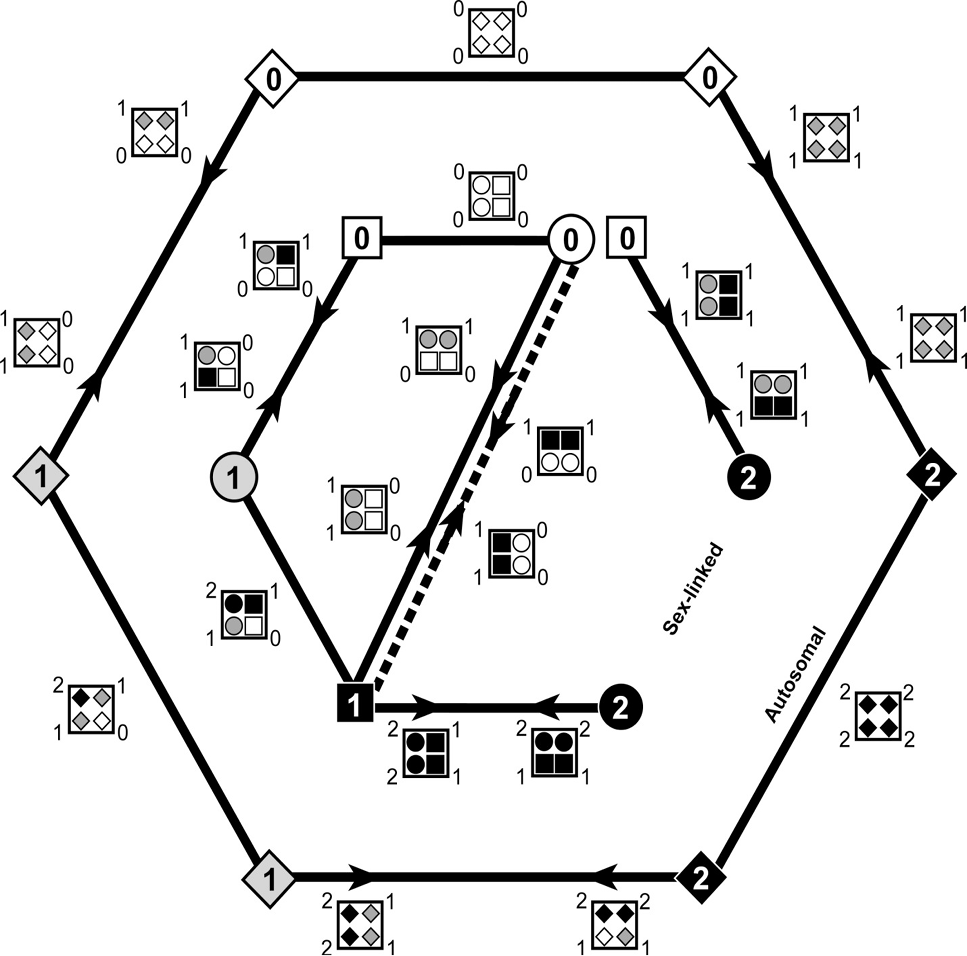
Genotype-to-phenotype hexagon (G2P-hex) describing the probability of all possible genotypic along with phenotypic outcomes for autosomal and sex-linked Mendelian inheritance. The ternary coded square is filled with four gender symbols along with their affection status relative to genotype. Outer and inner hexagons represent genotypic outcomes and associated phenotype for autosomal and sex-linked inheritance, respectively. For inner hexagon solid and dotted lines represent x-linked and y-linked inheritance, respectively. Genotype outcomes are similar as described in dG-hex but for representing affection status, unfilled symbols = normal, filled symbols = affected, light filled symbols = heterozygotes that will be affected for dominant and carrier for recessive conditions.
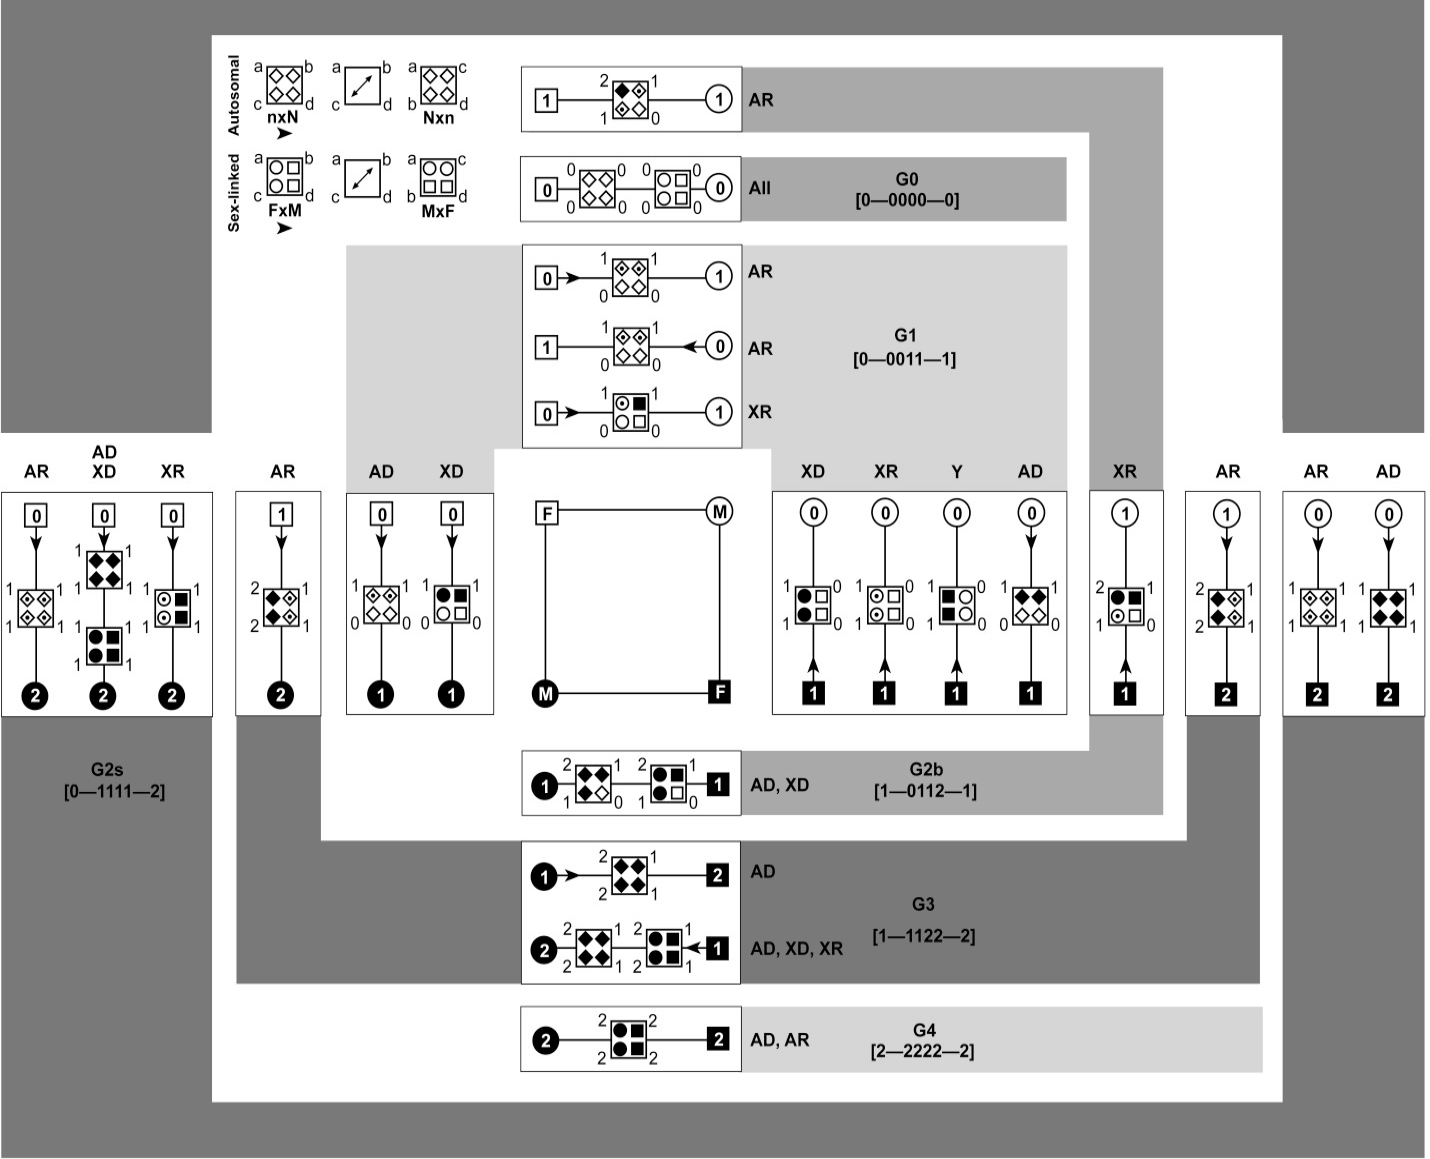
Phenotype-to-genotype square (P2G-Sq) describing four possible parent unions on the basis of phenotype (square in the center) and their possible genotype and phenotype probabilities in parents and their offspring accordingly (along each side of this square). For any Mendelian trait, the genotype and phenotype probabilities will lie on any of the four sides of this central square. Genotypic and phenotypic outcomes in offspring are represented by modified Punnett square in the middle of marriage line between parents. Marriage lines where two modified Punnett squares are present represent the outcomes for both possible autosomal and sex-linked inheritance. Further, all outcomes are explained with respect to genotype probability groups. All parent unions and offspring outcomes connected with a similar shaded region belong to one genotype group mentioned in that shade. (n, parent with smaller genotype code; N, parent with larger genotype code; n=N when both parents have same genotype code; F, father; M, mother; x, cross; Arrowhead, describe which parent to consider first when writing a cross e.g., 0→1 means 0 x 1; AR, autosomal recessive; AD, autosomal dominant; XR, X-linked recessive; XD, X-linked dominant; Y, Y-linked; All, possible in all patterns of inheritance; Unfilled symbols, normal; Filled symbols, affected; Dot in a symbol, carrier).
References
- As described earlier, with reference to genotype on a single locus, there are twenty five different parent unions possible in nuclear pedigrees, six for each of autosomal dominant, autosomal recessive, X-linked dominant, X-linked recessive (6+6+6+6 = 24) and one for Y-linked inheritance pattern. No effort has been found in literature that provides the outcomes of all possible parent unions for all Mendelian modes of inheritance. However, these illustrations provide ready-to-use set of information incorporating all possible parental and offspring outcomes for genotype and phenotype. This eliminates the need for drawing any particular cross outcomes.
Services
Article usage statistics
Loading…