
Argyrosomus japonicus is an economically important marine fish. However, the wild stocks of A. japonicus are declining due to overfishing. Recently the large-scale stock enhancement of A. japonicus was carried out in China. Here we reported the basic information of its genome using a whole-genome survey through next-generation sequencing and developed genome-wide microsatellite markers for A. japonicus. We estimated the genome size to be 675 Mb by using 17-mer analyses. Preliminary assembled results showed its heterozygous ratio was 0.21%, the repeat sequence ratio was 35.47%, and the GC content was 41.6%. We identified a total of 182,494 microsatellite motifs. Among these microsatellite motifs, the dinucleotide motifs had the highest proportion of all types of repeats (up to 74.65%), followed by trinucleotide (16.68%), tetranucleotide (6.38%), pentanucleotide (2.11%), and hexanucleotide repeats (0.18%). Our results will provide a solid foundation for the molecular research of A. japonicus, which may aid in the development of germplasm resource protection.
Short Communication · Volume 58, Issue 1, 3 January 2026 · Open Access
Genome Survey and Microsatellite Motifs Analysis of a Marine Fish, Argyrosomus japonicus
· · · · · ·
Affiliations & Notes ⌄
- 1Fishery College, Zhejiang Ocean University, Zhoushan, Zhejiang, 316022, China 2Key Laboratory of Mariculture (Ocean University of China), Ministry of Education, Qingdao 266003, China 3Wuhan Onemore-Tech Co., Ltd. Wuhan, Hubei 430076, China * Corresponding author: qyquan@njfu.edu.cn
Article Info ⌄
- Journal:
- Pakistan Journal of Zoology
- Published:
- 3 January 2026

From the article
- The clean data were used to estimate the genome size of A. japonicus based on K-mer analysis.
- In trinucleotide repeats indicated that AAT repeats were the most abundant microsatellite motifs, followed by GAG and CCT (Fig. 2B).
- This investigation of A. japonicus discovered that the genome size, heterozygous ratio, repeat sequence ratio, and GC content were 675 Mb, 0.21%, 35.47%, and 41.6%, respectively.
- Genome assembly using 17-mer analysis revealed that the length of contig N50 and scaffold N50 were 2,457 bp and 37,477 bp, respectively.
Selected from the article's own text.
Abstract
Materials and methods
The samples were collected from an aquaculture farm in Dengbu island (122.32°E, 29.87°N) in Zhejiang, China in September 2019. Undamaged and healthy individuals were selected for DNA extraction and stored in 95% ethanol at -80 °C. The standard phenol-chloroform method was used for the extraction of genomic DNA . To get high purity and RNA-free DNA, the DNA was treated with RNase.
After testing for the quantity and quality of genomic DNA, qualified genomic DNA was selected for library construction. It was randomly fragmented into 350 bp lengths using an ultrasonic breaker. Subsequently, the sequencing library was constructed through terminal repair, the addition of single “A” nucleotides, sequencing joints, purification of target fragment, and PCR amplification step by step. After the construction of the sequencing library, Qubit 2.0 and Q-PCR were used to detect the library effective concentration, and the Agilent 2100 was used to detect the library insert size. After library verification, two paired-end DNA libraries were constructed with an insert size of 350 bp and then sequenced using the Illumina Novaseq platform following the manufacturer’s protocol. The operations of library construction and sequencing were conducted by Gooalgene Technology Co., Ltd., (Wuhan, China). Entire read sets were deposited in the short read archive (SRA) databank with accession number PRJNA622309 (https://www.ncbi.nlm.nih.gov/sra/).
After removing low-quality reads, all clean data were used to perform K-mer analysis. And the characteristics of the genome which consist of genome size, heterozygosity rate, and repeat content were estimated.
To estimate the size of the genome, the information of peak depth and the number of predicted best K-mer were obtained according to the results of K-mer analysis. A routine 17-mers frequency distribution analysis was calculated by using the following formula: Genome size = K-mer num/K-mer peak depth, where the K-mer num refers to the total number of predicted best K-mer, and K-mer peak depth is the expected coverage depth of K-mer. The heterozygosity ratio and repeat sequence ratio were calculated in the light of the method proposed by Li (2019). The K-mer analyses were done by using software Jellyfish v2.0 (Marcais and Kingsford, 2011) and GenomeScope v1.0 . The clean reads were assembled into contigs in software SOAPdenovo v2.01 by applying the de Bruijn graph structure. The paired-end information was then used to join the unique contigs into scaffolds . The Perl script MIcroSAtellite (MISA) was applied to identify microsatellite motifs in the de novo draft genome . Moreover, the search parameters were set to detect dinucleotide, trinucleotide, tetranucleotide, pentanucleotide, and hexanucleotide microsatellite motifs with the minimum of 6, 5, 5, 5, and 5 repeats, respectively. Then the primer design of microsatellite loci were conducted by using Primer 3 v2.3.7 software with default parameters ; .
Results and discussion
A total of 84.27 Gb clean data were obtained by filtering and correcting the raw data. The Q20 and Q30 values were over 97% and 92%, respectively. The clean data were used to estimate the genome size of A. japonicus based on K-mer analysis. The 17-mer frequency distribution derived from the sequencing reads was plotted in Figure 1. The peak of the 17-mer distribution was 93 and the total number of 17-mers was 65,578,488,012. Therefore, the calculated genome size was approximately 683 Mb. A total of 675 Mb revised genome size was calculated with the heterozygous ratio and repeat sequence ratios 0.21% and 35.47%, respectively.
Our estimated genome size (675 Mb) of A. japonicus is consistent with the previous study that the genome size of most fish species was commonly less than 1 Gb .
Table I. The result of assembly in A. japonicus using 84.27 Gb Illumina cle
| Contigs | Scaffolds | |||
| Length (bp) | Number | Length (bp) | Number | |
| N90 | 340 | 313,439 | 1,918 | 31,316 |
| N80 | 852 | 199,342 | 8,012 | 15,032 |
| N70 | 1,357 | 141,004 | 15,979 | 9,252 |
| N60 | 1,883 | 101,474 | 25,567 | 5,983 |
| N50 | 2,457 | 72,045 | 37,477 | 3,853 |
| Total length | 633,290,626 | 659,660,414 | ||
| Total number (> 100 bp) | 716,619 | 307,196 | ||
| Total number (> 2 kb) | 94,579 | 30,698 | ||
Assembly was presented here using 84.27 Gb Illumina PE clean reads. The contig N50 and scaffold N50 were 2,457 bp and 37,477 bp, respectively (Table I). The GC content was an important factor influencing sequencing bias in the Illumina platform . Different densities of GC content can reduce coverage in sequencing regions and high or low proportion of GC content are hard for sequencer to detect (Bentiey et al., 2008; . Our results discovered that the middle proportion of GC content with 41.6% value was suitable for further genomic researches .
A total of 182,494 SSR motifs were detected based on the genome survey sequence. Among them, the dinucleotide motifs among all distribution frequency of repeats accounted for the largest number (74.65%) in A. japonicus genome, followed by trinucleotide (16.68%), tetranucleotide (6.38%), pentanucleotide (2.11%), and hexanucleotide repeats (0.18%), which was similar to the previous reports of other fishes, such as Sebastiscus marmoratus ; and Acanthogobius ommaturus .
There was a huge variation in the relative abundance of repeat motifs. Among all dinucleotide repeat types, the density of TG repeats was the most abundant one, yet least for CG repeats (Fig. 2A). The substantial gap in the number of TG and CG, most likely caused by the conversion of the methylated C residue to T . In trinucleotide repeats indicated that AAT repeats were the most abundant microsatellite motifs, followed by GAG and CCT (Fig. 2B). The most abundant tetranucleotide and pentanucleotide repeats types were TATC and ATTTG, respectively (Fig. 2C, D). The number of hexanucleotide motifs identified was the least and GGTCCA motifs were the most abundant hexanucleotide motifs (Fig. 2E).
In the present study, numerous microsatellites were found in this genome. It is feasible that the applied range of SSR of A. japonicus will develop more widely.
Conclusions
This investigation of A. japonicus discovered that the genome size, heterozygous ratio, repeat sequence ratio, and GC content were 675 Mb, 0.21%, 35.47%, and 41.6%, respectively. Genome assembly using 17-mer analysis revealed that the length of contig N50 and scaffold N50 were 2,457 bp and 37,477 bp, respectively. The relative abundances of specific repeat motifs were highly variable
among the repeats. The results of this study shed new light on the characteristics of the A. japonicus genome, identified a large number of microsatellite markers, which provided the basic data for the follow-up genome research.
Declarations
Acknowledgments
The authors would like to thank Prof. Xuejun Chai from Marine Fisheries Research Institude of Zhejiang Province for providing samples of Argyrosomus japonicus.
Funding
The study was supported by the National Natural Science Foundation of China (41776171).
Ethics statement
The specimen used in this study was caught by hook fishing and was dead when collected. All handling of Argyrosomus japonicus specimens was conducted in strict accordance with Animal Care Quality Assurance in China and Zhejiang Ocean University.
Data availability
All supporting data are included within the main article. Entire read sets were deposited in the short read archive (SRA) databank (https://www.ncbi.nlm.nih.gov/sra/) and available under accession number PRJNA622309.
Statement of conflict of interest
The authors have declared no conflict of interest
Figures
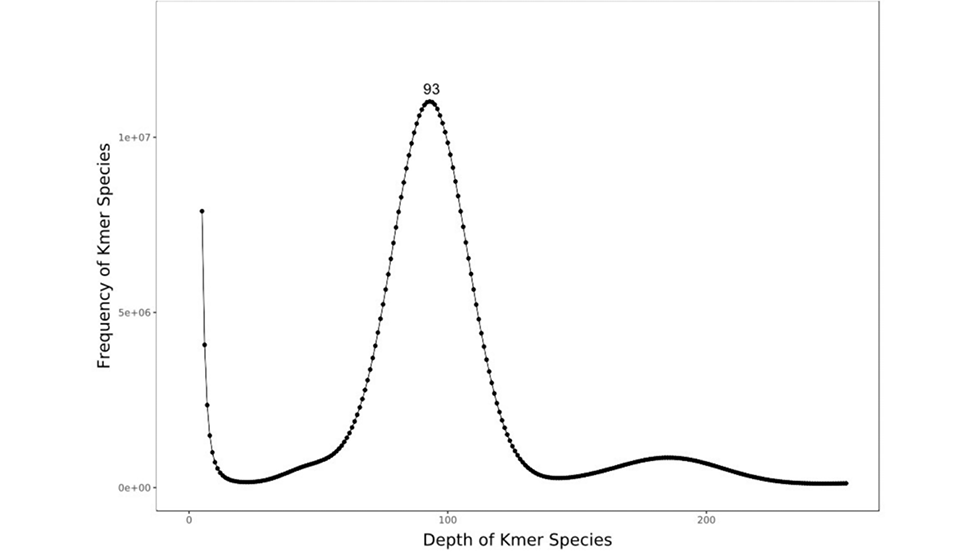
K-mer (K=17) analysis for estimation of the genome size of A. japonicus. The X-axis is depth of Kmer species and the Y-axis is the proportion that represents the frequency at that depth.
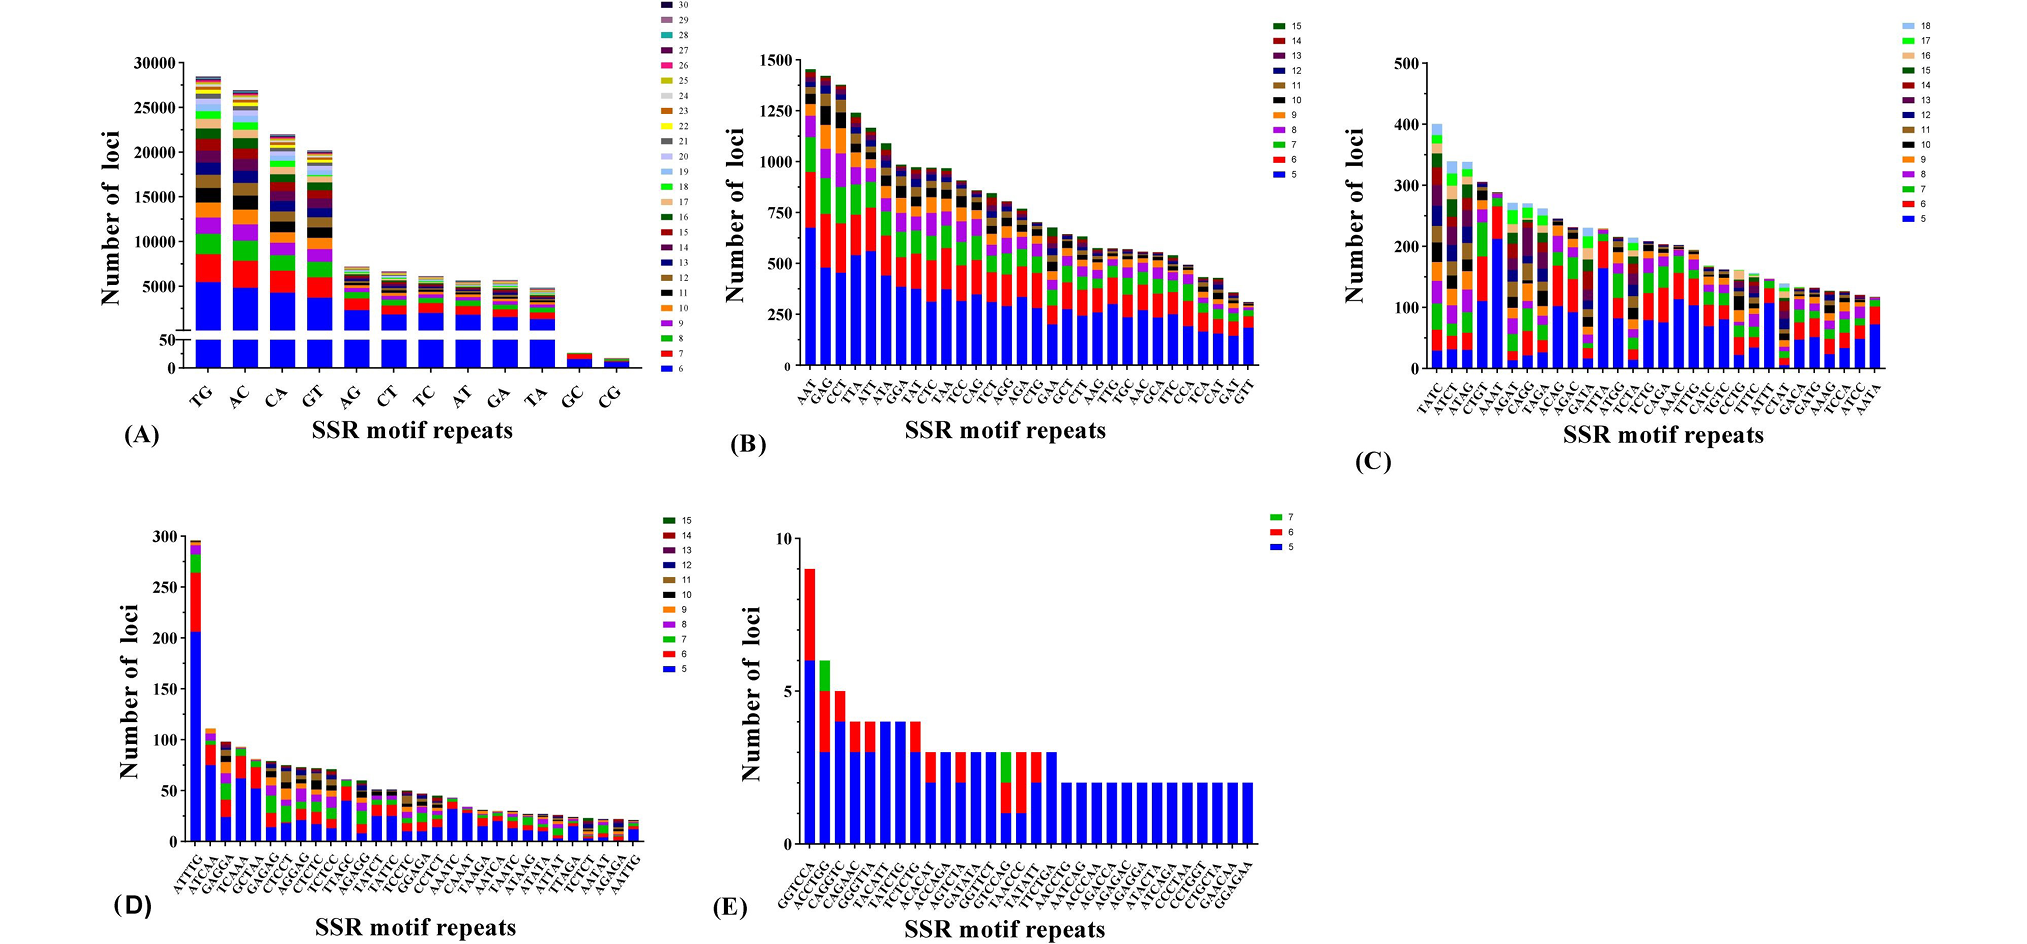
Distribution of SSR motifs in A. japonicus based on sequencing data. Frequency of different dinucleotide (A), trinucleotide (B), tetranucleotide (C), pentanucleotide (D), hexanucleotide (E) and microsatellite motifs (F).
References
- Aird, D., Ross, M.G., Chen, W.S., Danielsson, M., Fennell, T., Russ, C., Jaffe, D.B., Nusbaum, C. and Gnirke, A., 2011. Genome Biol., 12: 1-14. https://doi.org/10.1186/gb-2011-12-2-r18[CrossRef]
- Beier, S., Thiel, T., Münch, T., Scholz, U. and Mascher, M., 2017. Bioinformatics (Oxford, England)., 33: 2583-2585. https://doi.org/10.1093/bioinformatics/btx198[CrossRef]
- Bi, Q.X., Zhao, Y., Cui, Y.F. and Wang, L.B., 2019. Mol. Biol. Rep., 46: 4303-4312. https://doi.org/10.1007/s11033-019-04884-7[CrossRef]
- Capobianchi, M.R., Giombini, E. and Rozera, G., 2013. Clin. Microbiol. Infect., 19: 15-22. https://doi.org/10.1111/1469-0691.12056[CrossRef]
- Chen, B.J., Sun, Z.C., Lou, F.R., Gao, T.X. and Song, N., 2020. Biosci. Rep., 40: SR20201295. https://doi.org/10.1042/BSR20201295[CrossRef]
- Chen, S.L., Xu, W.T. and Liu, Y., 2019. J. Fish China, 43: 1-14.
- Cheung, M.S., Down, T.A., Latorre, I. and Ahringer, J., 2011. Nucleic Acids Res., 39: e103. https://doi.org/10.1093/nar/gkr425[CrossRef]
- Gu, S.T., Wang, R.Q., Li, C.W., Li, J.L. and Shen, Y.B., 2020. Aquacult. Fish., 5: 80-85. https://doi.org/10.1016/j.aaf.2019.06.002[CrossRef]
- Koressaar, T. and Remm, M., 2007. Bioinformatics, 23: 1289-1291.
- Li, Q.H., Li, Z.B., Dai, G., Cao, Y.Y., Chen, X.J., Chen, L.N., Shangguan, J.B. and Ning, Y.F., 2014. Conserv. Genet. Resour., 6: 53-55. https://doi.org/10.1007/s12686-013-0001-y[CrossRef]
- Li, Z.J., Gao, T.X. and Han, Z.Q., 2021. Front. Mar. Sci., 8. https://doi.org/10.3389/fmars.2021.790065[CrossRef]
- Lo, P.C., Liu, S.H., Chao, N.L., Nunoo, F.K.E., Mok, H.K. and Chen, W.J., 2015. Mol. Phylogenet. Evol., 88: 132-143. https://doi.org/10.1016/j.ympev.2015.03.025[CrossRef]
- Luo, R.B., Liu, B.H., Xie, Y.L., Li, Z.Y., Huang, W.H., Yuan, J.Y., He, G.Z., Chen, Y.X., Pan, Q. and Liu, Y.J., 2012. Giga Sci., 1: 18. https://doi.org/10.1186/2047-217X-1-18[CrossRef]
- Mao, X.W., Lan, S.L., Xiao, T.Y., Huang, Y., Jin, H.C., Xun, Z.L. and Li, J.L., 2012. Fish. Sci., 31: 245-248.
- Marçais, G. and Kingsford, C., 2011. Bioinformatics, 27: 764-770. https://doi.org/10.1093/bioinformatics/btr011[CrossRef]
- Nakabo, T., 2013. Fish of Japan with pictorial keys to the species. Tokai University Press, pp. 969-973.
- Paul, D.C., Niall, G.V., Horst, K. and Jeremy, B., 2008. Aquacult. Res., 39: 979-985.
- Sambrook, J., Fritsch, E.F. and Maniatis, T., 1989. Molecular cloning: A laboratory manual, 2nd eds. Cold Spring Harbor Laboratory Press, New York.
- Schorderet, D.F. and Gartler, S.M., 1992. Proc. natl. Acad. Sci. USA, 89: 957-961. https://doi.org/10.1073/pnas.89.3.957[CrossRef]
- Silberschneider, V. and Gray, C.A., 2008. J. appl. Ichthyol., 24: 7-17.
- Untergasser, A., Cutcutache, I., Koressaar, T., Ye J., Faircloth, B.C., Remm, M. and Rozen, S.G., 2012. Nucleic Acids Res., 40: e115. https://doi.org/10.1093/nar/gks596[CrossRef]
- Vurture, G.W., Sedlazeck, F.J., Nattestad, M., Underwood, C.J., Fang, H., Gurtowski, J. and Schatz, M.C., 2017. Bioinformatics, 33: 2202–2204.
- Wang, B., Zhang, X.L., Qu, X.J., Ruan, S.H. and Qu, Y.Q., 2002. Prog. Fish Sci., 23: 13-19.
- Xu, S.Y., Song, N., Xiao, S.J. and Gao, T.X., 2020. Biosci. Rep., 40: 1-8. https://doi.org/10.1042/BSR20192252[CrossRef]
- Ye, Y.Y., Yan, C.R., Senanan, W., Guo, B.Y., Xu, K.D. and Lu, Z.M., 2020. Front. Mar. Sci., 7: 516. https://doi.org/10.3389/fmars.2020.00516[CrossRef]
Services
Article usage statistics
Loading…