Short Communication · Volume 49, Issue 2, 6 April 2017 · Open Access
Genetic Diversity of Five Fecundity Related Microsatellites in Six Goat Breeds
· · · · · · · · · · · · · · ·
Affiliations & Notes ⌄
1College of Animal Science and Technology, Chongqing Key Laboratory of Forage and Herbivore, Chongqing Engineering Research Centre for Herbivores Resource Protection and Utilization, Southwest University, Chongqing 400716, China 2Institute of Animal Science, Chinese Academy of Agricultural Sciences (CAAS), Beijing, 100193, China 3College of Animal Science and Technology, Qingdao Agricultural University, Qingdao 266109, China 4College of Animal Science and Technology, Jilin Agricultural University
In total, 115 alleles of the 5 fecundity related microsatellite loci were found in the six goat breeds.
Therefore, the diversity and polymorphism of these loci should diverge significantly in high fecundity goats and goats with lower fecundity.
In addition, the population structure was not significantly divergent between the high fecundity goats and the lower fecundity goats.
Therefore, the five microsatellites cannot explain the mechanism of fecundity in goats or provide useful biomarkers for breed selection in goats.
Selected from the article's own text.
Abstract
Fecundity is an important trait for the reproduction of economically domestic animals. Some microsatellites related to the fecundity of domestic animals have been identified. In the current study, we investigated five fecundity related microsatellites, including BM1329, BM143, LSCV043, OarHH35, and OarHH55, which had been identified in sheep. We estimated their diversity and population structure in three high fecundity goats (Jianzhou big ear goat, Jining grey goat, Dazu black goat) and three low fecundity goats (Boer goat, Nubian goat, Inner Mongolia Cashmere goat). The results revealed a high diversity of those markers in the goat populations. The population structure did not diverge significantly between high fecundity goats and low fecundity populations, but it followed the agro-ecological zone and management history. This indicated that the frequency of those five microsatellites did not increase during the reproduction of those six breeds. Therefore, these five fecundity related microsatellites are not appropriate biomarkers for goat breeding.
Material and methods
We genotyped 191 individuals from 6 breeds of goats from different geographic locations, including Boer goats (30, East Longitude (EL):144.963, North Latitude (NL):-37.813 ), Nubian goats (29, EL: 142.573, NL:-32.486), Dazu black goats (28, EL:105.721, NL:29.707), Jianzhou big ear goats (30, EL:104.546, NL:30.410), Jining grey goats (55, EL:116.587, NL:35.415) and Inner Mongolia Cashmere goats (19, EL:105.728, NL:38.851). Of these breeds, Jianzhou big ear, Jining grey, and Dazu black show high fecundity (Litter size: 252% ~ 283%); whereas, Boer, Nubian, and Inner Mongolia Cashmere show low fecundity (Litter size: 105% ~ 193%) (China National Commission of Animal Genetic Resources, 2011). Blood samples were taken from the ulnar vein and stored in vacuum tubes containing EDTA 1~2mg/ml blood at -20 °C before examination. Genomic DNA was extracted from whole blood as described by Sambrook and Russell (2001).
The animals were genotyped by PCR amplification of the BM1329, BM143, LSCV043, OarHH35 and OarHH55 markers (Supplementary Table I). The amplification conditions consisted of an initial denaturation for 1 min at 94 °C, followed by 35 cycles at 92 °C for 45 s, 51-63 °C for 45 s and 72 °C for 45 s, with a 1 min extension at 72 °C. Approximately, 1-2 μL of each PCR product was diluted with 10 μL of autoclaved distilled water for use in DNA genotyping. A 2 μL aliquot of the diluted PCR product was mixed with 7.75 μL Hi DiTM Formamide and 0.25 μL Gene Scan-500 LIZTM. The mixtures were heated at 94 °C for 5 min and then immediately chilled on ice for 2 min. Genotyping was carried out on a 3130 xl Genetic Analyzer (AB Applied Bio systems, US).
The genetic diversity expected (HE), the observed heterozygosity (Ho), the mean number of alleles (NA) and the polymorphism information content (PIC) were estimated from the allele frequencies using the Microsatellite Toolkit . For each locus-population combination of the global data set and population groupings, we used Fisher’s exact test with Bonferroni correction to test possible deviations from the Hardy-Weinberg equilibrium (HWE) using GENEPOP 3.4 . The pairwise difference (FST) was estimated using Arlequin software 3.5.1.3 . The phylogenetic neighbor-joining tree was derived from Reynold’s genetic distance using the PHYLIP software package. The Bayesian clustering algorithm implemented in STRUCTURE v2.3.3 with 50,000 iterations following a burn-in of 100,000 Markov Chain Monte Carlo replications in an admixture model was used to assess the genotypic composition of the genetic backgrounds of the populations analyzed and the proportions of mixed ancestry. Six independent simulations from K=1 to K=6 were performed to identify the most probable clustering solution by examining the modal distribution of Delta K . Graphical representations of these statistics were obtained with STRUCTURE HARVESTER v0.68 (Earl and von Holdt, 2012).
Table I.- Genetics diversity of all populations for each locus.
Locus
HO
HE
PIC
Na
dHWE
BM143
0.4911
0.663
0.6199
20
5
LSCV043
0.2965
0.8122
0.7694
24
6
BM1329
0.4918
0.722
0.6755
12
6
OarHH35
0.6722
0.8339
0.8021
27
5
OarHH55
1.0000
0.8649
0.8357
32
1
Mean
0.590
0.779
0.740
23
4.6
Results
In this study, capillary electrophoresis was used for genotyping of these five fecundity related microsatellites (Supplementary Fig. 1). In total, 115 alleles of the 5 fecundity related microsatellite loci were found in the six goat breeds. Across populations, an average of 23 alleles per locus was observed, ranging from 12 in BM1329 to 32 in OarHH55 (Table I). The average polymorphism information content across loci was 0.740, ranging from 0.6199 (BM143) to 0.8357 (OarHH55) (Table I). The mean expected and observed heterozygote frequency within a locus across populations were 0.779 (0.663 in BM143 to 0.8649 in OarHH55) and 0.590 (0.2965 in LSCV043 to 1.0000 in OarHH55), respectively (Table II). This revealed that the microsatellite loci in this study showed large frequencies of polymorphism among the six breeds.
Across loci, the NA ranged from 8.40±4.45 in Boer goats to 14.00±5.24 in Jining grey goats (Table II). The HO within each population ranged from 0.467±0.041 in Boer goats to 0.700±0.039 in Dazu black goats. The highest HE (0.824±0.045) was found within the Jining grey goat population, and the lowest (0.656±0.075) in the Boer population. However, for most populations, the HE and HO were inconsistent in this study (Table III).
Table II.- Polymorphism measurement for six goat breeds.
Population
HO (±SD)
HE (±SD)
NA (±SD)
dHWE
Pa
Boer goat
0.467±0.041
0.656±0.075
8.40±4.45
4
6
Dazu black goat
0.700±0.039
0.788±0.038
8.60±2.61
3
4
Jining Gregy goat
0.596±0.030
0.824±0.045
14.00±5.24
4
19
Inner mongolia cashmere goat
0.558±0.051
0.789±0.063
8.60±3.21
3
9
Nubia goat
0.635±0.040
0.821±0.023
10.80±2.39
5
3
Jianzhou big ear goat
0.587±0.040
0.798±0.048
11.60±2.61
4
7
Note, Pa is number of private allele; dHWE is number of populations deviated from Hardy-Weinberg equilibrium.
Table III.- Pair-wise difference between six goat breeds by five fecundity related microsatellite.
Code
BE
DZ
JN
NM
NB
JZ
BE
0.00000
DZ
0.12334
0.00000
JN
0.09231
0.02416
0.00000
NM
0.19681
0.08817
0.08943
0.00000
NB
0.12713
0.04573
0.03113
0.09030
0.00000
JZ
0.12174
0.04425
0.02521
0.10252
0.00802
0.00000
Note, number of population; BE, Boer goat; DZ, Dazu black goat; JN, Jining Gregy goat; NM, Inner mongolia cashmere goat; NB, Nubia goat; JZ, Jianzhou big ear goat.
Each marker deviated from the HWE in 4.6 populations on average. The most extreme locus, OarHH55, deviated from the HWE only in one breed (Table I), and there was no population with all the loci in HWE.
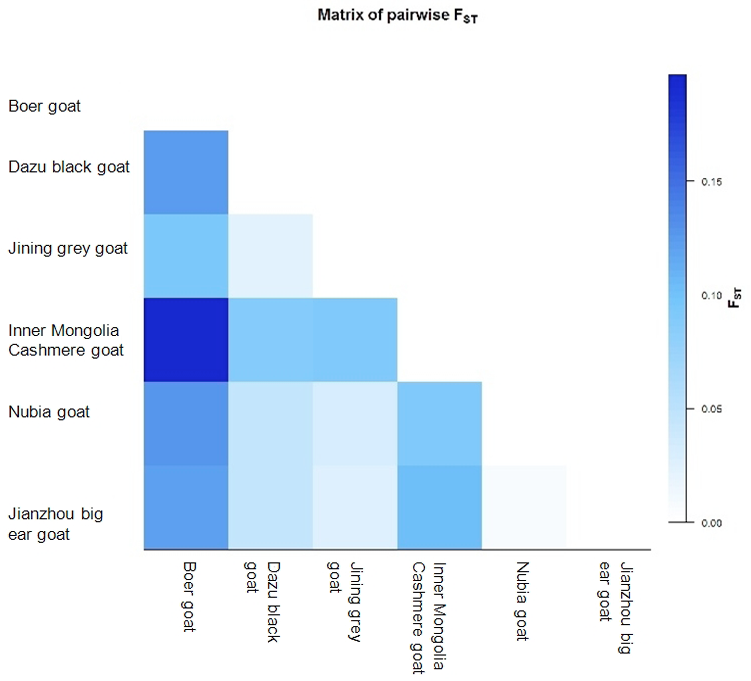
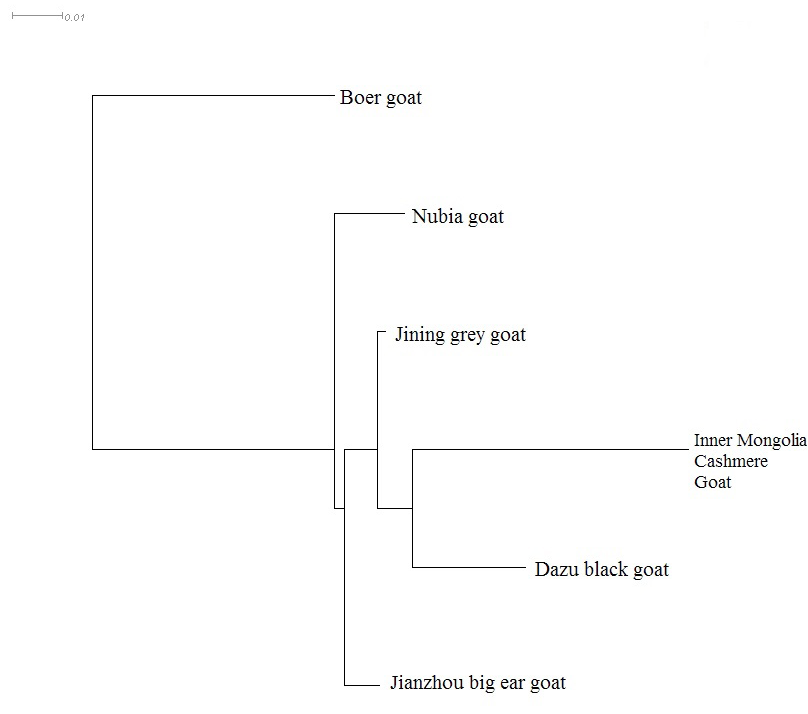
In total, 48 separate alleles were distributed across 6 populations and 5 markers. The pair-wise differences between populations (FST) are shown in Figure 1 and Table III, and the consistency with the phylogenetic network based on Reynolds genetic distance is shown in Figure 2.
The STRUCTURE software was used for clustering individuals into 2 ≤ K ≤ 6. The optimal K-value was 3 (Supplementary Fig. 2) according to the Delta K obtained with STRUCTURE HARVESTER.
Discussion
Goats are important to the subsistence needs of many human populations because they can provide abundant, regular supplies of meat, milk, hides and cashmere. Therefore, it is important to improve the economic traits of goats, including reproductive traits. Unfortunately, the genetic mechanisms contributing to caprine fertility are still unclear.
Marker-assisted selection (MAS) can help to improve traits, including fecundity related phenotypes, in domestic animals . We analyzed the polymorphisms of genes that have been confirmed as major genes of fecundity in sheep to ascertain whether they were responsible for fecundity in goats.
In previous studies, it was found that the 104 bp, 106 bp and 110 bp alleles of BMP134 contributed to the number of offspring born to Xiangdong black goats . The 112 bp and the 175 bp alleles of OarHH35 made positive and negative contributions, respectively, to the number of offspring in Lezi black goats . In addition, the 140 bp and 120 bp alleles of LSCV043 had positive effects on the number of offspring . However, if those microsatellite loci were related to the fecundity of goats, they should have undergone strong selection during traditional breeding. Therefore, the diversity and polymorphism of these loci should diverge significantly in high fecundity goats and goats with lower fecundity. In addition, they should be independent of drift and natural selection due to geography.
In this study, the results obtained for HE, HO, PIC and NA for the five microsatellites are consistent with other studies of local Chinese goat breeds and commercial populations, including Boer and Nubian ; . These results indicate that the five fecundity related microsatellite loci analyzed in this study are highly polymorphic and diverse in the different goat breeds.
The number of loci with exclusive alleles was highest in Jining grey goats (14.00±5.24) and lowest in Boer goats (8.40±4.45). The expected heterozygosity with the highest mean was found in the Jining grey goats (0.824±0.045) and the lowest was in the Boer goats (0.656±0.075). The observed heterozygosity per population ranged between 0.700±0.039 (Dazu black) and 0.467±0.041 (Boer). Interestingly, high inconsistent between HE and HO of most populations indicate that those locus were not under HWE. As, the proportion of loci not in HWE was highest in the Nubian goats and lowest in the Dazu black goats and the Inner Mongolia Cashmere goats. However, it could be caused by small sample size of each population in this study.
Private alleles (Pas) were observed in all the populations studied ranging from 3 (Nubian) to 19 (Jining grey). The frequency of some private alleles within certain populations was possible because they had different domestic histories. Overall, these results indicate that, although the within-population expected and observed heterozygosities were not widely different, the deficit found in within-population heterozygosity was different among the populations. In addition, the large divergence of private alleles among populations indicated that those six breeds should reveal an interesting population structure.
In the pair-wise difference (FST) analysis, the largest difference was between Boer and Inner Mongolia Cashmere goats (0.19681), and the smallest was between Jianzhou Big ear and Nubian goats (0.00802), which indicate that the population relationship corresponded to their management history. Jianzhou Big ear goats are neutral hybrids between the Nubian goat and the indigenous breed in Southwest China, and they date from the Second World War. Two decades ago, these ecotype individuals were combined, and a specific breed was constructed by artificial breeding for meat production (China National Commission of Animal Genetic Resources, 2011). In addition, the consensus neighbor-joining phylogenetic tree of six goat breeds revealed that the clear genetic separation between breeds followed the geographic location of the sampling, including the Jianzhou Big ear goat located between the Nubian and Chinese native goats. In addition, the Boer goat, which was sampled from Oceanica, was a distant genetic variant of Chinese native goats but resembled Nubian goats. An analysis by STRUCTURE (K=3) indicated a similar genetic population pattern of clustering.
In the current study, the clustering of breeds based on the five fecundity related microsatellites was consistent with the agro-ecological zone and management history. This phenomenon could be explained by drift and natural selection of these loci. Although the clustering could result from an artificial process, the associated beneficial genotypes of these loci have not been fixed in a specific goat breed.
Conclusion
In short, these five fecundity related microsatellites were polymorphic, with high numbers of alleles in the six breeds of this study. In addition, the population structure was not significantly divergent between the high fecundity goats and the lower fecundity goats. Instead, the population structure reflected the agro-ecological zone and management history of the breeds. The high fecundity phenotype of the five microsatellites did not increase in those six breeds as a result of breeding. Therefore, the five microsatellites cannot explain the mechanism of fecundity in goats or provide useful biomarkers for breed selection in goats.
Acknowledgement
Co-authors declare no conflict of interest. This work was supported by the Fundamental Research Funds for the Central Universities (No. SWU114023), the 2013 Innovation Team Building Program in Chongqing universities (KJTD201334).
Conflict of Interest Statement
The authors declare that there is no conflict of interests regarding the publication of the manuscript.
Matrix of Slatkin linearized FSTs as tM=FST (1−FST) between six goat breeds.
Fig 2.
Neighbour-joining network of six goat breeds derived by Reynold’s genetic distance using five fecund.
References
Ahlawat, S., Sharma, R., Maitra, A., Roy, M. and Tantia, M.S., 2014. Meta Gene, 2: 439-449. https://doi.org/10.1016/j.mgene.2014.05.004[CrossRef]
China National Commission of Animal Genetic Resources, 2011. Animal genetic resources in China: Sheep and goats. Chinese Agricultural Press, Beijing.
Chu, M.X., Cheng, J.H. and Guo, W., 2001. Yi Chuan Xue Bao, 28: 510-517.
Earl, D.A. and von Holdt, B.M., 2012. Conserv. Genet. Resour., 4: 359–361. https://doi.org/10.1007/s12686-011-9548-7[CrossRef]
Evanno, G., Regnaut, S. and Goudet, J., 2005. Mol. Ecol., 14: 2611–2620. https://doi.org/10.1111/j.1365-294X.2005.02449.x[CrossRef]
Excoffier, L. and Lischer, H.E.L., 2010. Mol. Ecol. Resour., 10: 564-567. https://doi.org/10.1111/j.1755-0998.2010.02847.x[CrossRef]
Felsenstein, J., 2005. PHYLIP (Phylogeny Inference Package) version 3.6 distributed by the author. Department of Genome Sciences, University of Washington, Seattle. Available: http://evolution.genetics.washington.edu/phylip/getme.html. Accessed 24 March 2014
Frauendorf, M., Gethöffer, F., Siebert, U. and Keuling, O., 2015. Sci. Total Environ., 541: 877-882.
Gibson, A.B., Garratt, M. and Brooks, R.C., 2015. J. exp. Biol., 218: 3911-3918.
Guan, F., Shi, G.Q., Ai, J.T., Liu, S.R. and Yang, L.G., 2007. Yi Chuan, 29: 1230-1236.