
This study was aimed to determine the gastric evacuation (GE) in brook trout (Salvelinus fontinalis) fry and to estimate the effect of body mass on their GE rate (GER). A group of small and large sized S. fontinalis fry (ranging 0.39−0.66 and 0.76−1.46 g) was fed with commercial pellets under similar conditions to avoid the ingress of any other variable such as temperature and dietary energy density. Their stomach contents were sampled at predetermined postprandial times, and were dried at 60° C to constant weight. The course of GE in both sizes of S. fontinalis fry was best described by the square root model. The relationship between GER and body mass was then determined by a power function of fry mass that can be summarized by the equation (g h-1), where St is current stomach mass (g), M is fry mass (g), and t is time (h). The course of GE in S. fontinalis fry is similar to that previously reported for adult S. fontinalis.
Short Communication · Volume 52, Issue 3, 15 March 2020 · Open Access
Gastric Evacuation in Brook Trout (Salvelinus fontinalis) Fry: Effect of Body Size
· · ·
Affiliations & Notes ⌄
- 1Department of Maritime Business Administration, Faculty of Marine Science, Karadeniz Technical University, Trabzon, 61530, Turkey 2Central Fisheries Research Institute, Vali Adil Yazar Cad., No: 14 Åžana 61250 Yomra, Trabzon, Turkey 3Department of Fisheries Technology Engineering, Faculty of Marine Science, Karadeniz Technical University, Trabzon, 61530, Turkey , * Corresponding author: kseyhan.1962@gmail.com
Article Info ⌄
- Journal:
- Pakistan Journal of Zoology
- Published:
- 15 March 2020

From the article
- The course of GE in each size S. fontinalis fry was best described by the square root model.
- The differences between square root and linear models were small compared to that of the exponential model.
- Fry body mass (g) was used to quantify the effect of body size on GER.
- The rate parameters obtained by the square root model were plotted (y-axis) against the mass of fry (x-axis) and a curve line was provided using the simple power function.
Selected from the article's own text.
Abstract
Materials and methods
Two different sizes fry (ranging 0.39−0.66 and 0.76−1.46 g respectably) were procured from the Surmene Faculty of Marine Sciences, Trabzon (Table I). They were stocked in two separate aquaria of 10 L which were facilitated with recirculating water system where the oxygen saturation was ensured by means of continuous air-bubbling. The fish were fed four times daily with 800µ size commercial pellets (crude protein, 55%; crude fat, 12% obtained from Skretting Aquaculture, www.skretting.com.tr) to apparent satiation for a week prior to experiments. The same feed type was used during the GER experiments.
The fish fry were deprived of food for 72 h before starting the GE experiments. They were fed (group-feeding) to apparent satiation; the feeding period lasted for 15 minutes. The uneaten feed was collected by water-pipe. The stomach contents of fry were then sampled at predetermined postprandial times under Stereo microscope. The recovered stomach contents were dried in an Ecocell Drying Oven at 60°C to constant weight. Fish were killed using an overdose of anaesthesia (20 ppm benzocaine).
The simple regression method used by He and Wurtsbaugh (1993), Pääkkönen and Marjomäki (1997), Sweka et al. (2004) and Bascinar et al. (2016, 2017) was applied to the GE data of S. fontinalis fry. The best fit model was determined on the basis of adjusted r2 and the residual sum of squares (RSS) values.
Linear model ntegrated:

Square root model integrated:

Exponential model integrated:
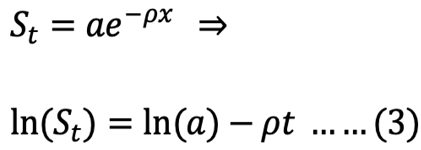
where St is the recovered stomach content mass (g) at time t (h), a is the intersection of the regression line with the y-axis that represents the mean ingested meal size S0, and r is the rate parameter (g h-1).
The parameters of equations 1, 2, and 3 were determined by PROC GLM procedure from SAS (SAS Institute Inc, 2015). After determining the model that best fit the GE data of S. fontinalis fry, the effect of body size on GER was then determined by a simple power function.
Results
The course of GE in each size S. fontinalis fry was best described by the square root model. The square root model consistently provided a higher value of adjusted r2 and the lowest value of RSS (Table II). The differences between square root and linear models were small compared to that of the exponential model.
Fry body mass (g) was used to quantify the effect of body size on GER. The rate parameters obtained by the square root model were plotted (y-axis) against the mass of fry (x-axis) and a curve line was provided using the simple power function. Hence, the relationship between body size and GER can be summarized as:

where St is current stomach mass (g), M is fry mass (g), and t is time (h).
Table I.- Basic experimental data (mean ± S.E.) from gastric evacuation experiments on brook trout Salvelinus fontinalis fry fed on commercial pellets.
| Exp. no. | Temperature (°C) | Mass (g) | Total length (cm) | Meal size (g)* | Obs. (n) |
| 1 | 17.3 | 0.49 ± 0.01 | 4.44 ± 0.03 | 0.003 ± 0.000 | 21 |
| 2 | 17.3 | 1.08 ± 0.03 | 5.39 ± 0.03 | 0.020 ± 0.000 | 24 |
*stomach contents recovered at time 0
Table II.- Estimates (mean ± S.E.) of the intercept and rate parameter ρ in the square root model, linear model and exponential model from gastric evacuation data of brook trout Salvelinus fontinalis fry fed meals of commercial pellets.
| Square root model | Linear model | Exponential model | ||||||||||
| Exp. no. | a | ρ (×10-2) | RSS | Adj. r2 | a | ρ (×10-2) | RSS | Adj. r2 | a | ρ (×10-2) | RSS | Adj. r2 |
| 1 | 0.53 ± 0.01 | -1.32 ± 0.04 | 0.00 | 0.923 | 0.03 ± 0.00 | -46.00 ± 0.30 | 1.27 | 0.924 | -57.55 ± 1.46 | -42.39 ± 0.01 | 3.02 | 0.812 |
| 2 | 1.38 ± 0.04 | -3.30 ± 0.14 | 0.00 | 0.766 | 0.18 ± 0.00 | -0.31 ± 0.00 | 0.00 | 0.755 | -38.67 ± 1.02 | -36.75 ± 0.01 | 4.43 | 0.730 |
This equation, obtained from combined GE data of both fry sizes was used to provide the GE curves in Figure 1.
Discussion
The square root model adequately described the course of GE in both sized S. fontinalis fry which is in accordance with the results obtained from adult S. fontinalis in previous studies ; Başçınar et al., 2016, 2017). Khan et al. (2016) fed adult S. fontinalis with a range of meal sizes (100%, 50% and 25% of satiation meal size) and found the square root model to adequately describe the GE of S. fontinalis independent of meal size. The square root model also described the GE of vendace (Coregonus albula) L. fry fed with live zooplankters: copepod nauplii and copepodids . Whereas, the course of GE in sprat (Sprattus sprattus) fry was reported to be best described by so called surface-area dependent model .
In this study, the effect of body size on GER of S. fontinalis was quantified using fry mass instead of length. While for adult S. fontinalis Khan et al. (2016), and Başçınar et al. (2017) used the fish total length (though they also estimated the mass exponent) to quantify the effect of body size on the GER of adult S. fontinalis in accordance with Andersen (2001). However, in the present study using S. fontinalis fry length to quantify the effect of body size on GER gave an unrealistic length exponent value (4.79). In contrast to fry length, using fry mass gives a realistic value for the mass exponent (1.31) and the summarized equation (4) adequately provided a good curve to the data (Fig. 1). Bernreuther et al. (2009) obtained a mass exponent value of 0.503 for sprat fry.
Conclusion
The result of this study, together with the result of Khan et al. (2016), suggested that the GE of S. fontinalis fed commercial pellets can be adequately described by the square root model. The square root model can therefore from a limited number of growth experiments be used to estimate the stomach fullness at return of appetite as well as the fullness that provides optimum food conversion efficiency and maximum growth rate. This information can then be extrapolated to other situations (temperature and energy density of feed), and this way reduce the number of time consuming and expensive growth experiments.
Acknowledgement
This study was supported by the Scientific and Technological Research Council of Turkey (TÜBİTAK) under Grant No. 113O362.
Statement of conflict of interest
Authors have declares that there is no conflict.
Figures
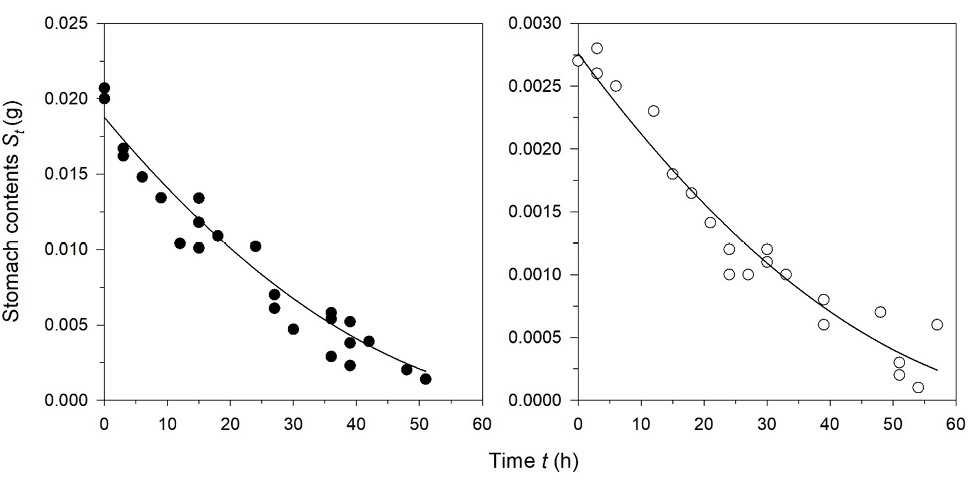
Gastric evacuation of brook trout Salvelinus fontinalis fry: large size (â—), small size (â—‹). The curves were provided by use of equation (4).
References
- Andersen, N.G., 1998. J. Fish. Biol., 52: 743-755. https://doi.org/10.1006/jfbi.1997.0617[CrossRef]
- Andersen, N.G., 2001. J. Fish. Biol., 59: 1198-1217. https://doi.org/10.1006/jfbi.2001.1731[CrossRef]
- Başçınar, N., Başçınar, S.N., Seyhan, K. and Khan, U., 2016. Pakistan J. Zool., 48: 1899-1904.
- Başçinar, N.S., Başçinar, N., Khan, U. and Seyhan, K., 2017. Indian J. Fish., 64: 50-54. https://doi.org/10.21077/ijf.2017.64.3.59243-08[CrossRef]
- Bernreuther, M., Temming, A. and Herrmann, J.P., 2009. J. Fish Biol., 75: 1525-1541. https://doi.org/10.1111/j.1095-8649.2009.02353.x[CrossRef]
- Bromley, P.J., 1994. Rev. Fish Biol. Fisher., 4: 36-66. https://doi.org/10.1007/BF00043260[CrossRef]
- dos Santos, J. and Jobling, M., 1995. ICES J. Mar. Sci., 52: 209-219. https://doi.org/10.1016/1054-3139(95)80036-0[CrossRef]
- Elliott, J. and Persson, L., 1978. J. Anim. Ecol., 977-991. https://doi.org/10.2307/3682[CrossRef]
- Fateh, D., Minehira, K., Schwarz, J.M., Periasamy, R., Park, S. and Tappy, L., 2005. Diabetes, 54: 1907-1913. https://doi.org/10.2337/diabetes.54.7.1907[CrossRef]
- Grove, D., Loizides, L. and Nott, J., 1978. J. Fish Biol., 12: 507-516 https://doi.org/10.1111/j.1095-8649.1978.tb04195.x.[CrossRef]
- He, E. and Wurtsbaugh, W.A., 1993. Trans. Am. Fish Soc., 122: 717-730. https://doi.org/10.1577/1548-8659(1993)122<0717:AEMOGE>2.3.CO;2[CrossRef]
- Jobling, M., 1981. J. Fish Biol., 19: 29-36. https://doi.org/10.1111/j.1095-8649.1981.tb05808.x[CrossRef]
- Jobling, M., 1987. J. Fish Biol., 30: 299-314. https://doi.org/10.1111/j.1095-8649.1987.tb05754.x[CrossRef]
- Jobling, M., Alanärä, A., Noble, C., Sánchez-Vázquez, J., Kadri, S. and Huntingford, F., 2012. Aquacul. Behav., 7: 183-219. https://doi.org/10.1002/9781444354614.ch7[CrossRef]
- Karjalainen, J., Koho, J. and Viljanen, M., 1991. Aquaculture, 96: 343-351. https://doi.org/10.1016/0044-8486(91)90163-2[CrossRef]
- Khan, U., Seyhan, K., Başçınar, N. and Başçınar, S,N., 2016. J. Fish Biol. 89: 1227–1238. https://doi.org/10.1111/jfb.13021[CrossRef]
- Mills, E.L., Ready, R.C., Jahncke, M., Hanger, C.R. and Trowbridge, C., 1984. Can. J. Fish. aquat. Sci., 41: 513-518. https://doi.org/10.1139/f84-061[CrossRef]
- Nobel, R., 1973. Trans. Am. Fish. Soc., 102: 759-763. https://doi.org/10.1577/1548-8659(1973)102<759:EROYYP>2.0.CO;2[CrossRef]
- Pääkkönen, J.P. and Marjomäki, T.J., 1997. J. Fish Biol., 50: 555-563. https://doi.org/10.1111/j.1095-8649.1997.tb01949.x[CrossRef]
- Riche, M., Haley, D., Oetker, M., Garbrecht, S. and Garling, D., 2004. Aquaculture, 234: 657-673. https://doi.org/10.1016/j.aquaculture.2003.12.012[CrossRef]
- Röusch, R., 1987. J. Fish Biol., 30: 521-531. https://doi.org/10.1111/j.1095-8649.1987.tb05779.x[CrossRef]
- SAS Institute Inc, 2015. SAS Institute Inc SAS/IML® 14.1 User’s Guide, SAS Institute Inc, Cary, NC.
- Seyhan, K. and Grove, D., 1998. Fish Res., 38: 233-245. https://doi.org/10.1016/S0165-7836(98)00165-9[CrossRef]
- Silva, S. and Owoyemi, A., 1983. J. Fish Biol., 23: 347-355. https://doi.org/10.1111/j.1095-8649.1983.tb02914.x[CrossRef]
- Sweka, J.A., Keith Cox, M. and Hartman, K.J., 2004. Trans. Am. Fish. Soc., 133: 204-210. https://doi.org/10.1577/T02-064[CrossRef]
- Talbot, C. and Higgins, P., 1983. J. Fish Biol., 23: 211-220. https://doi.org/10.1111/j.1095-8649.1983.tb02896.x[CrossRef]
- Windell, J., Hubbard, J. and Horak, D., 1972. Progr. Fish-Cult., 34: 156-159. https://doi.org/10.1577/1548-8640(1972)34[156:ROGEIR]2.0.CO;2[CrossRef]
Services
Article usage statistics
Loading…