
The aim of this study was to determine the concentrations of Na, Mg, P, K, Ca, Fe, Cu, Zn, Ni, Cd, V and Ba in donkey, goat, and sheep milk samples. Fifty-six individual milk samples were collected from 17 lactating donkeys, 19 goats, and 20 sheeps in three different Turkish Farms. The samples were analyzed by inductively coupled plasma - mass spectrometry (ICP-MS). Minimum and maximum levels of Na, Mg, P, K, Ca, Fe, Cu, Zn in donkey milk samples were 108.6-202.7, 48.6-76, 355-670, 565-1053, 279-637, 1.86-5.8, 0.052-0.277, 1.78-10.97 mg L-1; in goat milk samples were 201.7-1087, 81.7-138.8, 818-1132, 972-1802, 678-1323, 1.91-4.48, 0.052-0.576, 1.72-4.68 mg L-1; in sheep milk samples were 219-640.5, 119.7-238.9, 946-1895, 881-1474, 1103-1962, 2.83-4.72, 0.032-0.719, 1.52-6.68 mg L-1, respectively. These results showed that the concentrations of macro elements in donkey milk samples were lower than those found out for goat and sheep milk samples. Heavy metal concentrations of both donkey, goat, and sheep milk samples were lower than the detection limit of 1 mg L-1.
Research Article · Volume 50, Issue 3, 23 April 2018 · Open Access
Evaluation of levels of Essential Elements and Heavy Metals in Milks of Dairy Donkeys, Goats and Sheep in Turkey
· ·
Affiliations & Notes ⌄
- 1Department of Biochemistry, Faculty of Veterinary Medicine, Harran University, Şanlıurfa 63200, Turkey 2 Department of Pharmacology and Toxicology, Faculty of Veterinary Medicine, Harran University, Şanlıurfa 63200, Turkey 3 Department of Food Hygiene and Technology, Faculty of Veterinary Medicine, Harran University, Şanlıurfa 63200, Turkey , * Corresponding author: skilicaltun@harran.edu.tr
Article Info ⌄
- Journal:
- Pakistan Journal of Zoology
- Published:
- 23 April 2018

Abstract
Introductıon
Milk is a main component of the mammalian diet which represent an important source of micro and macro nutrients such as proteins, carbohydrates, and essential elements. Milk plays an important role especially for infants, young children, and nursery mothers ; . Element concentrations in milk samples vary by species of animal, region, health status, lactation stage, maternal age, and also extrinsic factors such as environment, feeding, and season ; ; ; ; ; ; ; ; . Element composition modifies the nutritional value of milk and also heavy metal concentrations should be a significant reference of hygienic quality and sanitary status of the milk and dairy products. Essential element and heavy metal presence in milk samples may be relevant to the feed, water, and forage . Essential elements in milk is required for development and structural functions of infants. Heavy metals such as Ni, Cd, V, and Ba may have a toxic effect when they accumulate in the body through contaminated food, soil, and water.
In recent years, the demand for sheep and goat milk has increased both in Turkey and in many parts of the World . Especially for infants suffering cow’s milk allergy . Nutritional habits of sheep and goat are important sources for dairy and meat products, as they are easy to adapt to difficult geographical conditions and extreme climatic conditions . In 2016, the population of dairy sheep was approximately 30.983.933, and dairy goat was approximately 10.345.299 with approximately 1.160.413 ton of sheep’s milk and 479.401 ton of goat’s milk in Turkey . Sheep’s milk lipid content is higher than the bovine milk. Goat milk is preferable to bovine milk because of its higher digesting and antiallergic properties . Essential elements and heavy metal concentrations of sheep and goat milk have been analysed in all over the World ; ; ; ; ; ; ; ; ; but only limited data are available for elemental composition of donkey milk ; ; .
Donkey milk is an alternative nutrient for immunocompromised persons and after the first age of life of sensitive young. The composition of donkey milk has an analogy to human milk with similar total and whey protein content and lactose . Donkey milk is also an alternative food both IgE and non-IgE mediated cow’s milk protein allergies ; . In Turkey, donkey milk is usually used for cancer patients and immune system depressed children. There is no information about the capacity of donkey milk production in Turkey. To the best of our knowledge, no previous study was reported on element composition of donkey milk samples in Turkey, and also there is limited data concerning concentrations of essential elements and heavy metals in sheep and goat milk produced in Turkey ; ; ; .
Keeping this in view, this study was aimed to quantify essential elements and heavy metals in the milk of lactating donkeys, goats, and sheep by ICP-MS and the differences of the concentrations among animal species of different regions in Turkey.
Materıals and methods
Sample collection
This study was carried out with milk samples of local donkey, goat, sheep breeds collected from Konya, Mardin, Şanlıurfa provinces of Turkey, respectively. Seventeen raw donkey milk samples were collected from seventeen healthy lactating donkeys (age 4-8 years) which fed on pasture and at the thirty-six month of lactation. Births were synchronized at April. Donkeys were by hand-milked twice a day at an interval of 10 h.
Nineteen raw goat milk samples were collected from nineteen healthy lactating goats from Mardin province. Goat milk samples were collected in March-September 2016. All goats (age 2-6 years) were healthy and fed on pasture. The goat milk samples were collected by hand milking twice a day at an interval of 12 h.
Twenty raw sheep milk samples were collected from twenty seemingly healthy lactating sheep from Şanlıurfa province of Turkey. All sheep (age 3-7 years) were healthy and fed on pasture. Raw sheep milk samples were collected in March-October 2016. The sheep milk samples were collected by hand milking twice a day at an interval of 12 h.
All samples were collected into sterile polypropylene tubes during the morning milking shift, sent to the laboratory with ice packs and stored at -20°C prior to analyses. Sample collection, handling, and storage levels were set up to minimize possible contamination which could affect negatively data reliability.
Chemicals and standard solutions
HNO3 65 % (v/v), H2O2 30 % (v/v) were purchased from Merck (Darmstadt, Germany). Stock standard solutions of each element were purchased from Agilent Japan: Lot Number: 10-160YPY2. Standart certified reference material (NIST SRM 8435) was obtained from Nova Chimica (Milano, Italy). The gas 99.9990 % Argon was supplied by Linde Gases (Linde Group, Turkey).
Microvawe acid digestion
For mineralization of raw donkey, goat, and sheep milk samples, a closed microwave assisted digestion procedure was done. One mL of each sample was placed in PTFE (Teflon) vessels, then four mL HNO3 and two mL H2O2 were added. Digestion steps were at the power of 1600W: 1, ramped for 5 min to a temperature of 90°C, hold time 10 min.; 2, ramped for 10 min to a temperature of 160°C, hold time 10 min; 3, ramped for 5 min to a temperature of 190°C, hold time 20 min with 40 PTFE vessels. After digestion PTFE vessels were hold for one hour for internal pressure to be vented. The samples were diluted to 50 mL with ultrapure water (MES MP Minipure, Turkey). Diluted solutions were kept in polypropylene tubes and stored at +4°C prior to analyses. Digestion procedure of blanks was similar to the samples.
Determination of essential elements and heavy metals by ICP-MS
Essential elements and heavy metals analyses were carried out on an Agilent 7500 ce with an Octopole Reaction System Inductively Coupled Plasma-Mass Spectrometer with an Auto Sampler (Cetac ASX-520) and a Nebulizer (Agilent, Japan).
Isotopes
The isotopes 23Na, 24Mg, 31P, 39K ,44Ca, 56Fe, 63Cu , 66Zn, 60Ni, 111Cd, 51V, and 138Ba were detected. These isotopes were preferred to minimize interferences and to maximize the sensitivity.
Quality control
Limit of quantification (LOQ) and limit of detection (LOD) of each element was calculated as ten times and the recovery of 12 elements (Na, Mg, P, K, Ca, Fe, Cu, Zn, Ni, Cd, V, and Ba) in raw milk samples are shown in Table I.
Table I.- Quality control.
| Element | LOQ | LOD |
| Na (mg L-1) | 115 | 10 |
| Mg (mg L-1) | 48.58 | 4.6 |
| P (mg L-1) | 562 | 35 |
| K (mg L-1) | 1013 | 200 |
| Ca (mg L-1) | 578 | 22 |
| Fe (mg L-1) | 2.53 | 0.5 |
| Cu (mg L-1) | 0.063 | 0.01 |
| Zn (mg L-1) | 1.81 | 0.2 |
| Ni (mg L-1) | 0.40 | 0.001 |
| Cd (mg L-1) | 0.01 | 0.001 |
| V (mg L-1) | 0.04 | 0.001 |
| Ba (mg L-1) | 0.09 | 0.001 |
LOD, limit of detection; LOQ, limit of quantification
Statistical analyses
The statistical calculations were made by SPSS 24.0 Software package (SPSS Inc., Chicago, USA) We assessed the suitability of normal distribution by testing with the Shapiro-Wilk test. Oneway-ANOVA and lSD multiple comparison tests were used for comparison of the variables with normal distribution in three groups, and Kruskal-Wallis and Dunn multiple comparison tests were used for normal non-distributive variables. Relations between numerical variables were made with Spearman rank correlation coefficient (rho). The value of P below 0.05 was considered statistically significant. The correlations between the elements of donkey’s, sheep’s and goat’s milk were calculated while the significance value was evaluated.
Table II.- Concentrations of essential elements and heavy metals of raw donkey milk samples.
| Min | Max | Mean ± SD | |
| Essential elements | |||
| Na (mg L-1) | 108.63 | 202.78 | 150.01±25.62 |
| Mg (mg L-1) | 48.6 | 76.0 | 65.00±10.50 |
| P (mg L-1) | 355 | 670 | 535.35±83.63 |
| K (mg L-1) | 565 | 1053 | 819.35±131.31 |
| Ca (mg L-1) | 279 | 637 | 499.12±101.39 |
| Fe (mg L-1) | 1.86 | 5.8 | 2.56±0.88 |
| Cu (mg L-1) | 0.052 | 0.277 | 0.12±0.07 |
| Zn (mg L-1) | 1.78 | 10.97 | 3.16±2.08 |
| Heavy metals | |||
| Ni (μg L-1) | ND | ND | ND |
| Cd (μg L-1) | ND | ND | ND |
| V (μg L-1) | ND | ND | ND |
| Ba (μg L-1) | ND | ND | ND |
ND, not detected.
Table III.- Concentrations of essential elements and heavy metals of raw goat milk samples.
| Min | Max | Mean ± SD | |
| Essential elements | |||
| Na (mg L-1) | 201.7 | 1087.5 | 341.60±243.69 |
| Mg (mg L-1) | 81.7 | 138.8 | 107.46±22.37 |
| P (mg L-1) | 818 | 1132 | 1022.84±116.98 |
| K (mg L-1) | 972 | 1802 | 1453.47±231.00 |
| Ca (mg L-1) | 678 | 1323 | 894.53±131.82 |
| Fe (mg L-1) | 1.91 | 4.48 | 2.76±0.56 |
| Cu (mg L-1) | 0.052 | 0.576 | 0.21±0.14 |
| Zn (mg L-1) | 1.72 | 4.68 | 3.17±0.88 |
| Heavy metals | |||
| Ni (μg L-1) | ND | ND | ND |
| Cd (μg L-1) | ND | ND | ND |
| V (μg L-1) | ND | ND | ND |
| Ba (μg L-1) | ND | ND | ND |
ND, not detected.
Table IV.- Concentrations of essential elements and heavy metals of raw sheep milk samples.
| Min | Max | Mean ± SD | |
| Essential elements | |||
| Na (mg L-1) | 219 | 640.50 | 408.88±137.28 |
| Mg (mg L-1) | 119.70 | 238.98 | 175.47±36.14 |
| P (mg L-1) | 946 | 1895 | 1469.50±209.75 |
| K (mg L-1) | 881 | 1474 | 1153.75±172.66 |
| Ca (mg L-1) | 1103 | 1962 | 1365.25±194.82 |
| Fe (mg L-1) | 2.83 | 4.72 | 3.49±0.40 |
| Cu (mg L-1) | 0.032 | 0.719 | 0.13±0.17 |
| Zn (mg L-1) | 1.52 | 6.68 | 5.03±1.74 |
| Heavy metals | |||
| Ni (μg L-1) | ND | ND | ND |
| Cd (μg L-1) | ND | ND | ND |
| V (μg L-1) | ND | ND | ND |
| Ba (μg L-1) | ND | ND | ND |
ND, not detected.
Results and dıscussıon
Concentrations of essential elements and heavy metals in raw donkey milk samples
To the best of our knowledge, this study reports for the first time the concentrations of essential elements and heavy metals of donkey milk of Turkey. The results of this study show that the highest values of raw donkey milk were observed for K (565-1053 mg L-1), for P (355-670 mg L-1), and for Ca (279-637 mg L-1).
The concentrations of Na observed in this research were in agreement with those described for donkey milk from Martina Franca (140.94 mg L-1) . There was a positive correlation between Na and Mg (rho: 0.505), K (rho: 0.556), and Ca (rho: 0.559). Fantuz et al. (2012) found 81.68 mg L-1 values for Mg which was higher than ours with a mean level of 65.0 mg L-1 and also their mean P levels (638.34 mg L-1) were higher than ours (535.35 mg L-1) Mg concentrations of donkey milk were very strongly correlated with P (rho: 0.850), K (rho:0.824), and Ca (rho: 0.919) and also P levels of donkey milk were very strongly correlated with K (rho: 0.831) and Ca (rho: 0.896). The mean K concentrations were lower (746.61 mg L-1) than this study (819.35 mg L-1) . There was a positive correlation between K and Ca (rho: 0.846). Mean Ca levels (499.12 mg L-1) in our study were lower than those of Fantuz et al. (2012) (807.09 mg L-1). Mean Fe levels (2.56 mg L-1) in this study were higher than those reported by Potortì et al. (2013) (1.53 mg L-1) Fe was negatively correlated with Zn (rho: -0.547). The Cu concentrations (0.052-0.277 mg L-1) were in agreement with those reported for donkey milk from Italy (0.036-0.49 mg L-1) . The mean value (3.16 mg L-1) for Zn was similar to the mean levels (2.80 mg L-1) of Italian donkey milk . Ni, Cd, V, Ba residues were below the limit of detection. Low levels of Ni and Cd in donkey milk samples were reported by Potortì et al. (2013) with a mean level of 0.034 mg L-1, 0.0069 mg L-1, respectively.
Concentrations of essential elements and heavy metals in raw goat milk samples
In Turkey, goat milk is generally used for the production of cheese, yogurt, and ice cream, whereas in Mardin province it is mainly used in a mixture with sheep milk to produce the local unpasteurized cheeses. In this study, the concentration of K, P, and Ca were significantly higher than the other essential elements in raw goat milk samples.
The mean concentration of Na in goat milk samples was 341.6 mg L-1 which was higher than those reported by Singh et al. (2015) for goat milk (118.9 mg L-1), while higher levels were found in Hatay province of Turkey (433 mg L-1) . Khan et al. (2006) reported a mean value of Na (309 mg L-1) in goat milk which was similar to our Na levels. There were positive correlations between Na and Mg (rho: 0.576), Fe (rho: 0.723).
The Mg levels of colostrum is so much higher than milk but it doesn’t be affected by the removing fat Mg levels in goat milk were in accordance with the value (90 mg L-1) reported by Khan et al. (2006) but our Mg concentrations were so much lower than those in goat milk from Hatay, Turkey (510 mg L-1) .
P content of goat milk samples varied from 818 to 1132 mg L-1. The data showed that P content in goat milk samples was higher than the caprine milk mean value of 823 mg L-1 proposed by Güler (2007). P concentrations of goat milk samples were strongly correlated with Zn (rho: 0.746).
Mean K concentration of goat milk samples (1453.47 mg L-1) was higher than those described for goat milk from Hisar, India (355.1 mg L-1) , from Hatay, Turkey (406 mg L-1) . The Ca content of goat milk samples varied from 678 to 1323 mg L-1 when we compare the Ca content of goat milk samples in our study the literature showed that the results were in agreement with those reported in literature by Khan et al. (2006) (961 mg L-1) and Güler (2007) (1342 mg L-1) but they were lower than that described by Garcia et al. (2006).
Fe is an essential element which is a constituent of myoglobin and hemoglobin . Fe levels in the goat milk samples ranged from 1.91 to 4.48 mg L-1 with a mean value of 2.76 mg L-1 that was significantly higher than the values reported in literature of 0.85 mg L-1 and 0.46 mg L-1 .
Cu is an important essential element for the oxidation-reduction mechanism . The Cu content in this study ranged from 0.052 to 0.576 mg L-1. The Cu concentrations in goat milk samples reported from different countries were highly variable between 0.077-0.48 mg L-1 as shown in Table V.
Zn is a necessary element for growth and development which acts as a cofactor in enzyme systems . Mean Zn concentrations (3.17 mg L-1) of goat milk samples were in agreement with those reported in Italy (3.5 mg L-1) and in China (2.95 mg L-1) . The average Zn concentration of goat milk samples was significantly lower than the mean value of 5.47 mg L-1 in the milk samples of Nubian goats .
The mean Ni, Cd, V, Ba level of goat milk samples in this study is lower than the detection limit of 1 μg L-1. However the mean level of Ni and Cd in goat milk samples reported from Pakistan were much higher as compared to our results. Concentrations below the detection limit of Ni, Cd, V, and Ba of this study was lower than those reported for Ni by Şanal et al. (2011) (1.79 mg L-1) and Guler (2007) (1.38 mg L-1).
Concentrations of essential elements and heavy metals in raw sheep milk samples
Turkey ranks 10th level in the worldwide for total milk production after India, USA, China, Pakistan, Brazil, Russian Federation, Germany, France, New Zealand (FAO, 2015). Due to the seasonal production of sheep milk is lower than bovine milk production. The essential element concentrations in sheep milk samples were in the order: P>Ca>K>Na>Mg>Zn>Fe>Cu.
The Na concentrations were in agreement with those reported for sheep milk samples from Croatia (411.73 mg L-1) , while lower levels were found in Pakistan (358 mg L-1) . Positive correlation was found with Mg (rho: 0.660), and Ca (rho: 0.585) while a negative correlation with K (rho:- 0.590) and Zn (rho: -0.552).
The Mg concentrations of sheep milk samples varied 119.7 to 238.98 mg L-1 with an average level of 175.47 mg L-1. Data reported in the literature on the mean Mg concentrations in sheep milk samples were in the range 104-185 mg L-1 ; . Mg concentrations of sheep milk samples were strongly correlated with P (rho: 0.811) and Ca (rho: 0.654).
The content of P in sheep milk samples was above the range reported by Antunovic et al. (2016) in Croatia with a mean level of 1276.99. There was a positive correlation between P and Ca (rho: 0.665).
K is an intracellular cation in the body. The content of K in sheep milk samples was lower than the mean value of sheep milk sample from Dubrovnik, Neretva Country (1334.99 mg L-1) . Correlation analyses showed that K significantly correlated with Zn.
The concentration of Ca in sheep milk samples (Table V) was within the range reported in sheep milk samples by other authors ; . Fe content in sheep milk samples were comparable to the levels described in sheep milk samples by Miedico et al. (2016) and Khan et al. (2006) (Table V). Similarly, average Cu levels in sheep milk from Italy were 0.13 as obtained in our study. Additionally, Antunović et al. (2016) reported lower mean Cu concentrations (0.062 mg L-1) from Croatia. In this study, Zn concentrations in sheep milk samples were similar to those in sheep milk from Italy and higher than those from Pakistan and Croatia .
The low levels of Ni, Cd, V, and Ba in samples of sheep milk, such as for donkey and goat milk, show that this species has not been influenced by the environmental pollution.
Correlation analyses of donkey, goat, and sheep raw milk samples
Since P and K values have a normal distribution, ANOVA test was used to compare the essential element levels of milk samples of 3 different animal species. In the comparison of P values, it was determined that the milk samples of all animal species were significantly different from each other. This value was the highest in sheep milk samples and lowest in donkey milk samples. In comparison of groups for K values, all animal milk samples were found to be significantly different from each other. This value was highest in goat milk samples and lowest in donkey milk samples. Since the data distribution of other elements was not normal, it has been tested with the Kruskal Wallis test and there was a significant difference between the groups. Groups were found to be significantly different from goat and sheep milk samples in donkey milk samples when examined with respect to Na values, but not between goat and sheep milk samples. In terms of Mg and Ca values, all groups were significantly different from each other. There was a significant difference in Fe levels between donkey milk samples with sheep milk samples, and sheep milk samples with goat milk samples, but no difference was found between donkey milk samples and goat milk samples. In comparison of Cu values, there was a significant difference between sheep and goat milk samples, whereas when Zn values were examined, there was a difference between donkey milk samples with sheep milk samples, and sheep milk samples with goat milk samples.
Conclusıons
The concentrations of essential elements revealed average levels comparable to the other reported studies in the world. The results of this study showed a low health risk of human exposure to heavy metals through milk consumption. The levels of these essential element and heavy metals need further researches in other dairy products from the study region.
Acknowledgments
This paper was presented at the International Conference on Agriculture, Forest, Food Sciences and Technologies (ICAFOF) which took place on May 15-17, 2017, in Cappadocia/Turkey.
Statement of conflict of interest
Authors have declared no conflict of interest.
Figures
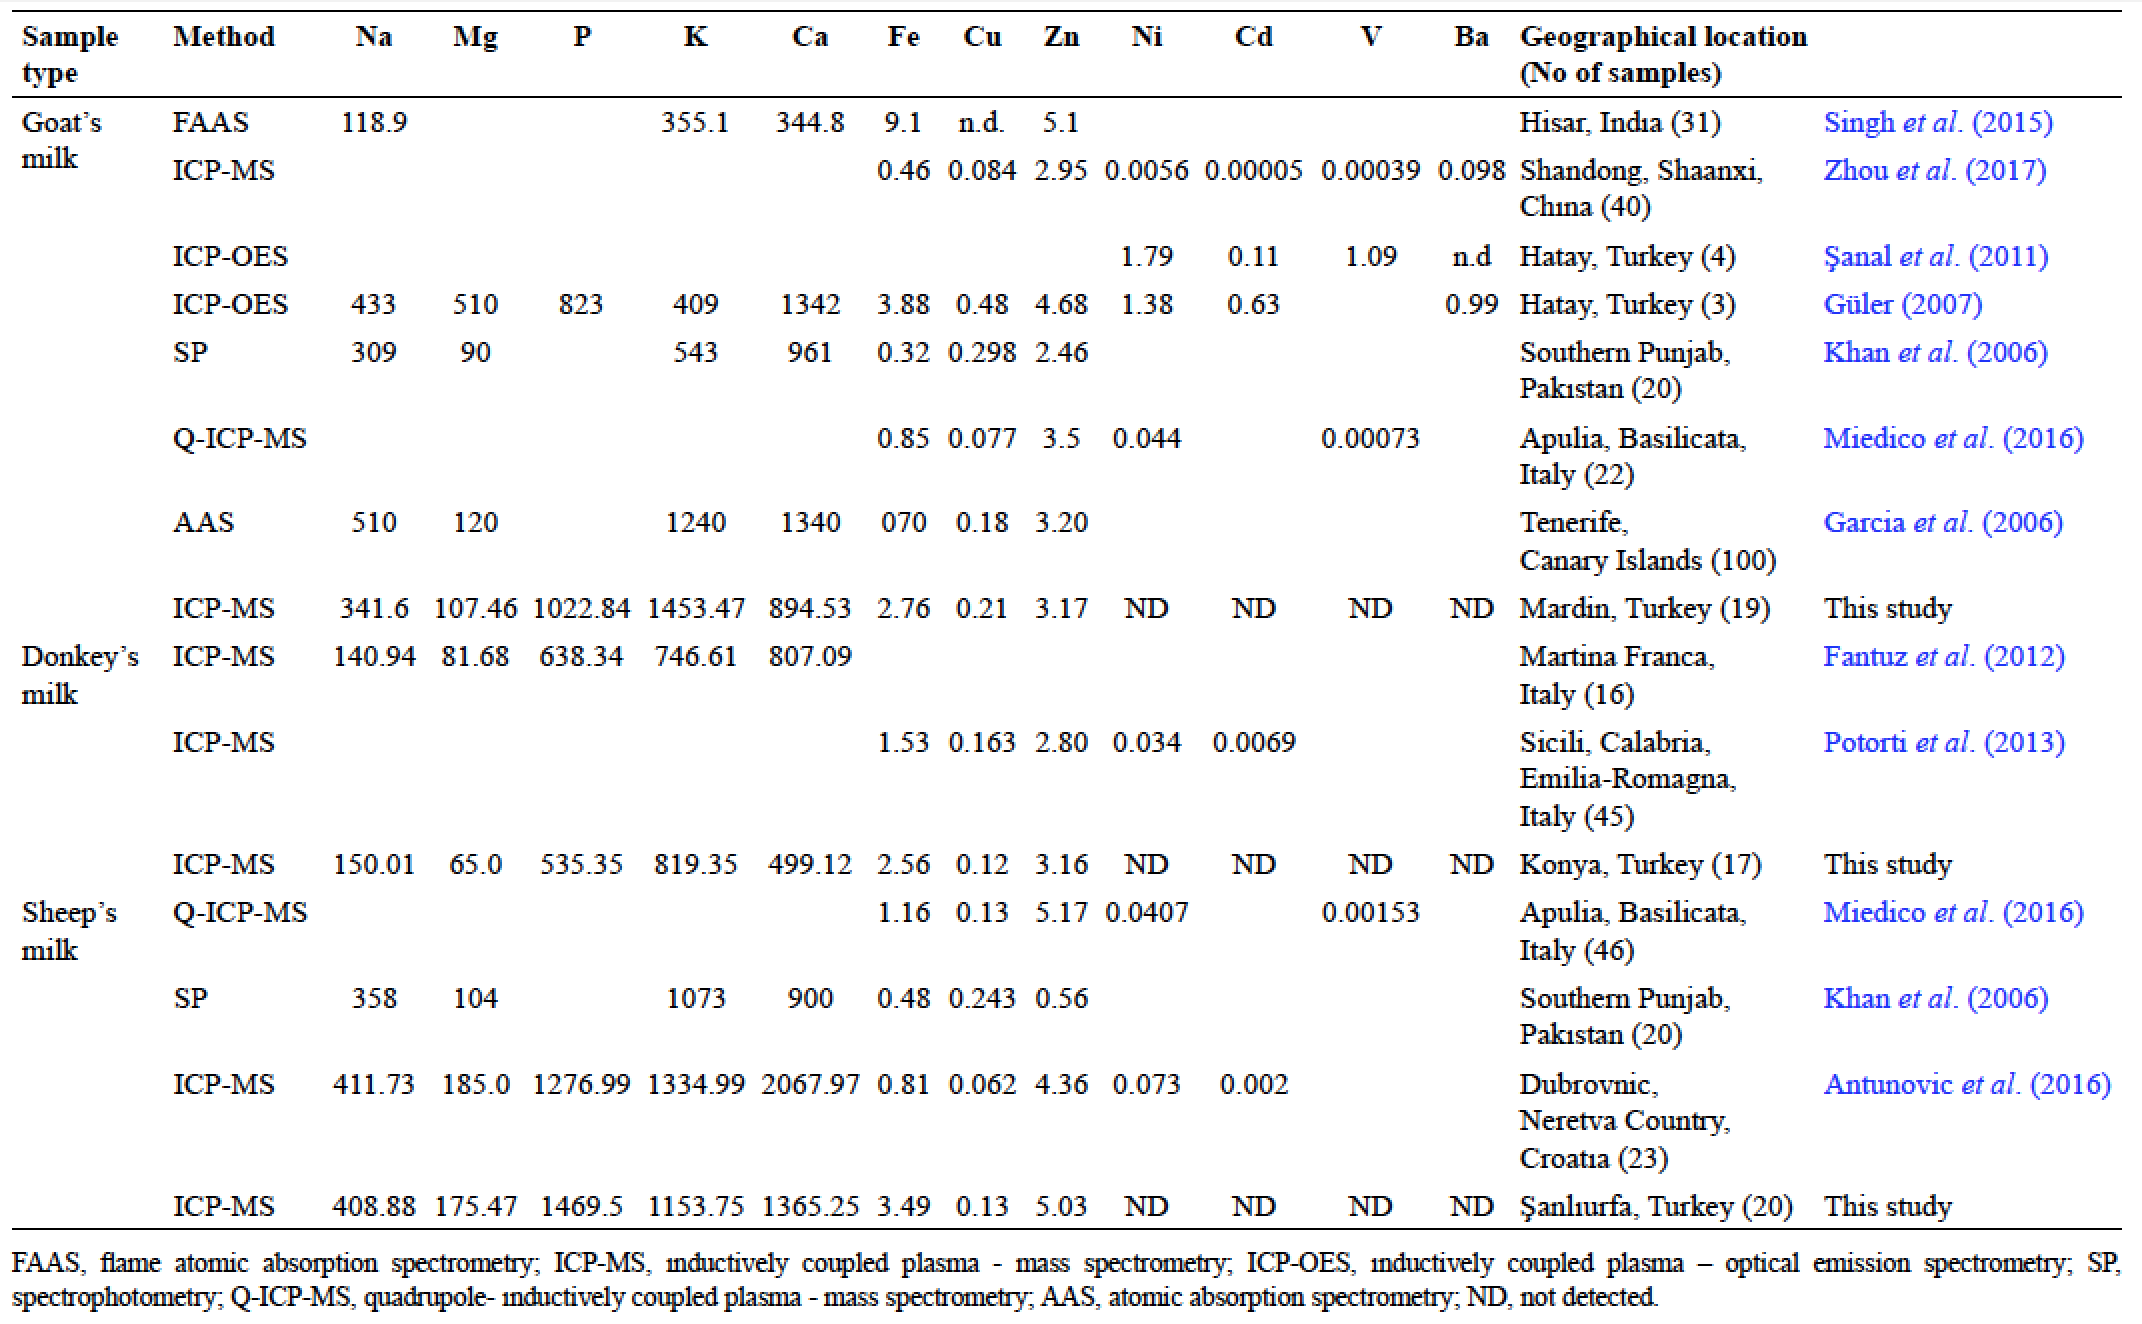
Mean concentrations in donkey’s milk, goat’s milk, and sheep’s milk reported in literature (wet weight mg L-1).
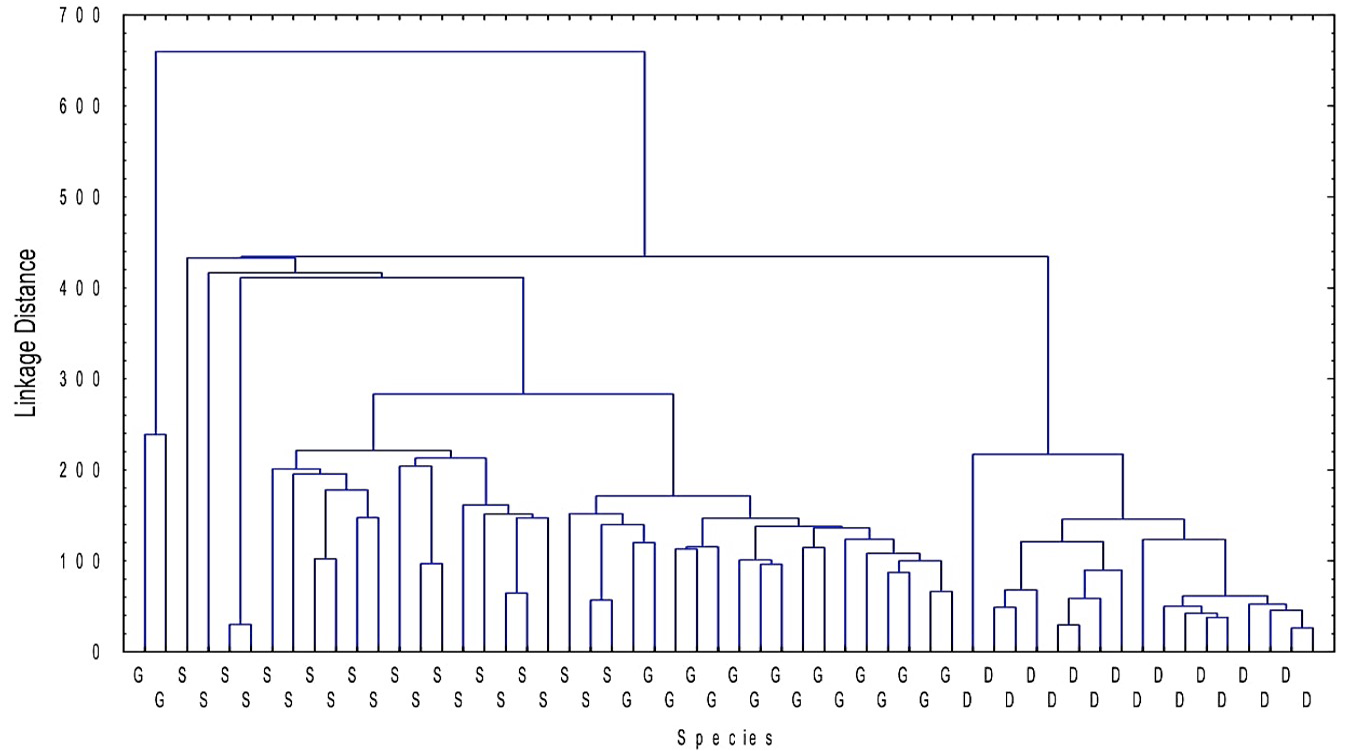
Hierarchical clustring results of donkey, goat and sheep milk samples (dendrogram).
References
- Anonymous, 2017. Livestock data of Turkey. Avaliable at: http://www.tarim.gov.tr/sgb/Belgeler/SagMenuVeriler/HAYGEM.pdf (accessed 06/07/2017).
- Antunović, Z., Marić, I., Novoselec, J., Lončarić, Z., Mioč, B., Engler, M. and Klir, Ž., 2016. Effect of lactation stage on the concentration of essential and selected toxic elements in milk of Dubrovačka ruda-Croatian endangered breed. Mljekarstvo, 66: 312-321. https://doi.org/10.15567/mljekarstvo.2016.0407[CrossRef]
- Aspri, M., Economou, N. and Papademas, P., 2017. Donkey milk: An overview on functionality, technology, and future prospects. Fd. Rev. Int., 33: 316-333. https://doi.org/10.1080/87559129.2016.1175014[CrossRef]
- Ayar, A., Sert, D. and Akın, N., 2009. The trace metal levels in milk and dairy products consumed in middle Anatolia-Turkey. Environ. Monit. Assess., 152: 1-12. https://doi.org/10.1007/s10661-008-0291-9[CrossRef]
- Bilandžić, N., Đokić, M., Sedak, M., Solomun, B., Varenina, I., Knežević, Z. and Benić, M., 2011. Trace element levels in raw milk from northern and southern regions of Croatia. Fd. Chem., 127: 63-66. https://doi.org/10.1016/j.foodchem.2010.12.084[CrossRef]
- Carroccio, A., Cavataio, F., Montalto, G., D’Amico, D., Alabrese, L. and Iacono, G., 2000. Intolerance to hydrolysed cow’s milk proteins in infants: Clinical characteristics and dietary treatment. Clin. exp. Allergy, 30: 1597-1603. https://doi.org/10.1046/j.1365-2222.2000.00925.x[CrossRef]
- Esposito, M., Miedico, O., Cavallo, S., Pellicanò, R., Rosato, G., Baldi, L. and Chiaravalle, A.E., 2016. Trace elements in raw milk of buffaloes (Bubalus bubalis) from Campania, Italy. Fd. Chem., 233: 378-384. https://doi.org/10.1016/j.foodchem.2017.04.124[CrossRef]
- Fantuz, F., Ferraro, S., Todini, L., Piloni, R., Mariani, P. and Salimei, E., 2012. Donkey milk concentration of calcium, phosphorus, potassium, sodium and magnesium. Int. Dairy J., 24: 143-145. https://doi.org/10.1016/j.idairyj.2011.10.013[CrossRef]
- FAO, 2015. Food outlook. Avaliable at: http://www.fao.org/3/a-I4581E.pdf (accessed 08/14/2017).
- Garcia, M.I.H., Puerto, P.P., Baquero, M.F., Rodriguez, E.R., Martin, J.D. and Romero, C.D., 2006. Mineral and trace element concentrations of dairy products from goats’ milk produced in Tenerife (Canary Islands). Int. Dairy J., 16: 182-185. https://doi.org/10.1016/j.idairyj.2005.01.011[CrossRef]
- Güler, Z., 2007. Levels of 24 minerals in local goat milk, its strained yoghurt and salted yoghurt (tuzlu yoğurt). Small Rumin. Res., 71: 130-137. https://doi.org/10.1016/j.smallrumres.2006.05.011[CrossRef]
- Haenlein, G.F.W., 2004. Goat milk in human nutrition. Small Rumin. Res., 51: 155-163. https://doi.org/10.1016/j.smallrumres.2003.08.010[CrossRef]
- Ismail, A., Riaz, M., Akhtar, S., Farooq, A., Shahzad, M. A. and Mujtaba, A., 2017. Intake of heavy metals through milk and toxicity assessment. Pakistan J. Zool., 49: 1413-1419. https://doi.org/10.17582/journal.pjz/2017.49.4.1413.1419[CrossRef]
- Kapila, R., Kavadi, P.K. and Kapila, S., 2013. Comparative evaluation of allergic sensitization to milk proteins of cow, buffalo and goat. Small Rumin. Res., 112: 191-198. https://doi.org/10.1016/j.smallrumres.2012.11.028[CrossRef]
- Khan, Z.I., Ashraf, M., Hussain, A., McDowell, L.R. and Ashraf, M.Y., 2006. Concentrations of minerals in milk of sheep and goats grazing similar pastures in a semiarid region of Pakistan. Small Rumin. Res., 65: 274-278. https://doi.org/10.1016/j.smallrumres.2005.07.050[CrossRef]
- Malacarne, M., Franceschi, P., Formaggioni, P., Pisani, G.M., Petrera, F., Abeni, F., Soffiantini, C.S. and Summer, A., 2015. Minerals content and distribution in milk from red deer (Cervus elaphus), fallow deer (Dama dama) and roe deer (Capreolus capreolus). Small Rumin. Res. 130: 208-215. https://doi.org/10.1016/j.smallrumres.2015.07.005[CrossRef]
- Mestawet, T.A., Girma, A., Adnoy, T., Devold, T.G., Narvhus, J.A. and Vegarud, G.E., 2012. Milk production, composition and variation at different lactation stages of four goat breeds in Ethiopia. Small Rumin. Res., 105: 176-181. https://doi.org/10.1016/j.smallrumres.2011.11.014[CrossRef]
- Miedico, O., Tarallo, M., Pompa, C. and Chiaravalle, A.E., 2016. Trace elements in sheep and goat milk samples from Apulia and Basilicata regions (Italy): Valuation by multivariate data analysis. Small Rumin. Res., 135: 60-65. https://doi.org/10.1016/j.smallrumres.2015.12.019[CrossRef]
- Mondal, M., Pyne, S.K., Samanta, G. and Roy, R., 2015. Studies on trace minerals in cow and buffalo milk in red lateritic zone of West Bengal. Int. J. Bio-res. Environ. Agric. Sci., 1: 36-38.
- Monti, G., Bertino, E., Muratore, M.C., Coscia, A., Cresi, F. and Silvestri, L., 2007. Efficacy of donkey’s milk in treating highly problematic cow’s milk allergic children: An in vivo and in vitro study. Pediatr. Allergy Immunol., 18: 258-264. https://doi.org/10.1111/j.1399-3038.2007.00521.x[CrossRef]
- Najarnezhad, V., Jalilzadeh-Amin, G., Anassori, E. and Zeinali, V., 2015. Lead and cadmium in raw buffalo, cow and ewe milk from west Azerbaijan, Iran. Fd. Addit. Contam. Part B Surveill., 8: 123-127. https://doi.org/10.1080/19393210.2015.1007396[CrossRef]
- Potortì, A.G., Di Bella, G., Turco, V.L., Rando, R. and Dugo, G., 2013. Non-toxic and potentially toxic elements in Italian donkey milk by ICP-MS and multivariate analysis. J. Fd. Compos. Anal., 31: 161-172. https://doi.org/10.1016/j.jfca.2013.05.006[CrossRef]
- Rahimi, E., 2013. Lead and cadmium concentrations in goat, cow, sheep, and buffalo milks from different region of Iran. Fd. Chem., 136: 389-391. https://doi.org/10.1016/j.foodchem.2012.09.016[CrossRef]
- Shailaja, M., Reddy, Y.S., Kalakumar, B.D., Brinda, S.A., Manohar, G. and Kumar, B.D., 2014. Lead and trace element levels in milk and blood of buffaloes (Bubalus bubalis) from Hyderabad, India. Bull. environ. Contam. Toxicol. 92: 698-702. https://doi.org/10.1007/s00128-014-1258-x[CrossRef]
- Silanikove, N., 2000. The physiological basis of adaptation in goats to harsh environments. Small Rumin. Res., 35: 181-193. https://doi.org/10.1016/S0921-4488(99)00096-6[CrossRef]
- Singh, M., Yadav, P., Garg, V.K., Sharma, A., Singh, B. and Sharma, H., 2015. Quantification of minerals and trace elements in raw caprine milk using flame atomic absorption spectrophotometry and flame photometry. J. Fd. Sci. Technol., 52: 5299-5304. https://doi.org/10.1007/s13197-014-1538-9[CrossRef]
- Şanal, H., Güler, Z. and Park, Y.W., 2011. Profiles of non-essential trace elements in ewe and goat milk and their yoghurt, torba yoghurt and whey. Fd. Addit. Contam. B, 4: 275-281. https://doi.org/10.1080/19393210.2011.617520[CrossRef]
- Tesse, R., Paglialunga, C., Braccio, S. and Armenio, L., 2009. Adequacy and tolerance to ass’s milk in an Italian cohort of children with cow’s milk allergy. Ital. J. Pediatr., 35: 19-22. https://doi.org/10.1186/1824-7288-35-19[CrossRef]
- Zamberlin, Š., Antunac, N., Havranek, J. and Samaržija, D., 2012. Mineral elements in milk and dairy products, Mljekarstvo, 62: 111-125.
- Zhou, X., Qu, X., Zhao, S., Wang, J., Li, S. and Zheng, N., 2016. Analysis of 22 elements in milk, feed, and water of dairy cow, goat, and buffalo from different regions of China. Biol. Trace Elem. Res., 176: 120-129. https://doi.org/10.1007/s12011-016-0819-8[CrossRef]
Cited by 1 article
In journals published by ResearchersLinks.
Services
Article usage statistics
Loading…