After treatment with tulathromycin, lung of group II showed slight congestion of thickened pulmonary blood vessels, (Figure 1a), group III showed pneumonic area represented by thickening of the interalveolar septa by extensive leukocytic infiltration, (Figure 1b), peribronchial lymphoid hyperplasia, (Figure. 1c) and severe vascular congestion, (Figure. 1d). Lung of group IV showed vascular congestion with perivascular leukocytic aggregation, (Figure 1e). Similar findings early observed by Nassar et al. (2013).
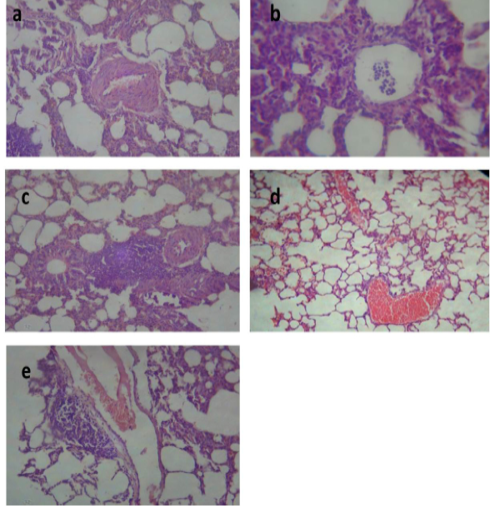
Figure 1: Lung of group (II) showing slight congestion of thickened pulmonary blood vessels (a) (H&E ×520). Lung of group (III) showing pneumonic area represented by thickening of the interalveolar septa by extensive leukocytic infiltration mostly polymorphonuclears (b) (H&E ×400), peribronchial lymphoid hyperplasia (c) and severe vascular congestion (d) (H&E ×100). Lung of group (IV) showing vascular congestion with perivascular leukocytic aggregation (e) (H&E ×100).
Table 5: Effect of tulathromycin on some biochemical parameters of control and infected rabbits
D Data are expressed as means ± SE of 10 rabbits. * P ≤ 0.05 ** P ≤ 0.01 *** P ≤ 0.001 * Compared with group I; •P ≤ 0.05 •• P ≤ 0.01 ••• P ≤ 0.001 • Compared with group III.
Group I: (control) orally given saline solution (0.025 ml/kg b.wt, s/c). Group II: non infected and treated subcutaneously with a single dose of tulathromycin (2.5 mg/kg b.wt). Group III: (Infected non treated) infected with Pasteurella multocida 0.2 ml/rabbit of broth culture contain 5×10⁹ bacterial cell/ml S/C. Group IV: infected rabbits treated with tulathromycin (2.5 mg/kg b.wt, S/C) as a single dose.
Liver of group II revealed congested central vein and dilated hepatic sinusoids, (Figure 2a). Liver of group III showed severe congestion of the central veins, (Figure 2b). Cholangitis represented thickening of the bile duct wall by vascular congestion, edema and leukocytic infiltration besides cholestasis, (Figure 2c). Vacuolation of hepatocytes was also noted, (Figure 2d). In the liver of group IV, hepatic parenchyma showed residual hemorrhage but normal tissue articulation, (Figure 2e). Those outcomes affirmed the results of biochemical parameters and were in harmony with those of Dwivedi and Charan, (2001).
Kidneys of group II demonstrated focal leukocytic aggregation in the renal medulla, (Figure 3a). In kidneys of group III, vascular congestion and hemorrhage (Figure 3b) with fibrous connective tissue proliferation (Figure 3c) were observed. Meanwhile, kidney of group IV showed cystic dilatation of few renal tubules, renal casts, hydropic degeneration of the epithelial lining of some renal tubules and vascular congestion, (Figure 3d). These changes correlated with biochemical analysis of kidney function and were in concurrence with those reported by Palócz et al. (2014).
Histological picture of heart of group II revealed mild congestion of cardiac blood vessels, (Figure 4a). Heart of group III showed sever vascular congestion (Figure 4b), leukocytic infiltration between the myocardiocytes (Figure 4c) and inter muscular edema (Figure 4d). Those pathological findings were in agreement with those reported by Palócz et al. (2014). In group IV, heart showed very mild congestion of blood vessels with normal architecture of heart muscles (Figure 4e).
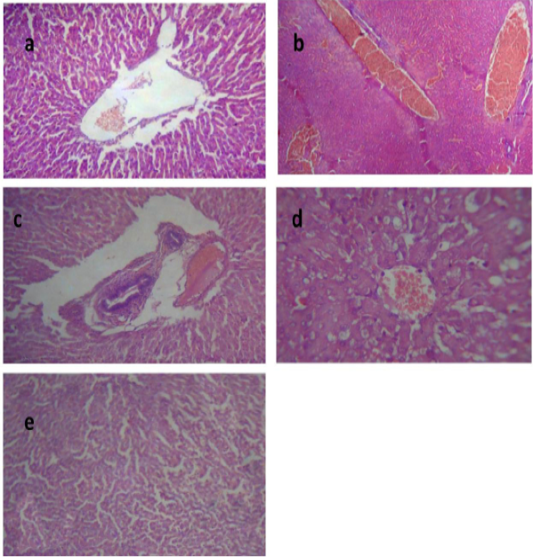
Figure 2: Liver of group (II) showing congested central vein and dilated hepatic sinusoids (a) (H&E ×400). Liver of group (III) showing severe congestion of the central veins (b). Cholangitis represented thickening of the bile duct wall by vascular congestion, edema and leukocytic infiltration besides cholestasis (c) (H&E ×100).Vacuolation of the hepatocytes (d) (H&E ×400).Liver of group (IV) showing interstitial hemorrhage and normal tissue architecture (e) (H&E ×520).
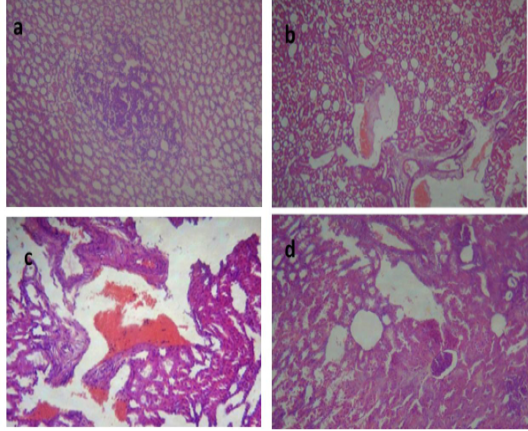
Figure 3: Kidney of group (II) showing focal leukocytic aggregation in the renal medulla (a) (H&E ×400). kidney of group (III) showing vascular congestion and hemorrhage (b) (H&E ×400) with fibrous connective tissue proliferation (c) (H&E ×100). Kidney of group (IV) showing cystic dilatation of few renal tubules, renal casts, hydropic degeneration of the epithelial lining of some renal tubules and vascular congestion (d) (H&E ×400).
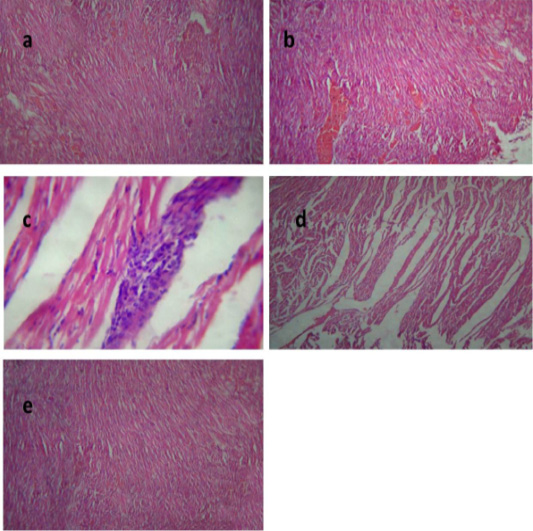
Figure 4: Heart of group (II) showing mild congestion of cardiac blood vessels (a) (H&E ×400). Heart of group (III) showing sever vascular congestion (b), leukocytic infiltration between the myocardiocytes (c) and intermuscular edema (d) (H&E ×100). Heart of group (IV) showing mild congestion of cardiac blood vessels (e) (H&E ×400).

