Animal, Diet and Feeding Program
Nine hundred 1–day–old male broiler chicken (Ross, Betagro Agro–Group Public Co. Ltd.) were randomly distributed into 30 floor pen of 30 broilers so that ten replicates were available for each of the two treatments (high CP and EAA supplemented groups) and the control group. The commercial soybean meal based diets used in this experiment were suggested by the National Research Council (1994). From 1 to 21 day of age, the chicken of control, high CP and EAA supplemented group were fed with crude protein of 22%, 28% and 22%, respectively. While the diet formula of EAA supplemented group was modified from control by adding methionine, lysine and threonine to final concentration similar to high CP supplemented group as shown in Table 1. All birds had access to feed and water ad libitum.
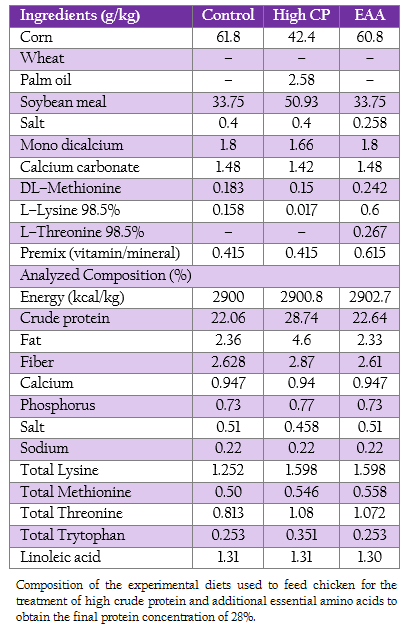
Table 1: : Composition of the experimental diets used to feed chicken for the treatment of high crude protein and additional essential amino acids to obtain the final protein concentration of 28%.
Intestinal Sample Collection
Two birds were randomly selected from each of the 10 pens per treatment (20 birds per treatment) at 21 days post hatch. Jejunum, ileum and cecum of the bird killed by carbon dioxide asphyxiation were collected. The tissues were steriled by 70% ethanol, washed twice by sterile water and then kept at –20C until use.
Genomic DNA Extraction
DNA was extracted from 1 g of the mixture of the digesta and the intestinal wall using the modified method of Nakphaichit et al., (2011). In brief, the bacterial cells were collected from a 10x dilution sample by homogenizing in a stomacher blender (Seward Medical, London) for 2 min followed by centrifugation at 100 xg for 10 min at 4C to remove the debris. One milliliter of supernatant collected was centrifuged at 15,000 xg for 10 min at 4C. The cell pellets obtained which mainly composed of bacteria were washed twice with 1 ml PBS (8 g NaCl, 0.2 g KCl, 1.44 g Na2HPO4, 0.24 g KH2PO4 in 1 L at pH 8.0) and then suspended in 900 µl of PBS. The bacterial suspension mixed with 300 l of phenol–chloroform–isoamyl alcohol (25:24:1) was lysed using a mini–bead beater (Biospec Products Inc., Bartlesville, USA) at 2,700 rpm for 180 sec containing 0.3 g zirconium beads (0.1 mm in diameter, As One Corporation, Osaka, Japan). The cell debris was removed by centrifugation at 20,000 xg for 2 min. The bacterial DNA obtained from upper layer was further purified using the QIAamp DNA Stool Mini Kit (Qiagen, Germany) according to manufacturer’s instructions and stored at –20 C until use.
Villi Measurement
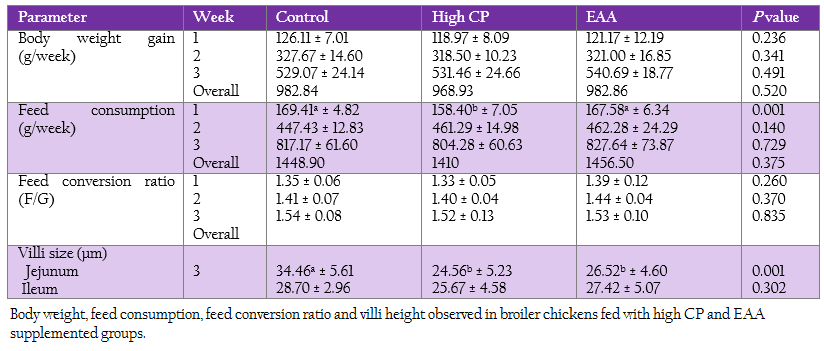
The jejunum and ileum samples were cut by the size of 1.5 × 1.5 cm2, flushed through with saline solution, fixed on foam using pins and placed into 100 g/l buffered formalin for further analysis. Paraffin–embedded tissues were sectioned to a thickness of 5 m. Tissue slides were stained using 0.02% toluidine blue for light microscope measurement. The villous height was measured in from the base of the lamina propria to the apex of the villous. The unit of measurement is micrometre (µM) and all reported villi values were an average of 5 measurements per tissue. Assessments were made only on cleanly sectioned, perpendicular villi as previously described by Sun et al., (2005).
Quantitative Real Time PCR
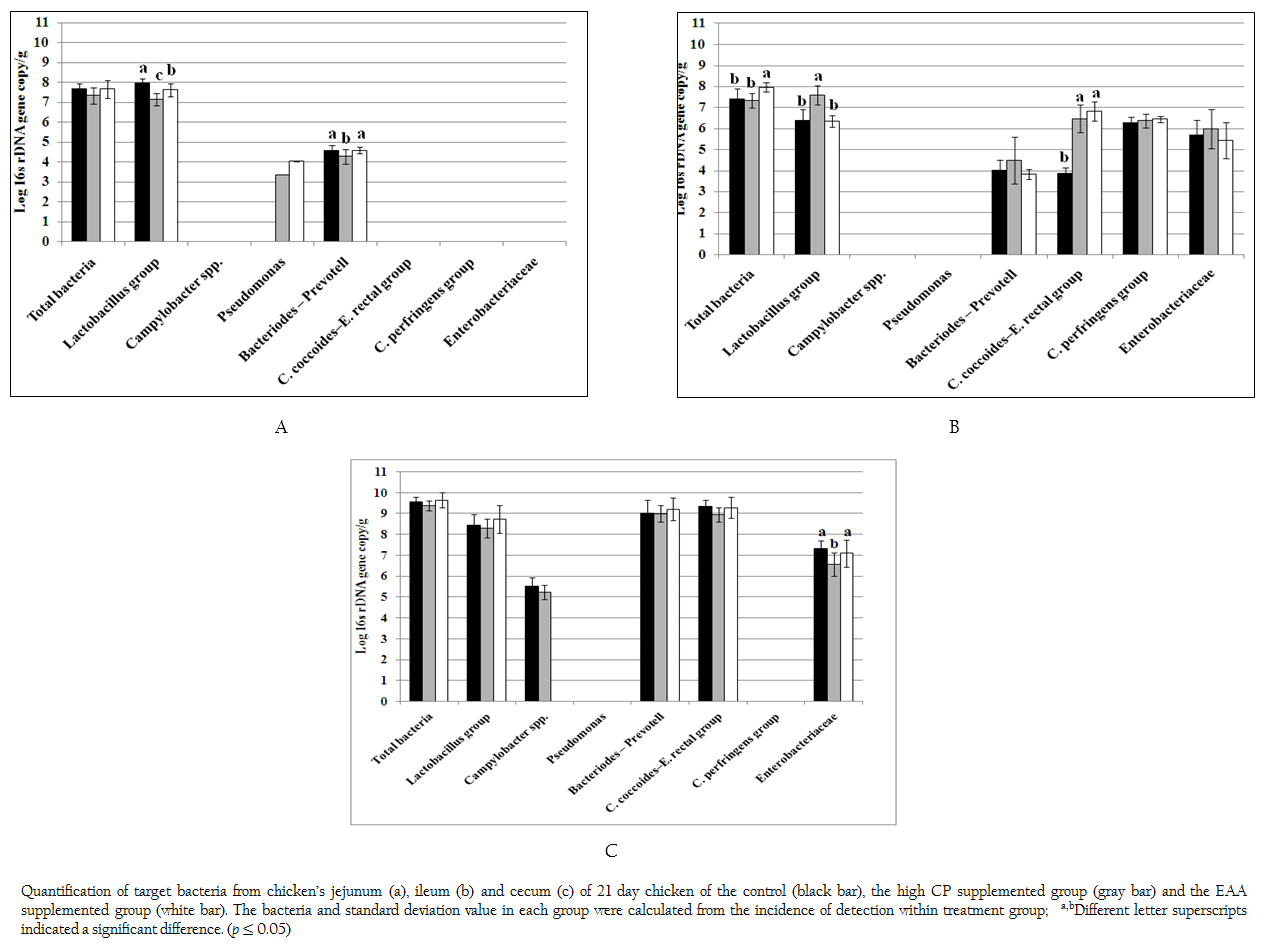
Real time PCR using SYBR technology was used to quantify the target group of microorganism by LightCycler® 480 (Roche, Germany). The oligonucleotide primers, optimal annealing temperature and their PCR products size are summarized in Table 2. To obtain a standard curve for absolute quantification, the modified method of Wise and Siragusa (2007) was performed. Standard curves of total bacteria, Lactobacillus group, Campylobacter, Acinetobacter, Psedomonus, Bifidobacterium, Bacteriodes – Prevotell – Porphyromonas group, Clostridium coccoides–Enterobacter rectal group, C. perfringens group and Enterobacteriaceae were constructed using specific primers to amplify the genomic DNA of Escherichia coli TISTR 527, Lactobacillus salivarius AC21, Campylobacter jejuni ATCC 33291, Acinetobacter calcoaceticus TISTR 360, Pseudomonas sp. TISTR 1249, Bifidobacterium bifidum JCM 1255, Bacteriodes fragilis ATCC 25285, Ruminococcus productus JGD 07421, C. perfringens ATCC 13124 and Salmonella Typhimurium TISTR 292, respectively. Each PCR products were cloned into pGEM–T Easy vector according to manufacturer’s instructions (Promega, Madison, WI). Then, the recombinant plasmids were diluted by serial 10–fold dilution until concentration of 109 was reached. The set of serial dilution series in each group were used as a template for the standard curve. The standard curves were created by LightCycler® 480 software using second derivative maximum (Roach Applied Science, Mannheim, Germany). The slope of the standard curve is used to determine reaction efficiency in which accurate quantification require the efficiency of 1.8–2 (E = 10–1/slope). In addition, the error value is evaluated for the accuracy of the quantification result base on the standard curve. An acceptable value should be < 0.2.
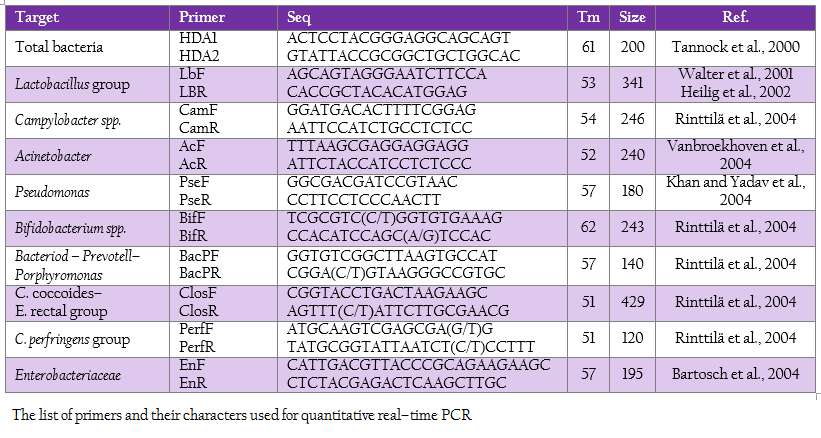
Table 2: The list of primers and their characters used for quantitative real–time PCR
The reaction mixture contained 10 µl of 2x SYBR Green I master mix (Roche, Germany), 0.8 µl of 5 pmol forward and reverse primers, 2 µl of DNA template (50–100 ng) and dH2O added to obtain the final volume of 20 µl. Amplification program included an initial denaturation at 95C for 5 min, followed by 45 cycles consisting of denaturation at 95C for 10 sec, annealing temperature according to the Tm of primer for 10 sec and extension at 72C for 5–18 sec depending on PCR product size. To confirm the specific amplification of the target DNA, dissociation curve was created in the following cycles of a denaturation step at 95 oC for 5 sec, temperature decreasing step to 65C for 1 min and continuous temperature increasing from 65 oC to 97 oC every 12 sec signal measurement. For statistical analysis, in the case where the incidence of detection within treatment group was less than 100%, the remaining undetection replicates were considered to be at the theoretical limit of detection for purpose of calculating the mean and standard deviation.
Short Chain Fatty Acid Analysis
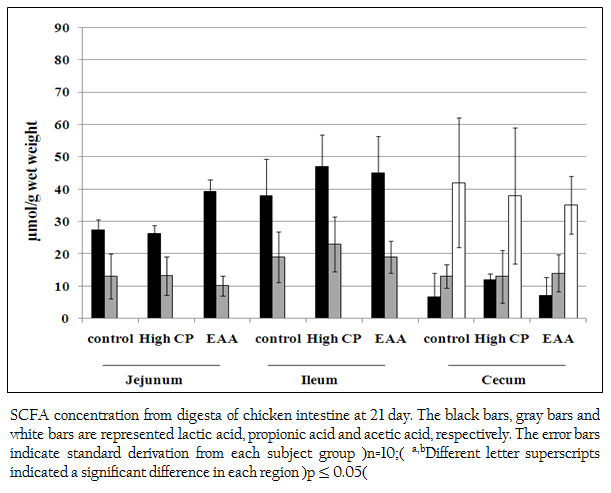
The concentration of lactic acid, acetic acid, propionic acid and butyric acid were measured by high performance liquid chromatography. Samples were prepared using the modification method of Zeppa et al., (2001). Briefly, one gram of digesta and tissue was diluted by adding 4 ml of 0.008 M H2SO4 (mobile phase) and incubated on ice. The cool solution was homogenized every 10 min by vortex mixer for one hour. The supernatant was collected by centrifugation at 15,000 xg for 10 min. The concentration of 0.1%, 0.2%, 0.3%, 0.4% and 0.5% v/v of each acid were performed for their standard curve. The 20 µl of mixture solution containing 3 volume of analyzed sample or standard solution and 1 volume of internal standard (0.2 % w/v tartaric acid) filtered through 0.2 µm PVDF Syringe filters (Verical, Bangkok, Thailand) was injected into BreezeTM 2 HPLC system (Waters, USA) with Rezex ROR–Organic Acid column (Phenomenex, USA) at 60C. Mobile phase was run at the flow rate of 0.6 ml/min. The signal was detected by UV detector at 210 nm. All chemical were purchased in HPLC analytical grade.
Statistical Analysis
All results were analyzed by one way ANOVA test (SPSS program version 12, Munich, Germany). The group difference was determined by LSD and Duncan method. Differences were quantified at significant p ≤ 0.05.