
The Iraqi agricultural sector is faced with many challenges that affect its agricultural development. The water crisis and the climate crisis, mismanagement and ineffective planning are among the greatest challenges facing the world today which affect agricultural production negatively. Given this, the present study aims to investigate the impact of water scarcity and agricultural resources on the percentage of Iraq’s agricultural sector in the gdp from 1990 to 2023. The study makes descriptive and numerical analyses of descriptive and numerical analyses of documented and undocumented data from different sources. A time series analysis was performed by the autoregressive model with distributed lag (ARDL) to test the model’s consistency and duration. The outcome of the research shows that the model passes all the standard tests and displays no association with the dependent variable or lack of heteroscedasticity. The residues were usually allocated, which agree with the analytical results. The error correction factor was negative and significant at 1%. The value of error correction factor is -1.109420, indicates a long-run relationship between variables. This relationship points to weak water resource management in Iraq, a lack of foresight in anticipating climate change, and low water revenues, which have a direct impact on water security. This, in turn, affects agricultural production and its contribution to gross domestic product , In light of the research results, the scientist believes that Iraq ought to periodically adopt water policy research based on trends in the international and regional environment to endorse water security. Also to reduce the variation in consumption, which indicates poor sustainability. Also, she proposed optimising the management of the agricultural sector and increasing productivity through modern agricultural technology, and increasing use of science and use of climate data in planning. This will improve the output of crops as well as enhance the participation of agriculture in GDP.
Research Article · Volume 39, Issue 3, 17 September 2026 · Open Access
Econometric Analysis of the Cumulative Impact of Water Scarcity and Productive Resources on the Contribution of the Agricultural Sector to the Gross Domestic Product in Iraq During the Period (1990-2023)
· · · ·
Affiliations & Notes ⌄
- 1Northern Technical University, Agricultural Technical College, Mosul, Nineveh Governorate, Iraq
- 2Ù¢College of Agriculture and Forestry, University of Mosul, Mosul, Iraq
- 33Nimrud Technical Institute, Northern Technical University, Mosul, Iraq. *Correspondence | Doaa Qasim Sabri Ali Al-Younis, Northern Technical University, Agricultural Technical College, Mosul, Nineveh Governorate, Iraq
- 4Email: dqasm0478@ntu.edu.iq
Article Info ⌄
- Journal:
- Pakistan Journal of Agricultural Research
- Published:
- 17 September 2026
From the article
- The average per capita share of water recorded a significant decline as total water revenues declined significantly during the study period.
- In Iraq, there is poor water resource management, poor consideration of climate change forecasts, and low water revenues affecting water security that has impacted agricultural production and contribution to the gross domestic product.
- The results obtained indicate that the share of the agricultural sector in GDP is affected by structural constraints related to water scarcity and the level of agricultural production more than it is affected by constraints represented by traditional inputs such as agricultural labor and agricultural investments.
- The reason for the absence of a long-term equilibrium relationship for agricultural investments is due to the weak cumulative effect of investment spending on the share of agricultural output in GDP, along with deviations in the efficiency of resource allocation.
Selected from the article's own text.
Abstract
Introduction
Iraq’s agricultural sector is one of the main contributors to the economy as it provides food for the population, generates employment and contributes to rural development (FAO, 2005). This sector is directly linked to the availability of water resources, as it depends heavily on water, the scarcity of which leads to a decline in agricultural performance and efficiency and, consequently, a decline in its contribution to gross domestic product . According to Encyclopedia Britannica (undated, p. 3), agriculture has always been an essential part of the country’s economy and society. The country benefited from the abundant water supply and fertility of the soil of the Tigris and Euphrates rivers. Over the past few decades, though, the share of agriculture in overall GDP has reduced drastically. In 1980 it was around 18%. Further, it reached a peak of 3.2% in 2021. This is mainly due to three factors which are interconnected to one another. The first is the influence of security and political instability, which is caused by the 80 warfare and Obstruction in the economy in 2003 and then disorderly period. This instability resulted in the almost total devastation of agricultural infrastructure, a mass migration of important people, and a weakening of the systems of support and guidance.
The second axis is the structural shift towards a single-income economy model, dominated by oil revenues, which constitute more than 95% of the general budget revenues. This dominance has led to the systematic neglect of the agricultural sector, resulting in its share of government investment falling to less than 3%, Consequently, its share of gross domestic product declined. depriving it of the resources necessary for modernization and development .
The third factor is the worsening water crisis, which has interacted with the previous factors to exacerbate the challenges. This crisis manifested itself in a sharp decline in the flow of major rivers by up to 40%, accompanied by soil salinization, with approximately 30% of arable land affected by varying degrees of salinity. This has led to the loss of an estimated 50% of irrigated areas and a sharp decline in the productivity of strategic crops, ranging from 35% to 60% (FAO, 2022).
These factors combined have resulted in a fundamental shift in Iraq’s food security, with the country moving from a state of near self-sufficiency to structural dependence on imports to meet approximately 70% of its food needs, making it vulnerable to global market fluctuations and posing a strategic threat to its food sovereignty (United Nations, 223).
This study therefore seeks to shed light on this issue and analyse the factors behind the decline of the agricultural sector, with a view to providing an in-depth analytical perspective that will contribute to the development of strategies and policies capable of reviving this vital sector
First axis: Study methodology
Research problem
The research problem lies in analysing the economic and statistical impact of the decline in the agricultural sector’s share of gross domestic product, which is the result of the cumulative effect of two main factors:
- First: Water scarcity and the worsening water crisis resulting from the policies pursued by neighboring countries, particularly the construction of dams in countries located upstream, in addition to the effects of climate change, represented by rising temperatures and declining rainfall, which have had a negative impact on the agricultural sector.
- Second: The instability of government policies and weak infrastructure have led to the deterioration of local productive resources, which in turn has led to a decline in investment in the agricultural sector. As a result, the country has become increasingly dependent on agricultural imports to meet its food needs, which has had a negative impact on the agricultural sector and reduced its share of gross domestic product.
Importance of the research
The importance of the study is as follows:
- Highlighting the most important challenges facing the agricultural sector in Iraq, the most important of which is water scarcity, which plays a vital role in agricultural production. This is studied by using the average per capita share of water returns and the total water returns from the Tigris and Euphrates rivers.
- Enhancing national food security and economic stability, and encouraging the shift towards contributing to local economic development by analysing the economic and standard impact of water and productive resource shortages on the agricultural sector’s share of gross domestic product.
Research objectives
The objectives that this research intends to achieve.
- The major objectives of the paper are: (1) To evaluate the overall scale of Iraqi water import trends, per capita water amount, and various economic and agricultural variables in the period 1990-2023;
- To investigate the impact of water scarcity and productive resources on the contribution of agricultural sector to GDP of Iraq in the period 1990-1923.
- To determine the cointegrating relationship between the dependent variable and the independent variables in both the short and long run, using the ARDL model and the Error Correction Model (ECM) within the ARDL methodology
Research hypothesis
Research has assumed that increasing water scarcity and degrading production resources (agricultural spending and labour) would cause a structural and sustained fall in the contribution of agriculture to GDP during the period of study (1990-2023).
Study methodology
This study uses econometric method to achieve the objectives, the equations and models used are.
- The model used to calculate annual growth rate increment of variables during research period (1990-2023) is:
G = ( eB -1) *100
Where; G= The annual growth rate that is the dependent variable. B = Find the values of independent variables in the linear regression equation. e= represents the constant
- Eviews 12 used the Distributed Autoregressive Lag Model (ARDL) for Distributed Autoregressive Analysis.
Research structure
Three topics are analyzed in this investigation. The first theme deals with the methodology of research, the second one analyses the overall trends of water resources and economic variables, and their impact on the agricultural sector contribution to GDP, and lastly the third theme involves an estimation of an extended regression distribution model (ARDL) of the agricultural sector contribution to GDP 1990-2023.
Data sources
To achieve the objective of the research for this period (1990-2023) the investigators used secondary data which was taken from official document and other sources Previous studies and books of the subject of research published by local authorities.
Literature review
This part of the research reviews the most important previous studies that dealt with the topic of water resources and their impact on agricultural performance, in order to identify the key findings reached by researchers and the methodological approaches used to determine the research gap and to highlight the current study in comparison to previous studies
AbuTurab (2021) carried out a study on the water crisis in Iraq and its economic dimensions (with special reference to Basra). The researcher used only a descriptive approach in the research, in which he explained the water problem in Iraq, which is characterised by a decrease in quantity and deterioration in quality as a result of natural factors such as global climate change and other human factors, most notably water pollution, and political effects, especially after 2003, in addition to the policies of neighboring countries such as Turkey, Syria, and Iran, which are all riparian states that have begun to dominate the sources of water resources, especially what Turkey has done with irrigation projects and the construction of dams and reservoirs on the Euphrates and Tigris rivers, as well as increasing population growth rates with growing economic development requirements and increased demand for food. He came to a number of conclusions, the most important of which is that Iraq is suffering from a severe water crisis as a result of the policies of neighbouring countries, as well as increasing population growth and demand for water, which has had a negative impact on all aspects of life in Iraq. He also made a number of recommendations, including the need to resolve conflicts between Iraq and its neighbouring countries, regulate the use of water resources and protect the Iraqi environment, as well as urging the provinces north of Basra not to exceed Basra’s share of water resources.
Hashim and Kamal (2023) presented a study on the impact of water resources on agricultural economic development in Egypt. The study aimed to assess the impact of water resources on the development of the agricultural economy in Egypt during the period 2000-2022. This research relied on descriptive and quantitative statistical analysis methods to estimate the proposed regression model. The most important findings were that the per capita share of available water and the relative importance of agricultural production to gross domestic product took a statistically downward trend, with an average annual rate of change of approximately (1.2- 2- %), respectively. On the other hand, agricultural labour productivity, water productivity and land productivity showed a statistically significant upward trend, with an average annual rate of change of approximately 13%, 12% and 13%, respectively, during the study period. It was also found that a 10% change in the amount of water resources used in agriculture leads to a 3% change in the area under cultivation in the same direction, and a 10% change in the area under cultivation leads to a 96% change in the value of agricultural production at the 10% level. Similarly, a 10% change in the value of agricultural production leads to a 1.3% change in gross domestic product in the same direction. Therefore, the study recommends conducting further analytical studies to assess the impact of water resources on agricultural economic development and, consequently, on overall economic development.
Ali et al. (2024) presented a study entitled Measuring the Impact of Water Scarcity on Agricultural Economic Development in Iraq. The study aimed to measure and analyse the impact of water scarcity on agricultural economic development in Iraq and to determine the extent to which periods of drought affect food security. The study relied on descriptive and quantitative statistical analysis methods using the ordinary least squares (OLS) method by iteration. The most important results obtained by the researcher were that there is a strong positive relationship between water abundance and cultivated areas, and that an increase in the amount of available water resources leads to an increase in the cultivated area by 141,129.2 dunums. Furthermore, an increase in cultivated areas by one dunum will lead to an increase in agricultural production by 0.00821. The study recommended the adoption of integrated water resource management in Iraq and improving the efficiency of water use through modern irrigation techniques such as sprinkler irrigation, hydroponics, and crop restructuring in order to achieve maximum water yield per unit of water used.
A review of previous studies shows that they focused on the impact of water scarcity or water use efficiency on agricultural production in part, while our study contributed to providing a comprehensive empirical analysis of the cumulative impact of water scarcity on the agricultural sector’s share of gross domestic product for the period 1990-2023 using the Ardl model to measure the direct and indirect impact between water scarcity and the contribution of the agricultural sector to GDP in the short and long term.
The second axis: The overall trends in water resources and economic variables affect the agricultural sector’s GDP contribution directly:
First: Development of total water imports, average per capita water share, and some agricultural and economic indicators in Iraq (1990-2023).
Each country’s agricultural development hinges on the availability of irrigable land resources and their distribution so that these resources can achieve a high yield in staple food crops that are the backbone of national income and so on . Thus, we presented Table 1 which shows the economic and agriculture development of Iraq from 1990 to the present. The water revenue volume has varied quite a bit between 34.81 billion cubic metre in 2015 and 81.64 billion cubic metre in 1994 as shown in Table 1. The average annual water revenue is about 56.332 billion cubic metre. The water volume has a standard deviation of 11.07014667 and a CV of 19.65154124%. The coefficient of variation shows that water usage is fairly constant but gradually declining.
As per a report, the average per capita water consumption has come down from 4.08 Trillion Cubic Metres (TCM) in 1994 to 988 Billion Cubic Metres (BCM) in 2015 owing to the water resource policies of our neighbouring countries and climate change impact. With a low per capita water consumption and lower seawater imports for desalinization. The yearly water consumption amounting to 2.122372 trillion cubic metres with a st. deviation of 8811.1187426 and a cv of 41.51575879% the data show a notable change in the water consumption. Likewise, the average per capita use of water has been considerably cut down. The management of water resources evidently has a huge structural gap and fixing it must as a priority become a goal of the government.
Water with consumption average of 2.122372 trillion cubic metres per annum has a standard deviation of 8811.1187426 and with a coefficient of variation of 41.51575879%. When it comes to agricultural production, in 1991 the water output was 9005275 million dollars which was reduced in 2016 to 459897 million dollars and the mean annual agricultural production of water was 5041599 million dollars with the standard deviation of 2518838 million dollars and coefficient variation was 50%. According to the standard deviation, the negative effects on Iraqi agricultural production were caused by the intensity of drought and climate change and also the dams of other countries that lessen the water flow. Between 1999 and 2006, both the quality and quantity of people engaged in agriculture increased significantly. The estimate for the year 1999 was 943,336 which was a low estimate. The estimate for the year 2006 was 21,104,070 which was a high estimate. On average annually, there were 1533670324 people employed in agriculture with a standard deviation of 372028706 and a coefficient of variation at 24.25741049%.
The standard deviation is significant as agricultural employment is dissimilar. In some areas, it’s hard to fill these job roles, while in others new openings are popping up. Seasonal factors may also account for variations in the data, as the demand for agricultural labor is subject to seasonal variation.
The software applications that were the most underpowered in 1991 cost 116 billion dollars and the ones in 2014 cost 9.627 billion dollars. Between 2014 and 2017, the average annual investment was 4.602 billion dollars, with standard deviation 3.551.47 and coefficient of variation 77.016798454% in agriculture. New investment was seen for new entrants as the coefficient of variation rose due to increasing agricultural spending leading to varied returns. The competition added further to the differences in performance of the different projects. National income experienced a significant increase during the review period. The national economy’s average annual income has been $10,542,576,459.7 billion with a standard deviation of $8,901,242,948 billion and a coefficient of variation of 85.15836246 per cent. In 1991 it dropped to $36.922 billion and in 2013 it rose to all-time high of $243.518 billion. A significant level of fluctuation would demonstrate the variability of the global oil price, which is crucial to the Iraqi economy. The contribution of agricultural output to gross domestic product (GDP) fell significantly over the period to 0.883 % in 2017. The value of agricultural output peaked at 30,949 in 1991, while it had an annual average of 6,718 and a standard deviation of 5,872 and coefficient of variation of 86.0616038%. This means trillions of dollars are produced from the agri-field but with the passage of time and water scarcity and lack of production potential, the importance and productivity of this sector has worn out. The alteration would considerably modify the economic production structure. It’s necessary to review the policies that enable this tactic and its endorsement.
Table 2 analyses the equations pertaining to annual growth of significant variables such as water consumption, agricultural output, agricultural investment, and labour force in agriculture. This analysis will evaluate the effect of these factors on the percentage of agriculture production to GDP. The outcome includes the coefficient of determination (R²) and a F-test for validity of the statistical model. The insights obtained from the study can help in making a meaningful contribution to the agricultural economy based on water.
The table shows that the annual growth rat of total water revenues 1.49% and there is an inverse relationship between time and total water revenues. The R² value is 0.57, it means that the model can explain 57% of the increase in total water consumption of Iraq. In contrast, 43% of the increase due to factors other than time. The F-value is 44.0678 which is greater than the critical value of 3.14 so it shows that the coefficient is significant secara statistic.
The annual growth rate of the average per capita portion of water revenue share is negative over the years, ultimately a 3.98 figure is reached. The growing demand for water due to population growth has resulted in their shortages. With an R² value of 0.90%, it implies that the model can account for 90% of the dependent variable variance while 10% of the variance is due to other factors than time. The F-test yielded a value of 3.18, all of which are significant. This shows that the model will be useful and that time significantly affects changes in the variables.
Agri-output grew at a CAGR of 1.53% over 2014-19. The positive sign of the overall trend equation indicates that agricultural output is declining mainly due to inadequate arable land and reduced supply of water.The R² value of 0.024% indicates that the model explains 2.4% of the variability of the dependent variable. Apart from time, water, agricultural technology, etc also influence agricultural production, as already discussed above.
Annual average growth rate of investment spending on agriculture is 14.92% which is more than the other variables but it is average. The positive sign of overall trend equation indicates an average annual growth rate in investment spending agricultural of 14.92%. The Iraqi government has promoted agriculture so much that it is a leading country in exports. The R² value of 0.79% shows that 79% of variance in the dependent variable is explained by the model, while the remaining 21% can be attributed to other factors than time.
The number of people employed in agriculture increased by 1.81 percent as well as the positive sign or the overall trend indicates that the number of people employed in agriculture is increasing by 1.81% every year. The goodness of fit R² value indicates that the model contributes 48 percent of the variance to the dependent variable. A whopping 62 percent of the variance can be attributed to other factors, specifically time. The national income went up by 24.02 percent, which is higher than any other of the above variables. A positive sign of the overall trend equation reflecting diversification of the economy is the reliance of the Iraqi economy on agriculture and oil, in addition to other industries. The value of R² is 0.70%. This means that 70% of the variation regarding the dependent variable is attributed to the model, and the remaining 30% is contributed by other variables but time.
Ultimately, agriculture production accounted for 5.49% annual GDP The negative sign of the total trend equation indicates that this contribution has decreased by 5.49% over time. Due to water resource policies of neighbouring countries, as well as reduced rainfall and higher temperatures, this is happening. As a result of this, cultivation became less frequent and yield also decreased. Consequently, the economic focus of agriculture shifted towards other industries and services, with the contribution of agriculture decreasing to GDP. The R² value was 0.76%, which suggests that around 76% of the overall rise in agricultural output was attributed to GDP, while the other 24% were unrelated to time.
Third axis: This is a model that estimates the contribution of agricultural production to gdp from 1990 till date, by the extended regression distribution (ardl)
This method of testing measures how far the variables are interlinked in the long run. The result of this test would be successful if the variable is 5% significance level unstable at I(0) level, however, after first differentiation they will need to show the same degree of integration, i.e., they will need to be first order stable, i.e., I(1). On the other hand, while some variables may have a consistent first difference, others may have an inconsistent first difference .
Table 2: The equations for growth rate of production factors and water resources, as well as the GDP share of agricultural production, take place from 1990 to 2023.
|
Variable |
Test F |
Test R2 |
The equation |
|
Total water imports (billion cubic metres) |
44.0678 |
٠.٥٧ |
Lnx1= 4.275302 - 0.015010T (*** 94.246 ) ***( 6.638-) |
|
Per capita share of (water resources cubic metres per year) |
318.964 |
0.90 |
Lnx2 = ٨.٢٨٤٧٦٦ - 0.040560 T ١٨١.٨٢٩ ) **( ١٧.٨٥٦- ) )** |
|
Agricultural production (million dunums) |
0.8164 |
0.024 |
Lnx٣ = 14.87220 + 0.015425T (43.42480) ( ٠.٩٠٣٥) *** |
|
Agricultural investment (million dinars) |
125.8639 |
٠.٧٩ |
Lnx4= 5.288709 + 0.139205 T (١١.٢١٨) ***( ٢١.٢٤٥) )*** |
|
Agricultural employment (million workers) |
30.297 |
٠.٤٨ |
Lnx5=13.89837+0.017949 T (٥.٥٠٤٣٣٠) ***(٢٢١.٤٤٨٥)*** |
|
National income (million dinars) |
77.74710 |
0.70 |
Lnx6=13.50649 + 0.215269 T (٨.٨١٧٤٣١) ***(٢٧.٥٧٥٢٦) *** |
|
Contribution of agricultural output to gross domestic product % |
102.1637 |
٠.٧٦ |
Lny =2.660002 - 0.056430T (-10.10761)*** ***(23.74874) |
*** indicates significance at the 0.1% level, ** indicates significance at the 1% level, * indicates significance at the 5% level, and n.s. is substantial at 0.1 percent level. Means that the thing is insignificant. The author has taken this information from different data sources. (1) The Republic of Iraq Ministry of Water Resources National Water Resources Management Center has unpublished data which is available on the web and develops trends for managing water resources. (2) The Agricultural Statistics Bureau at Iraq’s Ministry of Agriculture in cooperation with Iraqi Ministry of Education has statistics for the years 1990-2023. (3) The Republic of Iraq, Ministry of Planning and Development Cooperation, and the Central Statistics and Information Technology Bureau, National Accounts Division, 1990-2992 data collection period. (4) The formula used to determine the annual growth rates is: G = (eB -1) *100. G is the annual growth rate. B is the time factor (T) in each equation.
Due to their ability to pinpoint short-lived and long-lasting consequences, ARDL models are especially useful when it comes to determining short time series. This approach helps determine the relationship between dependent and independent variables including the short-term and long-term effects all of these effects are included in a single equation. Moreover, the variable may influence the dependent variable that depends on. Using this method, we will be able to estimate the parameters associated with the short- and long-term variables as well as the distance of the variables from equilibrium. It is regarded as a contemporary version of the Error Correction Model. The BOUNDS test procedure consists of two parts. The initial step involves determining the existence of long-term consistency between the various parameter values. If they are present, then in the second step, estimate the long-run equilibrium parameters and the short-run parameters of the error correction model . The logarithmic form of the function is assumed to be like this.
LnY= P(LnX1,LnX2, LnX3,LnX4,LnX5,LnX6) …(1)
Where; LnY= The participation of agriculture in the GDP. LnX1= total water revenue from the Tigris and Euphrates rivers (billion m3). LnX2= average per capita share of water revenue (billion m3). LnX3 = value of agricultural output (million dinars). LnX4 = agricultural investment (million dinars). LnX5= agricultural employment (million workers). LnX6= national income (million dinar).
Substituting from section 4.1 into both the ECM and the ARDL-ESM gives us the following Equation:
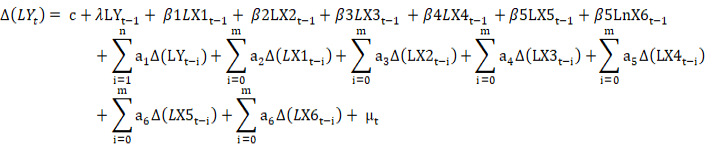
Where; ∆= represents the first difference. C= Represents the constant term. n, m =Represents the upper limits of the time lags for the independent variables and the dependent variable. B= Long-term model parameters. a= Short-term parameters. i= Time. μ_t = Random term.
The F-test is calculated according to the Bound Test method, where the null hypothesis (H0: b=0) is tested, indicating the absence of a long-term equilibrium relationship between the model variables, meaning there is no cointegration, against the alternative hypothesis (H1: b≠0), which indicates the presence of a long-term equilibrium relationship, i.e., the existence of cointegration among the levels of the model variables, and by comparing the (F) estimated with the tabulated values proposed by him, rather than the usual F value, as it consists of two tabulated values representing the minimum value in the case of zero-order integration I(0) and the maximum value in the case of first-order integration of the model variables I(1). If the calculated value of (F) is greater than the minimum critical value, we reject the null hypothesis, which means that there is no long-term equilibrium relationship, and we accept the alternative hypothesis due to the existence of joint integration between the research variables. If the calculated value of (F) is less than the minimum critical value, the alternative hypothesis of no long-term equilibrium relationship will be accepted. while if the value of (F) falls between the upper and lower limits, the results will be indefinite, indicating an inability to decide whether there is common integration between the variables or not .
Step 1: Testing the unit root of variable data
It is crucial to test the consistency of time series data before analysing the relationship between the model and economic variables. It enhances the stability of these variables and specifies the order of integration for each variable. It is necessary to conduct unit root tests to assess the stability of the time series of the model. In spite of several unit root test methods, the Phillips-Peron test has been used in this paper as it uses nonparametric statistics to correct the extended Dickie-Fuller stat and permits heteroscedasticity errors . Figure 1 shows the result of Phillips-Peron test to the model variables.
The results of Phillips-Peron experiment (1988) for the variables included in the model are presented in Figure 1 total water revenue, agricultural output, and national income, are invariant at their level. However, other elements, such as the share of agricultural output in the GDP, average per capita unit water consumption, investment in agriculture, and labor force, unstable at the level and becomes stable after the first differevce.
Step 2: Testing the cointegration limits
Figure presents the statistical results of the f-test and Ardl model boundary tests. The calculated f-value was found to be 8.676713 which is higher than the tabulated value at the 1% level. This indicates that the null hypothesis (no cointegration between the model variables) is rejected, rather, the alternative hypothesis (the model variables are cointegration) is accepted.
Step 3: ARDL model estimation results
Several attempts were made to obtain the best estimation results in terms of compliance with standards and freedom from all standard problems. The results mentioned in Figure 3 were the best results obtained, including the application of the ARDL model using Eviews 12 software. The model estimation results appeared with time lags (2, 2, 3, 2, 1, 3, 3) based on the AIC criterion values. These are among the best results obtained because they give lower values according to this criterion and are determined automatically using Eviews 12 software. The value (2) means a lag of two periods for the variables (the contribution of agricultural output to gross domestic product, total water revenues of the Tigris and Euphrates rivers, and the value of agricultural output), and the value (3) means a lag of three periods, as in the variables (average per capita share of water revenues, agricultural employment, national income), and the value (1) means a time lag of one period, as in the agricultural investment variable.
Step 4: The method of ARDL error correction model
The data in Figure 4 illustrates that the short-term parameters are mostly consistent with the long-term results with respect to significance and sign. The coefficient of error correction has a value of -1.109420 which is negative at the 1% level. Therefore, there is a longer-run association between the independent and dependent variables, which means that cointegration exists between the variables in the short-run. The negative and significant coefficient of error correction signifies how quickly the variable “Agricultural output as % of GDP” returns to its long-run value due to previous period in each year of deviation. The estimated value would be -1.109420 As a result, errors that are minor in nature can be ‘corrected’ in less than a year.
According to the figure, the elasticity (lny) of the dependent variable, which is the agricultural output as a percentage of GDP, is 0.649778, a positive and 1% level of significance. That means, the previous period contribution of agricultural output to GDP had a positive effect of (64%) on the current period contribution of agricultural output. Correspondingly, the economic theory lies on the general annual growth rate for the whole during the investigation period. The total water revenue of Iraq (ln x1) as an independent variable has a short-run elasticity of -4.002698, which is negative at the 1% level of significance. This implies that a bigger water revenue amount comes from a smaller percentage of agriculture output contributing to GDP and vice-versa. This economic argument does not make sense; a rise in water revenue (1 per cent) causes a fall of 4.002698 per cent in agricultural output contribution to GDP. This may be attributed to poor water resource management, which led to an unfair distribution of water, in addition to the financial administration’s personal pricing policies on farmers, enabling them to use traditional methods of farming and irrigation, resulting in moisture leakage and salinity, and consequently affecting the fertility of agricultural lands, production, and value.
The independent variable, the per capita average volume of water consumed taken (ln x 2), is in the short term 3.916564, and is significant at the 1%. This means that the average amount of water consumed per capita is causing more than half the percentage of agricultural production that is the GDP. According to economic logic, Iraq uses the most agricultural water, primarily due to the inefficiency of traditional irrigation. This creates an obligation on the part of the state. Only 30%-40% of the water used is actually effective due to limited irrigated areas. The neighbouring nations’ water resources policies are increasingly leading to the decline in water revenue which adversely impacts agricultural production as well as its contribution to the economy.
The short-term independent variable value of agricultural production (ln x 3) is around 0.160406 which is also significant at 1%. The positive coefficient indicates a direct relationship between the value of agricultural production and its contribution to GDP, which is in line with economic theory, that is, as the value of agricultural production increases its contribution to GDP will increase in a similar proportion.
The independent variable (investments in agriculture)(ln x 4) is negative with a short-term value of (-1.88897). It is significant at the 1% level. The negative sign indicates an inverse relationship between the investment in agriculture and the percentage of agricultural production to GDP. This finding runs counter to common sense. As enhancement in investment for agriculture takes place, the contribution of Iraqi agriculture to GDP is getting reduced actually. The oil industry dominance could be the main cause for this. While spending on agriculture is rising, overall growth in the oil industry contributes over 40 per cent of GDP, which is greater than that of the increase in spending on agriculture. Consequently, agriculture’s share in total output declines. This may be due to directing many investments towards infrastructure projects, which do not directly reflect on the added value of the agricultural sector, in addition to the low efficiency of agricultural investments in the short term, as well as the dominance of the oil sector in Iraq. The rapid growth of the oil sector contributes to more than 40% of GDP, thereby reducing the proportion of agriculture in the total output. Furthermore, these investments have not achieved optimal independence, and due to their long-term nature, their effects have not appeared in the short term.
The findings also show that the independent variable (agricultural labor) (ln x 5) has a value in the short term of 0.342004, significant at the 1% level. The positive correlation indicates a direct link between the agricultural workforce and the agriculture sector’s GDP contribution. A 1% rise in the number of agricultural workers results in a 0.342004% rise in GDP. This is consistent with economic theory. The last independent variable (national income) (ln x 6) is 0.213070 whose sign is positive and its significant at 1%. This implies that as average national income rises, there is a corresponding increase in the percentage of agriculture’s contribution to GDP, which is consistent with economic theory for complex economies. Over time, elevating the people’s level of income on a national level means increasing their expenditure on the agricultural sector. This is reflected during the modernisation of technology, expansion of infrastructure, and so on. Consequently, this enhances agricultural productivity and thus raises GDP in the country.
Step 5: The ARDL model is employed to estimate and discuss the long-term consequences of Iraq’s model variables
As shown in Figure 5, the long-term effects of total water resources revenue, per capita water consumptions, agricultural output, agricultural investment, agricultural life, national income on agriculture contribution to GDP. The signs of the independent variables are contradictory.
EC = LNY-(-0.887300 * LNX1 + 1.0280 * LNX2 + 0.1937 * LNX3- 0.0743 * LNX4 + 0.2325 * LNX5 - 0.0647 * LNX6 - 7.1684)
The above equation shows that there is no joint integration between (total water revenues and agricultural investments, agricultural labour force, and national income) and the contribution of agricultural output to GDP in the long term, because the value of the parameter (Lnx1), (Lnx4), (Lnx5), and (Lnx6) appeared insignificant, reaching (0.3078), (0.3468), (0.2357), and (0.1418), respectively This may be attributed to the unstable political conditions the country experienced during the study period . The coefficients of the variables (Lnx2) and (Lnx3) were both positive and significant at the 5% level with values (0.0188) and and (0.0072), respectively. A positive sign indicates the long-term positive relationship between (average per capita water share, agricultural production value) and contribution to contribution of agricultural output to gross domestic product.This underscores the crucial role of water resources in the performance of the agricultural sector in the Iraqi economy in the long term.
Step 6: Post-estimation testing of the model
First: Residuals autocorrelation testing and heterogeneity testing. As shown in Figures 6 and 7, the model has passed all the standard tests with no autocorrelation through the LM test with a probability value of about 0.3793 for two lags and the problem of heteroscedasticity has been tested through the Pagan-Godfrey test-Breusch test with a probability value of (0.7738). Hence, we can accept the null hypothesis, which states that the model does not suffer from autocorrelation or heteroscedasticity.
Second: Assessing the normality of random errors’ distribution
Figure 8 shows that the condition of normal distribution of residuals is met using Jarque-Bera (jb) with a probability value of (0.4868), which is greater than the 5% probability level ,This is a good indicator of the quality of the estimated model. Therefore, the null hypothesis that the residuals have a normal distribution is accepted.
Third: Assessing the structural stability of model coefficients
This is accomplished through the cumulative sum of residuals (CUSUM) test or the cumulative sum of squares of residuals (CUSUMSQ) test created by Brown et al. (1975), especially the CUSUM test. The CUSUM test is one of the most popular tests and one of the approved tests for testing the stability and the consistency of the model using critical red lines that show structural stability or instability. The blue line shows the cumulative sum of the residuals where the cumulative sum of the residuals whether within the critical limits at and at significance level of 5% whether fluctuating around zero this means that the model is structurally stable and stable throughout the research perio If the cumulative sum of the residuals is outside the critical limits, it indicates that the model does not suffer from structural stability and is unstable for the entire study period. Figure 9 depicts the cumulative sum of residuals (CUSUM), which assesses the stability of both the long-term and short-term parameters of the ARDL model. The shapes of the CUSUM statistic fall within critical limits at the 5% level of significance and vary around zero. This finding suggests that the model is stable during the study period and adequately represents the relationships. In addition, the data are suitable for the logarithm form.
Conclusion
- The study confirmed its hypothesis of the existence of a long-term equilibrium (cointegration) relationship between the variables, indicating that the variables tend to stabilize in the long run.
- The average per capita share of water recorded a significant decline as total water revenues declined significantly during the study period. The lack of water security in the country has serious consequences, making it necessary to take a serious look at the water resource management policy.
- In Iraq, there is poor water resource management, poor consideration of climate change forecasts, and low water revenues affecting water security that has impacted agricultural production and contribution to the gross domestic product.
- The coverage in the results refer that approximately 90% of variation in the dependent variable (contribution of agriculture in GDP) is explained by the regression model.
- The results obtained indicate that the share of the agricultural sector in GDP is affected by structural constraints related to water scarcity and the level of agricultural production more than it is affected by constraints represented by traditional inputs such as agricultural labor and agricultural investments.
- The reason for the absence of a long-term equilibrium relationship for agricultural investments is due to the weak cumulative effect of investment spending on the share of agricultural output in GDP, along with deviations in the efficiency of resource allocation.
Recommendations
- Review water policies in Iraq periodically in line with international and regional changes in order to ensure water security and reduce fluctuations in the average per capita share of water, which indicates weak water sustainability in the country.
- Adopt a comprehensive national strategy for water resource management that takes into account changes in water revenues and climate challenges, with a focus on techniques for rationalising water use and increasing its efficiency, given that water is a key factor in supporting various economic activities, particularly agriculture.
- Improve management and efficiency of agricultural sector through modern agricultural technology by adding scientific methods and planning on the basis of climate data and available resources so that crop output will rise and agriculture’s contribution to gross domestic product will increase.
- Investing in modern water and agricultural infrastructure, such as smart irrigation systems, rehabilitating dams and lining canals to improve water use, reducing losses and addressing waste resulting from traditional farming methods.
- Redirect agricultural investments according to a strategic plan that ensures tangible returns while reducing the oil sector’s dominance over GDP, thereby contributing to the activation of agriculture as a productive economic sector capable of creating job opportunities and achieving food security.
- Establish an early warning system for climate and water changes that supports decision-makers in adopting proactive policies and helps mitigate the effects of water crises that directly affect agricultural production and food security
- Awareness should be created within the communities about the importance of conserving water resources and rationalizing its use through media and educational programs directed at farmers and citizens for spreading sustainable water usage culture.
Novelty Statement
This study provides a novel econometric analysis of the cumulative impact of water scarcity combined with productive resources on the contribution of the
agricultural sector to Iraq’s GDP, using time-series data from 1990 to 2023. Unlike previous studies, it focuses on the cumulative and interactive effects rather than isolated factors.
Author’s Contribution
Doaa Qasim Sabri Ali Al-Younis: Conceptualization, research design, data collection and analysis, econometric modeling, writing – original draft, manuscript preparation, and overall supervision
Mhasin Mahmood Sultan: Methodology development, data interpretation, critical revision of the manuscript, and final approval.
Qahtan Althyab: Literature review, data validation, and assistance in econometric analysis.
Assad Ibrahim Alhayali: Data collection, resources provision, and manuscript formatting.
Mohammed Ahmed Mahal: Statistical analysis support, proofreading, and technical editing.
Generative AI and AI assisted technology statement
The authors declare that no generative AI and AI assisted technology was used in the creation of this manuscript.
Conflict of interest
The authors have declared no conflict of interest.
Figures
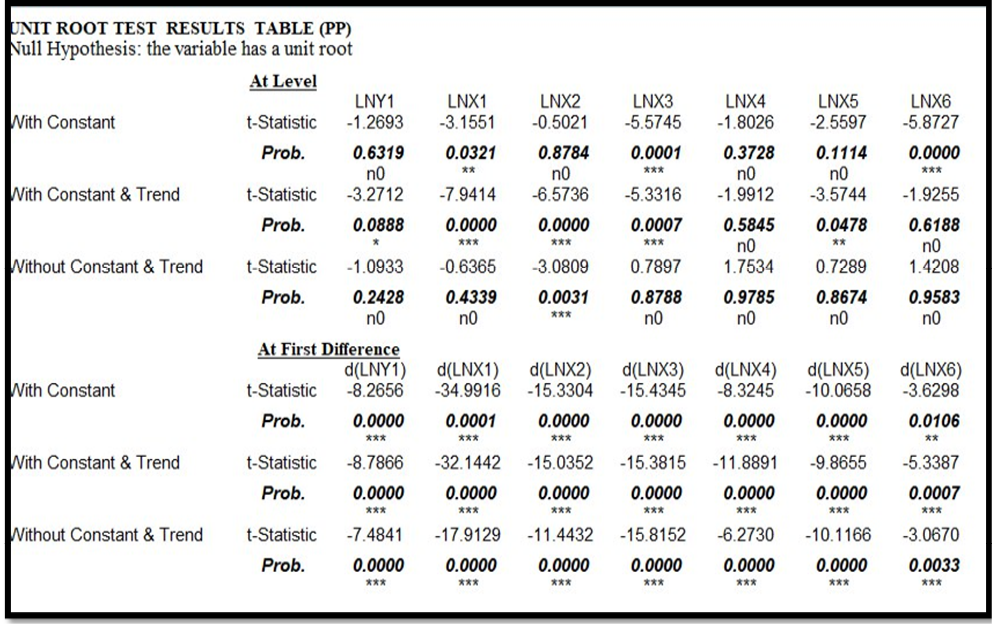
Unit root test results for model variables in Iraq using (p.p) Phillips–Perron. *Significant at 10% level, **Significant at 5% level, ***Significant at 1% level, n.s. not significant. Source: The researchers prepared it based on the result of Eviews 12.
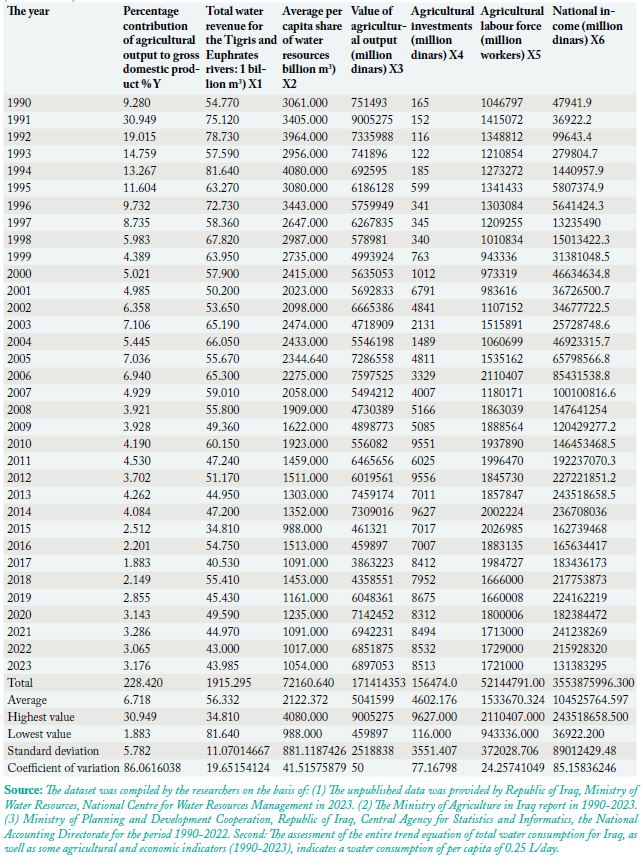
Indicators of agriculture such as the number of farms and their size are significant to the Iraqi economy. (1990-2023).
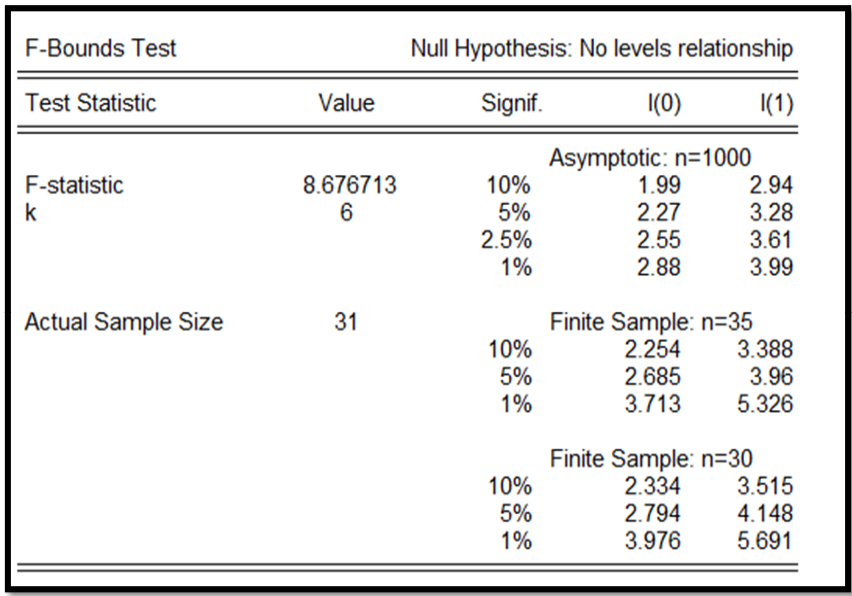
Iraq model joint integral boundary value test results. Source: Created by researchers based on the results of the Eviews 12 program.
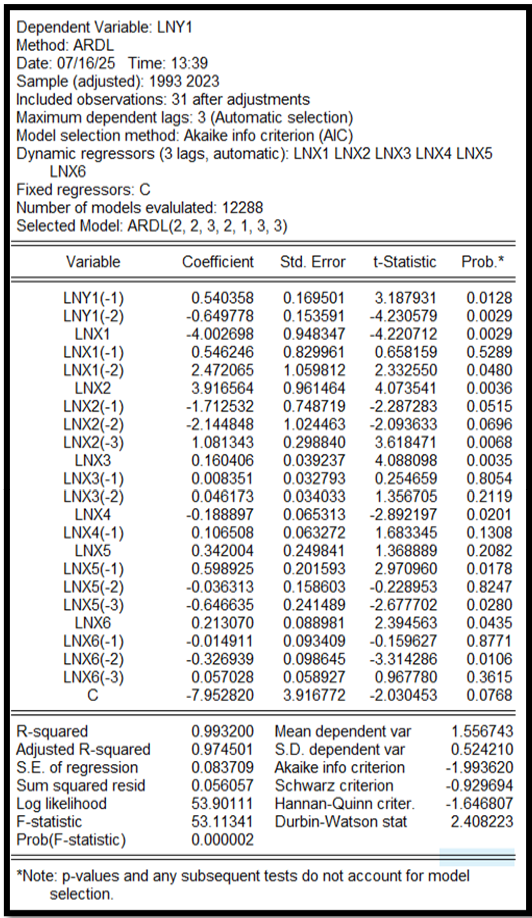
Results of the ARDL model. Source: Created by researchers based on the results of the Eviews 12 program.
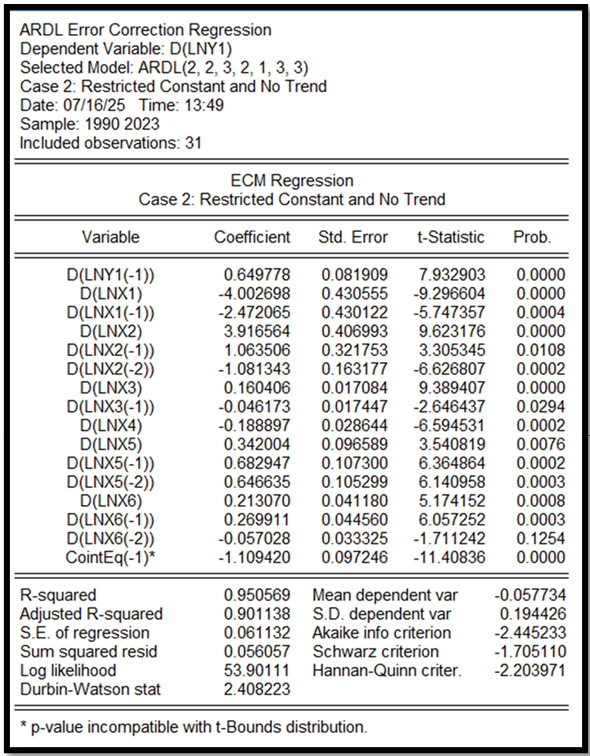
The results of the ARDL model and its error correction (ECM) application in Iraq. Source: Created by researchers based on the results of the Eviews 12 program.
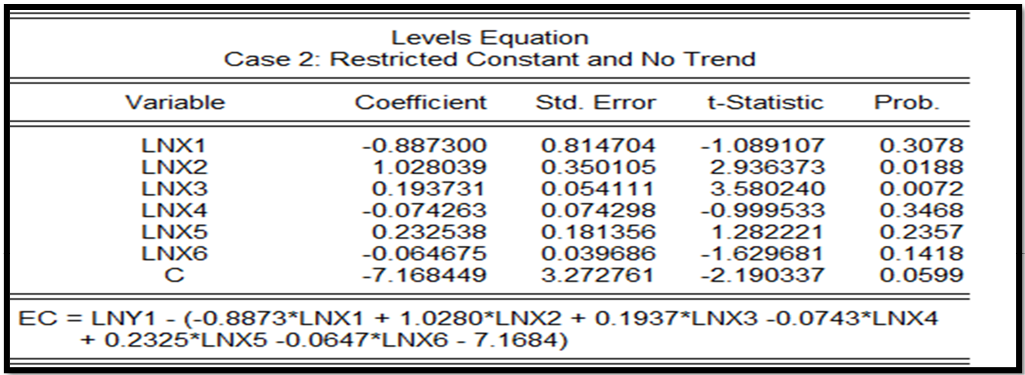
Results of estimating the long-run relationship between agricultural output and gross domestic product. Source: Created by researchers based on the results of the Eviews 12 program.
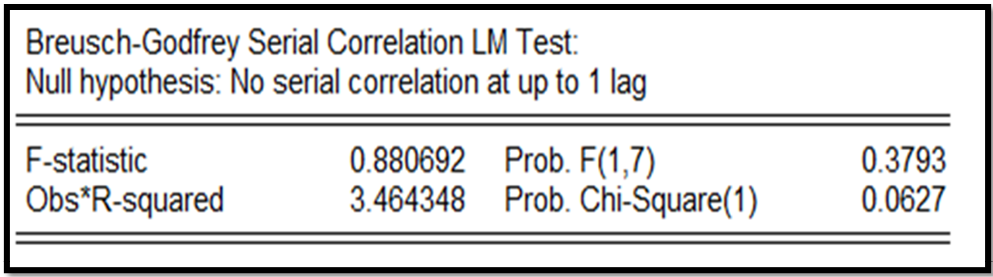
The model registered an autocorrelation test of the residuals in Iraq. Source: Researchers created based on Eviews12 program output.
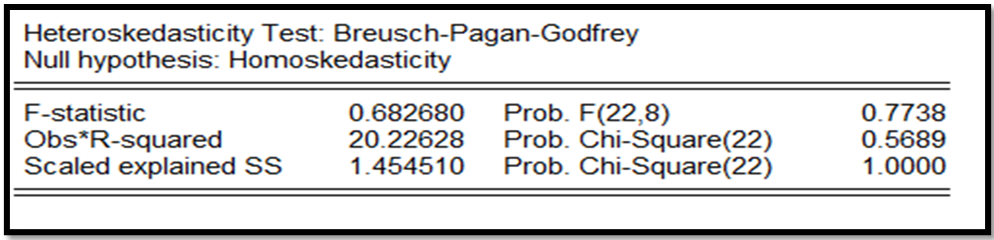
The issue of heterogeneity of variance for the model in Iraq testing. Source: Researchers created based on Eviews12 program output.
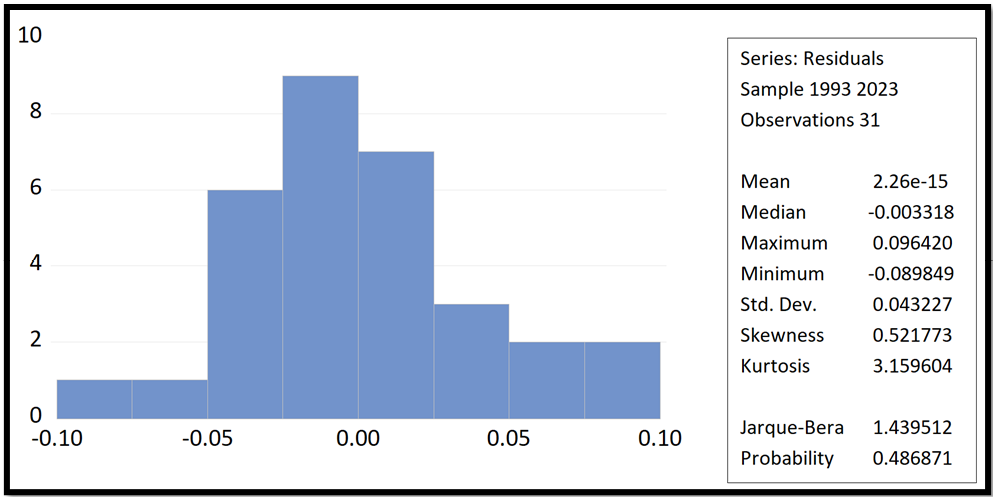
Normal distribution of the contribution of agricultural output to gross domestic product. Source: Created by experts using the results of the Eviews12 program.
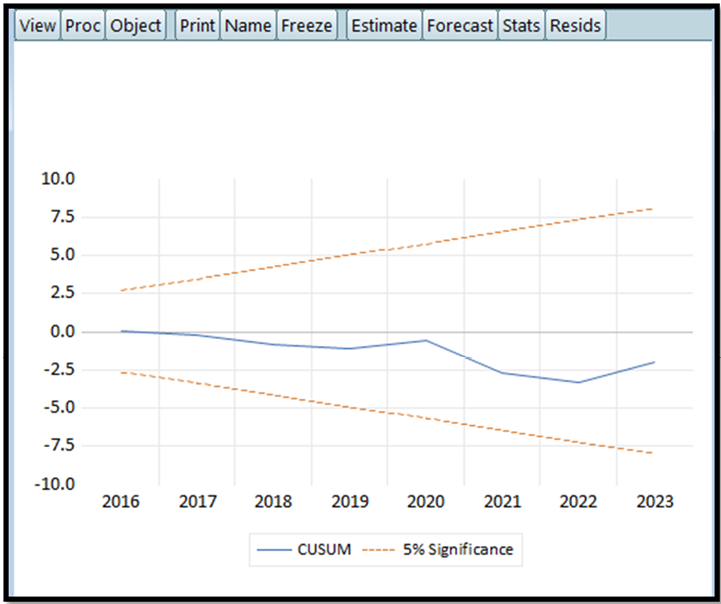
The Cumulative Sum of Residuals for agricultural output relative to GDP contribution model. Source: Researchers prepared this using the output from the Eviews12 program.
References
- AbuTurab, T.Q.M., 2021. The water crisis in Iraq and its economic dimensions: A special reference to Basra. Modern Econ. Sustain. Dev., 4(2): 111–134. Retrieved from https://www.asjp.cerist.dz/en/downArticle/602/4/2/170662
- Al-Ansari, A.A.A., 2017. Water resource management in Iraq: Challenges and solutions. Dar Adnan Publishing House, Baghdad.
- Ali, E.H., Bulqader, M.A. and Baker, Y.T., 2024. Measuring the impact of water scarcity on agricultural economic development in Iraq. Stallion J. Multidiscip. Assoc. Res. Stud., 3(3): 1–16. https://doi.org/10.55544/sjmars.3.3.1[CrossRef]
- Al-Taie, K.I., 2015. Econometrics: Theoretical foundations and applications. Dar Safa Publishing House, Amman.
- Al-Younis, D.Q.S. and Ahmed, J.S., 2025. An economic study of the impact of Turkish water policy on investment spending on agricultural projects in Iraq for the period (1990–2022). IOP Conf. Ser. Earth Environ. Sci., 1487(1): 012222. https://doi.org/10.1088/1755-1315/1487/1/012222[CrossRef]
- Brown, R.L., Durbin, J. and Evans, J.M., 1975. Techniques for testing the constancy of regression relationships over time. J. Royal Stat.Soc. Series B (Methodological), 37(2): 149-163.
- Encyclopaedia Britannica. (n.d.). Iraq– Farming, crops, livestock. In Britannica. Retrieved from https://www.britannica.com/place/Iraq/Agriculture-forestry-and-fishing
- Food and Agriculture Organisation, 2022. FAOSTAT database. Food and Agriculture Organisation of the United Nations. https://openknowledge.fao.org/server/api/core/bitstreams/0c372c04-8b29-4093-bba6-8674b1d237c7/content
- Food and Agriculture Organization, 2005. Iraq: Agriculture sector note. FAO. Retrieved from https://www.fao.org/4/i2877e/i2877e.pdf
- Gujarati, D.N. and Porter, D.C., 2009. Basic Econometrics. Fifth edition, McGraw Hill, New York. https://ucanapplym.s3.ap-south-1.amazonaws.com/RGU/notifications/E_learning/0nline_study/Basic-Econometrics-5th-Ed-Gujarati-and-P.pdf
- Hashim, R.K. and Kamal, M.A., 2023. Evaluation of water resources impact on agricultural economic development in Egypt. Water Management Research Institute, National Water Research Center, Egypt, 19(1). Retrieved from https://www.sagepublisher.com/volume/JASAE/19/01/evaluation-of-water-resources-impact-on-agricultural-economic-development-in-egypt-63d79bd8e25be.pdf
- Ibrahim, A.K., Hussain, W.S. and Antar, S.H., 2024. Biological activity of phenolic compounds released from barley and safflower within three growth stages (seedlings, elongation, and flowering) on barley and safflower crops growth. Mesopot. J. Agric., 52(4). https://iasj.rdd.edu.iq/journals/uploads/2025/01/03/8455a3631560d14cd990bd2e3efa4e35.pdf
- Manshad, A.A.Z., 2004. Time series analysis: Theory and application. Dar Al-Kotob Publishing House, Baghdad.
- Pesaran, M.H., Shin, Y. and Smith, R.J., 2001. Bounds testing approaches to the analysis of level relationships. J. Appl. Econ., 16(3): 289–326. https://doi.org/10.1002/jae.616[CrossRef]
- Phillips, B.C.B. and Perron, B., 1988. Testing the unit root in time series regression. Biometrika, 75(2): 335-346. https://doi.org/10.1093/biomet/75.2.335[CrossRef]
- Republic of Iraq, Ministry of Agriculture, 1990–2023. Agricultural Statistics Bulletins. Agricultural Statistics Department.
- Republic of Iraq, Ministry of Planning and Development Cooperation, Central Organisation for Statistics, Directorate of National Accounts. (1990–2022). National Accounts Reports. https://www.cosit.gov.iq/ar/national-accounts?utm_source=chatgpt.com
- Republic of Iraq, Ministry of Planning. (various years). Annual Statistical Bulletin. https://cosit.gov.iq/ar/1490-2023-24?utm_source=chatgpt.com
- Republic of Iraq, Ministry of Water Resources, National Centre for Water Resources Management. (Various years). Unpublished data.
- United Nations, 2023. Water and Sustainable Development Report. United Nations Publications.https://digitallibrary.un.org/record/4007797/files/Water2023.pdf
- World Bank, 2023. World Development Indicators. World Bank, Washington, D.C.https://databank.worldbank.org
- World Bank, 2024. Agriculture, forestry, and fishing, value added (% of GDP)–Iraq. World Development Indicators. https://data.worldbank.org/indicator/NV.AGR.TOTL.ZS?locations=IQ
Services
Article usage statistics
Loading…