Research Article · Volume 14, Issue 10, 3 September 2026 · Open Access
Driving Competitiveness in Local Poultry Agribusiness: Evidence on Supply Chain Efficiency and Marketing Strategies from Banten Province, Indonesia
· · ·
Affiliations & Notes ⌄
1Student in the Department of Agricultural Science, Faculty of Agriculture, Sultan Ageng Tirtayasa Serang University, Banten, Indonesia
2Department of Agricultural Science, Faculty of Agriculture, Sultan Ageng Tirtayasa Serang University, Banten, Indonesia *Correspondence | Dewi Haryani, Student in the Department of Agricultural Science, Faculty of Agriculture, Sultan Ageng Tirtayasa Serang University, Banten, Indonesia
The results of this study indicate that Supply Chain Management and Marketing Mix have a positive and significant effect on Competitiveness, while Customer Orientation does not have a significant effect.
This indicates that understanding customer needs can improve marketing performance, while operational and marketing capabilities do not directly result in improved performance.
Competitiveness was shown to have a positive and significant effect on Marketing Performance, indicating that the higher a business's competitiveness, the better its marketing performance.
Selected from the article's own text.
Abstract
Local poultry agribusiness in Indonesia faces persistent challenges associated with supply chain inefficiencies, limited bargaining power among small-scale producers, inadequate coordination among market participants, and underdeveloped logistics infrastructure. These conditions weaken competitiveness and constrained marketing performance within the sector. This study aims to (1) examine the effects of supply chain management, marketing mix, and customer orientation on competitiveness, (2) assess the effects of these variables on marketing performance, (3) evaluate the influence of competitiveness on marketing performance, and (4) investigate the mediating role of competitiveness in the relationship between managerial capabilities and marketing performance in KUB chicken agribusiness. Data were collected from 250 agribusiness actors in Banten Province, Indonesia, consisting of 150 poultry farmers, 60 traders, and 40 food industry entrepreneurs. A quantitative survey was conducted involving 250 KUB chicken agribusiness actors in Banten Province, Indonesia, and the data were analyzed to examine both direct and indirect relationships among the study variables. The relationships among variables were analyzed using Covariance-Based Structural Equation Modeling (CB-SEM). The results show that supply chain management and marketing mix significantly improve competitiveness, whereas customer orientation has a significant direct effect on marketing performance but does not significantly influence competitiveness. Competitiveness significantly enhances marketing performance and serves as a mediating mechanism linking supply chain management and the marketing mix to it. These findings underscore the importance of improving supply chain efficiency, strengthening market oriented strategies, and enhancing competitiveness to achieve sustainable growth and superior marketing performance in local poultry agribusiness.
Local poultry agribusiness constitutes asn important component of Indonesia’s agricultural economy due to its contribution to food security, rural employment, and the provision of affordable animal protein for households Despite its economic significance, the sector remains dominated by smallholder production systems that face persistent challenges, including low production efficiency, inadequate biosecurity practices, fluctuating feed prices, limited access to market information, and vulnerability to disease outbreaks . These constraints are further intensified by fragmented supply chain structures and weak coordination among market actors, resulting in limited bargaining power, restricted market access, and difficulties in competing with large vertically integrated poultry companies . To address these challenges, the Agency for Agricultural Research and Development (Balitbangtan) developed Kampung Unggul Balitbangtan (KUB) chicken as an improved local chicken breed with superior genetic characteristics, encompassing improved egg production, faster growth rates, better feed efficiency, and better adaptability to local environmental conditions compared with traditional indigenous chickens These advantages make KUB chicken a promising alternative for increasing smallholder productivity and farm income while meeting the increasing consumer demand for native chicken products. Nevertheless, despite its superior production characteristics, the commercialization of KUB chicken remains limited by fragmented supply chain coordination, inefficient distribution systems, inadequate market oriented production planning, weak promotional efforts, and insufficient understanding of evolving consumer preferences ; . These constraints hinder producers from converting production advantages into sustainable competitive advantage and superior marketing performance ; . Accordingly, improving supply chain integration, strengthening market orientation, and aligning the production system with customer needs are crucial to increasing the competitiveness and long-term commercialization of KUB chicken agribusiness in Indonesia. .
The expansion of indigenous poultry production is increasingly regarded as a strategic pathway to enhance food security, strengthen rural livelihoods, and advance the sustainable development of the poultry sector within developing countries. In Indonesia, local chicken breeds, including Kampung Unggul Balitbangtan (KUB) poultry, play a significant role in supplying animal protein while providing income opportunities for smallholder farmers . The KUB chicken, developed through selective breeding programs, possesses superior production characteristics compared with traditional indigenous chickens, including improved growth performance, higher egg production, and better adaptability to local environmental conditions. Despite these advantages, the expansion and sustainability of KUB chicken agribusiness remain constrained by challenges related to market entry, supply chain coordination, and competitiveness .
Indonesia’s poultry sector comprises two distinct production systems: the commercial broiler industry, largely dominated by vertically integrated companies, and the local KUB chicken agribusiness, primarily operated by smallholder farmers raising indigenous chicken breeds such as KUB chickens. Unlike the broiler sector, local poultry production relies heavily on small-scale operations, informal marketing channels, and decentralized distribution networks. Consequently, KUB chicken farmers often face challenges related to market access, limited bargaining power, inadequate market information, and weak coordination among value chain actors. These constraints reduce their ability to capture added value and strengthen their competitive position within the local poultry market . Inefficiencies in information exchange, coordination mechanisms, and institutional relationships among actors within the poultry value chain may further increase transaction costs and reduce overall supply chain performance ; .
Effective supply chain management is a fundamental component of livestock agribusiness, as it enables the efficient distribution of poultry products from producers to consumers while safeguarding product quality, enhancing market responsiveness, and supporting economic viability. Strong coordination, information sharing, trust, and collaborative relationships among farmers, traders, processors, and retailers can reduce transaction costs and improve operational efficiency throughout the poultry supply chain. Previous studies have demonstrated that enhanced coordination and contractual arrangements contribute to improved market efficiency, stronger competitiveness, and better agribusiness performance ; .
In addition to supply chain efficiency, understanding consumer preferences and market-oriented strategies has become increasingly important for improving the competitiveness of local poultry products. As consumer demand shifts toward high-quality, safe, and locally sourced poultry products, KUB chicken producers must strengthen their market orientation and adapt their marketing strategies accordingly. Therefore, examining the relationships among supply chain efficiency, customer orientation, competitiveness, and marketing performance is crucial for developing sustainable measures that support the growth and competitiveness of KUB chicken agribusiness. These strategies can contribute not only to the financial viability of smallholder poultry production but also to the broader development of Indonesia’s local poultry sector.
This study integrates the resource-based view (RBV) and market orientation perspectives to explain competitiveness and marketing performance in KUB chicken agribusiness. RBV emphasizes that valuable organizational resources and capabilities provide the internal foundation for achieving competitive advantage. From this perspective, supply chain management and marketing mix capabilities represent organizational capabilities that enable KUB chicken agribusiness actors to coordinate resources, improve operational efficiency, manage market offerings, and strengthen their competitive position. In contrast, the market orientation perspective emphasizes the importance of understanding and responding to market requirements, particularly customer needs. Customer orientation therefore represents the market-facing dimension through which firms align their capabilities with changing customer expectations. Thus, the two perspectives are complementary: RBV explains the internal resource perspective, Market Orientation accounts for external market responsiveness. Both perspectives are needed to understand the drivers of competitiveness in the KUB chicken sector ; .
The Resource-Based View states that resources and competencies that are valuable, uncommon, inimitable, and efficiently organized within the company serve as the foundation for long-term competitive advantages. ; . In poultry agribusiness, these strategic resources include flock management capabilities, product quality assurance, biosecurity practices, supply chain management competencies, and efficient distribution networks. Such capabilities enable poultry enterprises to improve product quality, operational efficiency, and market competitiveness, thereby contributing to superior overall business success . Specifically within KUB chicken agribusiness, efficient supply chain management ensures prompt product distribution, reduces post-production losses, and enhances overall value across the poultry value chain .
The RBV theory is complemented by Market orientation by emphasizing the importance of always identifying and responding to customer needs, market trends, and competitive dynamics. . Increasing consumer awareness regarding poultry meat quality, food safety, traceability, and animal welfare has intensified the need for customer-oriented strategies within the poultry sector . Firms that effectively gather market intelligence and translate customer preferences into product and marketing decisions are more likely to create superior customer value, strengthen customer loyalty, and improve marketing performance .
Market orientation offers a useful lens to examine how customer orientation contributes to competitiveness and marketing performance in local poultry agribusiness. The theory emphasizes that firms can achieve superior performance by continuously identifying customer needs, responding to market changes, and creating superior customer value through market-responsive strategies. In the context of poultry agribusiness, customer orientation enables producers to align production, product quality, pricing, and distribution practices with evolving consumer preferences, thereby improving market responsiveness and competitive positioning. Recent evidence from poultry farms in the Philippines indicates that stronger market orientation, particularly customer responsiveness and market intelligence, enhances competitiveness, distribution efficiency, and long-term business sustainability in poultry enterprises . Similarly, studies in agribusiness sectors have shown that market-oriented firms are more resilient in the face of shifting market dynamics, adept at delivering customer value, and improve business performance through stronger innovation and marketing capabilities . In developing countries, customer orientation has also been associated with higher competitiveness and marketing performance because it encourages firms to understand consumer preferences, strengthen customer relationships, and differentiate their products in increasingly competitive markets . For KUB chicken agribusiness, customer orientation is particularly important because consumer demand for native chicken products is influenced not only by price, product quality, freshness, food safety, and product availability but also by socio-cultural and seasonal factors. In Indonesia, demand for native chicken products frequently increases during religious celebrations, traditional ceremonies, weddings, and other community-based cultural events, where indigenous chicken is often preferred for cultural and culinary reasons ; . Therefore, producers and supply chain actors who effectively understand and respond to both market preferences and socio-cultural consumption patterns are better positioned to strengthen market competitiveness and improve marketing performance.
Supply chain management, the marketing mix, and customer orientation to enhancing competitiveness and business performance, relatively little is known about the specific mechanisms by which these capabilities jointly influence marketing performance through competitiveness in KUB chicken agribusiness in Banten,Indonesia. This gap is particularly evident in smallholder-based production systems, where market inefficiencies, high transaction costs, and weak value-chain integration continue to constrain competitive performance .
Existing studies predominantly focus on operational performance or on direct relationships between managerial practices and business outcomes, while relatively few investigate competitiveness as a mediating construct that links internal capabilities, market responsiveness, and marketing performance within a fragmented agribusiness market structure. This gap is particularly important in developing economies where market imperfections, coordination failures, and high transaction costs often constrain agribusiness development .
By positioning competitiveness as a latent mediating variable, this study extends the existing literature by demonstrating how supply chain management, marketing mix capabilities, and customer orientation jointly contribute to marketing performance by developing competitive advantages. The study argues that competitiveness emerges not only from operational efficiency and effective marketing strategies but also from agribusiness actors’ ability to identify and respond to customer needs and market dynamics. Drawing on evidence from Indonesia’s local poultry industry, the findings provide valuable insights into how supply chain integration, transaction cost reduction, market responsiveness, and value-chain coordination enhance competitiveness and ultimately improve marketing performance. These results contribute to a broader understanding of sustainable agribusiness development by integrating supply chain management, marketing mix, customer orientation, competitiveness, and marketing performance within a single analytical framework, particularly in the local poultry industry and smallholder-based KUB chicken agribusiness systems.
This study integrates the resource-based view (RBV) and market orientation perspectives to explain competitiveness and marketing performance in KUB chicken agribusiness. RBV emphasizes that valuable organizational resources and capabilities provide the internal foundation for achieving competitive advantage. From this perspective, supply chain management and marketing mix capabilities represent organizational capabilities that enable KUB chicken agribusiness actors to coordinate resources, improve operational efficiency, manage market offerings, and strengthen their competitive position. In contrast, the market orientation perspective emphasizes the importance of understanding and responding to market requirements, particularly customer needs. Customer orientation therefore represents the market-facing dimension through which firms align their capabilities with changing customer expectations. Thus, the two perspectives are complementary: RBV explains the internal capacity of KUB chicken agribusiness actors to compete, whereas market orientation explains how these capabilities are aligned with external market needs and translated into market outcomes.
This study aims to: (1) examine how supply chain management, marketing mix, and customer orientation affect the competitiveness of KUB chicken; (2) assess the effect of these three variables on marketing performance; (3) evaluate the consequences of competitiveness on marketing performance; and (4) investigate how competitiveness acts as a mediator between supply chain management and marketing mix concerning marketing performance.
MATERIALS AND METHODS
Research subject
The research subjects consisted of actors involved in the KUB chicken agribusiness supply chain in Banten Province, Indonesia. These actors included KUB chicken farmers, traders, and culinary entrepreneurs who utilize KUB chicken as a primary production input. Farmers represented the production segment of the supply chain; traders performed distribution and marketing functions; and culinary entrepreneurs were downstream business actors who transformed poultry products into value added food products. Collectively, these actors play important roles in determining the competitiveness and marketing performance of the local poultry agribusiness sector.
Research location and data collection
The study was conducted purposively in four regencies of Banten Province: Pandeglang, Serang, Lebak, and Tangerang, which serve as centers for KUB chicken production and distribution. Geographically, Banten Province serves as a buffer zone for Jakarta, Indonesia’s capital city, providing direct access to dynamic urban markets. The dominance of small-scale poultry farming in this region makes it a representative setting for assessing supply chain efficiency, marketing mix execution, and the competitiveness of local poultry agribusiness.
This study employs a value chain actor approach, with all variables measured from the perspective of business actors. The construct of Customer Orientation (OP) is operationalized as players’ perceptions of consumer preferences, such as quality, pricing, and market demand dynamics. The study population includes poultry farmers, sellers, and KUB chicken culinary business players in Banten, with inclusion criteria of at least one year of involvement and a willingness to participate. Although the respondents were heterogeneous, they all operated within the same value chain system . Efforts to minimize potential bias were implemented by varying the categories of respondents and cross-validating respondents’ business characteristics.
Sampling procedure
The study population consisted of 715 actors involved in the KUB chicken agribusiness value chain across four regencies in Banten Province. These actors included KUB chicken farmers, traders, and culinary entrepreneurs. The population distribution was obtained from local agricultural offices, farmer group records, and business registries operating within the study area
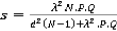
The sample size was calculated using a formula by Isaac and Michael for the population; therefore:
Figure 5.
A post-hoc power analysis indicated that the sample of 250 achieves 0.95 power to detect a medium effect size (f² = 0.15) at α = 0.05, where s is the number of samples; λ^2 is the Chi-Square value at a confidence level of 95% (λ^2 3.841), P = Q is 0.5 (proportion of variance maximum); d is 0.05 (error margin 5%), and N is 715 (population). Sample size was calculated as follows:
Figure 2.
s=250.12 rounded to 250 samples
The adequacy of the sample size was assessed using an a priori power analysis for structural equation modeling. The final structural model consisted of five latent variables and 20 observed indicators. Using A-priori Sample Size Calculator for Structural Equation Models, with an anticipated effect size of 0.30, a significance level of 0.05, and a desired statistical power of 0.80, the minimum recommended sample size was 150 respondents. The calculator also indicated a minimum sample size of 128 based on the structural model requirements. Therefore, the higher value of 150 was used as the minimum sample-size criterion. The study obtained 250 valid responses, which exceeds the recommended minimum by 100 respondents (66.7%). This indicates that the available sample was adequate to detect the hypothesized effects with a statistical power of at least 0.80. This assessment is consistent with who emphasized that SEM sample-size requirements should account for model complexity, minimum detectable effects, significance level, and statistical power rather than relying solely on rules of thumb.
The sample of 250 respondents was proportionally selected from each actor category and regency to ensure adequate representation of the KUB chicken agribusiness value chain across the study area. The size met the minimum requirement of CB-SEM based on Maximum Likelihood ;. Data collected from June to September 2024, in study areas.
Research design and workflow
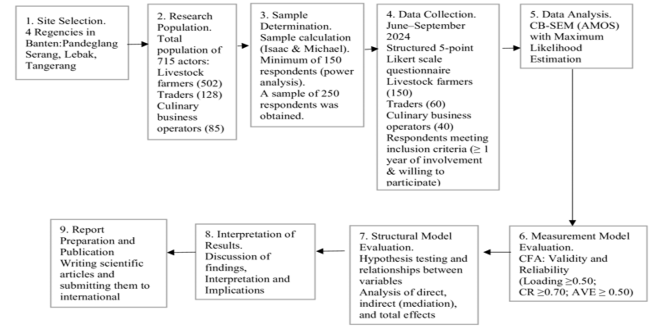
To provide an overview of the research protocol and improve methodological transparency, Figure 1 presents the research design and workflow, including the study location and subjects, population identification, sample allocation, data collection period, measurement model assessment, structural
The research was conducted sequentially from the identification of the study location and value-chain actors to population and sample determination, data collection, measurement model evaluation, structural model testing, mediation analysis, and interpretation of the results. The study employed a cross-sectional survey design and did not involve any experimental intervention or treatment.
Analysis method
This analytical method employs covariance-based structural equation modelling (CB-SEM) to analyse the research objectives using maximum likelihood estimation in AMOS. Because it enables simultaneous estimation of latent constructs and structural correlations while accounting for measurement error, SEM-AMOS was used.; .
The analysis was conducted in two stages: measurement model evaluation and structural model evaluation. First, Confirmatory Factor Analysis (CFA) was performed to assess construct validity and reliability. Composite Reliability (CR), Average Variance Extracted (AVE), and standardized factor loadings were used to evaluate the measurement model. Second, the structural model was estimated to test the hypothesized relationships among supply chain management, marketing mix, customer orientation, competitiveness, and marketing performance.
Measurement model
Model adequacy was assessed using multiple goodness-of-fit indices, including Chi-square/df, GFI, AGFI, CFI, TLI, RMSEA, and SRMR, in accordance with recommended SEM criteria. Assumption tests indicated that the data meet normality requirements (skewness–kurtosis within ±2) and show no multicollinearity (VIF < 3.3). Outliers are identified using z-scores and Mahalanobis distance (p < 0.001) and are evaluated substantively. The composite reliability (CR) and average variance extracted (AVE) had recommended cutoff values of values of CR ≥ 0.70 and AVE ≥ 0.50, respectively. RMSEA < 0.08, CFI, and TLI ≥ 0.90 are used to assess model fit. ; ; .
Instrument development
The study instrument includes five latent constructs: supply chain management (SCM), marketing mix (MM), customer orientation (OP), competitiveness (DS), and marketing performance (KP). All indicators were derived from previously verified studies to ensure measurement accuracy and conceptual appropriateness within the agribusiness literature. The measurement model was developed based on established constructs from previous agribusiness and marketing studies. Each indicator was retained only if it demonstrated statistical adequacy and conceptual relevance to the context of KUB chichen agribusiness.
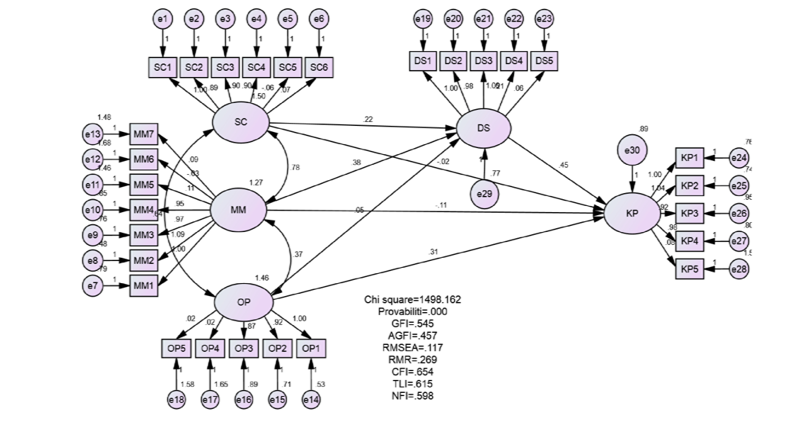
The model depicted in Figure 2 illustrates the relationship between managerial aspects, customer orientation, and marketing performance of KUB chicken in Banten Province. The following is the initial measurement model for SEM in AMOS.
Structural model specification
The structural model in this research is constructed to test the theoretically specified relationship between supply chain management, marketing mix, and customer orientation, as well as its implications for marketing performance of KUB chicken agribusiness. Competitiveness is positioned as a latent mediating variable that bridges the effect of internal capabilities and market factors on marketing performance. The relationships among the variables were analyzed using Structural Equation Modeling (SEM) with a covariance-based approach in AMOS. The structural model positions Supply Chain (SC) Management, Marketing Mix (MM),and Customer Orientation (OP) as exogenous variables, while Competitiveness (DS) serves as a mediating variable, and Marketing Performance (KP) as an endogenous outcome variable. Thus, the structural equation is defined as follows:
Competitiveness (DS):
Figure 3.
Marketing Performance (KP):
Figure 4.
By substituting equation (1) into (2), the KP equation becomes:
Figure 1.
These specifications enable the assessment of both direct and indirect effects, allowing competitiveness to be tested as a mediator between strategic inputs (SC, MM, OP) and marketing performance (KP) outcomes.
Based on the model structure, Supply Chain Management, Marketing Mix, and Customer Orientation are regarded as independent variables, Competitiveness as the mediator, and Marketing Performance as the dependent variable. This is consistent with findings from previous studies on agribusiness and marketing performance in emerging
markets . Marketing Performance (KP) is measured as perceived performance, based on participants’ self-reported assessments. The measurement was conducted using a five-point Likert-scale questionnaire completed by KUB poultry agribusiness players, including farmers, traders, and food industry entrepreneurs actively involved in the value chain in Banten Province.
RESULTS AND DISCUSSION
Descriptive characteristics of respondents
A total of 250 respondents participated in this study, comprising KUB chicken farmers, traders, and culinary entrepreneurs from four regencies in Banten Province. Table 1 presents the socio demographic characteristics of the respondents.
Table 1 shows that based on gender, farmers and traders were predominantly male, accounting for 80.0% and 70.0%, respectively. In contrast, culinary entrepreneurs showed a more balanced gender distribution, with females representing 47.5% of respondents. This pattern indicates differences in gender roles along the KUB chicken supply chain, where primary production and trading activities are still dominated by men, while the downstream sector, particularly the culinary business, provides greater participation space for women.
In terms of age, most farmers (31.3%) and culinary entrepreneurs (40.0%) were aged 40–49 years, while traders were primarily in the 30–39 years age group (31.7%). This indicates that respondents were generally within the productive working-age population. This age range falls within the productive age range, namely 15-65 years. This age is considered optimal because farmers have the experience, physical abilities, and knowledge to effectively manage a livestock business . However, several other studies state that the productive age for chicken farmers is more limited, typically 25-45 years, because in this range, physical strength and adaptation to technology are still very good ; . Meanwhile, farmers over 50 tend to experience physical decline despite their extensive experience ; .
Regarding education level, the majority of farmers had completed senior high school (50.0%), whereas traders and culinary entrepreneurs had relatively higher educational attainment, with 30.0% and 32.5%, respectively, holding a diploma or bachelor’s degree.
For business experience, most farmers (38.7%), traders (35.0%), and culinary entrepreneurs (32.5%) had been engaged in their businesses for 5–10 years, indicating substantial experience in the poultry agribusiness sector.
Table 1 shows that the frequency of KUB chicken purchases by traders and culinary businesses is relatively high. 40.0% of traders make purchases daily, while 47.5% of culinary businesses buy 2–3 times per week. This pattern
Table 1: Characteristics of respondents.
Characteristic
Category
Farmers
Traders
Culinary Entrepreneurs
Freq
(%)
Freq
(%)
Freq
(%)
Gender
Male
120
80.0
42
70
21
52.5
Female
30
20.0
18
30
19
47.5
Age (years)
< 30
14
9.3
8
13.3
6
15.0
30–39
41
27.3
19
31.7
4
10.0
40–49
47
31.3
18
30.0
16
40.0
50–59
32
21.3
12
20.0
10
25.0
≥ 60
16
10.7
3
5.0
4
10.0
Education Level
Elementary School
27
18.0
9
15.0
6
15.0
Junior High School
35
23.3
12
20.0
9
22.5
Senior High School
75
50.0
21
35.0
12
30.0
Diploma/Bachelor
13
8.7
18
30.0
13
32.5
Business Experience (years)
< 5
26
17.3
11
18.3
9
22.5
5–10
58
38.7
21
35.0
13
32.5
11–15
45
30.0
12
20.0
6
15.0
> 15
21
14.0
16
26.7
12
30.0
Purchase Frequency
Daily
24
40.0
14
35.0
(traders and culinary entrepreneurs)
2–3 times per week
23
38.3
19
47.5
Weekly
9
15.0
6
15.0
Less than once per week
4
6.7
1
2.5
indicates that demand for KUB chicken is relatively stable and represents derived demand, that is, demand influenced by the needs of end consumers. Traders purchase daily to maintain stock availability and product freshness, while culinary businesses adjust purchasing frequency to production capacity, storage, and operational needs. This is in line with research by , which found that in the chicken meat supply chain, business customers such as restaurants and retailers prioritize product freshness, delivery flexibility, and supply continuity over price alone. Therefore, purchasing daily or several times a week is a strategy to maintain product quality while increasing customer satisfaction. However, the results of this study differ from those of in Turkey, which found that most households purchased chicken only once a week (36.5%). This difference is due to the different characteristics of the respondents. Mintzet al.,’s study examined household consumers who purchased chicken for family consumption, resulting in lower purchase frequency and influenced by household storage capacity. In contrast, this study focused on business actors, namely traders and culinary entrepreneurs who must meet daily customer demand, thus requiring more frequent purchases.
Measurement model validation
The initial measurement model is calculated using Confirmatory Factor Analysis (CFA). The results indicate that several indicators have factor loadings below the 0.50 threshold and are not significant, and thus are unable to adequately represent the latent construct (Table 2). Indicators that do not meet these criteria (SC5, SC6, MM5–MM7, OP4–OP5, DS4–DS5, and KP5) were gradually eliminated to raise the reliability and validity of the measurement model.
Model fit and robustness assessment
The initial goodness-of-fit model in Table 3 indicates that the structural model did not yet meet most SEM fitness criteria. Consequently, stepwise model modification was required, considering two primary aspects: modification indices and the theoretical alignment of indicators with their latent constructs. The elimination of indicators was not made solely on statistical considerations instead, indicators that are conceptually vital to representing the research variables were retained. This approach was adopted to maintain a balance between model fit and the constructs’ theoretical robustness. As a result, indicators SC5, SC6, MM6, MM7, OP4, OP5, DS4, and DS5 were eliminated. Although MM5 and KP5 exhibited low factor loadings, they were retained due to their theoretical importance. Alternative analyses without these indicators showed minimal change in the structural model.These results indicated that the model is sufficiently robust and appropriate for testing the proposed hypotheses and addressing the research objectives.
Table 2: Measurement model assessment: factor loadings, composite reliability, and average variance extracted.
Variable/ Kontruct
Indicator
Indicator Statement
Loading Factor
CR
AVE
Supply Chain Management (SC)
0,88
0,64
SC1
KUB chickens are available in markets all year long.
0.86
SC2
Distribution of KUB chicken from producers to consumers runs smoothly
0.78
SC3
Products reach consumers with maintained quality.
0.77
SC4
Coordination between actors in the KUB chicken supply works well.
0.79
SC5
Consumers can easily get the KUB chickens.
0.07*
SC6
Semi-modern processing to maintain the natural flavor.
0.06*
Marketing Mix (MM)
0,82
0,52
MM1
KUB chickens available are good quality.
0.80
MM2
KUB chicken price is in line with the benefits gained.
0.87
MM3
The selling locations of KUB chickens are easy to reach.
0.78
MM4
KUB chicken promotions are easy to find and are informative.
0.76
MM5
Services from the KUB chicken sellers is satisfying.
0.10*
MM6
The transaction process of buying KUB chicken is easy and fast.
0.03*
MM7
The appearance and comfort of the KUB chicken sales locations are attractive.
0.008*
Customer Orientation (OP)
0,85
0,65
OP1
KUB chickens are considered healthy and high-quality products.
0.87
OP2
KUB chicken value is higher than for broiler chickens.
0.78
OP3
KUB chickens are suitable for consumption needs with a suitable flavor.
0.74
OP4
Quality certification and information increase trust in KUB chicken.
0.01*
OP5
KUB chickens have an appropriate size
0.01*
Competitivene (DS)
0,81
0,59
DS1
The taste of KUB chickens is superior compared to similar products.
0.79
DS2
KUB chickens have competitive advantages in the market.
0.76
DS3
KUB chicken price is competitive with the price of alternative products.
0.76
DS4
KUB chickens have a strong image or brand.
0.016*
DS5
KUB chicken products continue to innovate and be on-demand among customers.
0.05*
Marketing Performance (KP)
0,79
0,48
KP1
The selling of KUB chickens indicates an increase.
0.79
KP2
Brand awareness of the KUB chicken is increasing.
0.80
KP3
The market share of KUB chicken is increasing.
0.72
KP4
The profit from the selling of KUB chicken is increasing.
0.77
KP5
The existence of KUB chicken in the market is increasingly widespread.
0.07*
General rules for SEM: loading ≥ 0.50 (ideal ≥ 0.70)* removed.
Table 3: Initial model evaluation and modification.
Indicator
Ideal Limits
Initial Model
Evaluation Model
Model After Modification Based On
Evaluation Model
MI
Theory
Chi-Square
Smaller size is better
1498.162
Poor Fit
233.587
191.015
Fit
p value
≥ 0.05
0.000
Not Fit
0.040
0.047
Marginal Fit
GFI
≥ 0.90
0.545
Poor Fit
0.917
0.929
Good Fit
AGFI
≥ 0.90
0.457
Poor Fit
0.894
0.907
Good Fit
RMSEA
≤ 0.05
0.117
Poor Fit
0.035
0.028
Very Good Fit
RMR
≤ 0.08 - 0.10
0.269
Poor Fit
0.092
0.082
Marginal Fit
CFI
≥ 0.95
0.654
Poor Fit
0.976
0.986
Very Good Fit
TLI
≥ 0.95
0.615
Poor Fit
0.972
0.983
Very Good Fit
NFI
≥0.90
0.598
Poor Fit
0.905
0921
Good Fit
Multivariat Normality
< + 2.58
5.01
Not Normal
1.890
1.681
Normal
Kurtosis
25.972
Not Normal
7.432
6.306
Normal
After purification, each construct is reevaluated to ensure that its conceptual integrity remains intact. The Supply Chain Management (SC) management construct encompasses aspects of distribution coordination and supply availability, while the Marketing Mix (MM) reflects the core dimensions of product, pricing, and promotion strategies relevant to the local market. Customer Orientation (OP) focuses on the players’ understanding of market demand quality and dynamics. Competitiveness (DS) represents cost efficiency and product quality capabilities, whereas Marketing Performance (KP) reflects sales achievements and market expansion. Thus, although the number of indicators has been reduced, the remaining constructs still reflect the core dimensions most empirically relevant to the KUB chicken agribusiness system. Nevertheless, these findings underscore the need to develop more context- and sector-specific instruments in future studies.
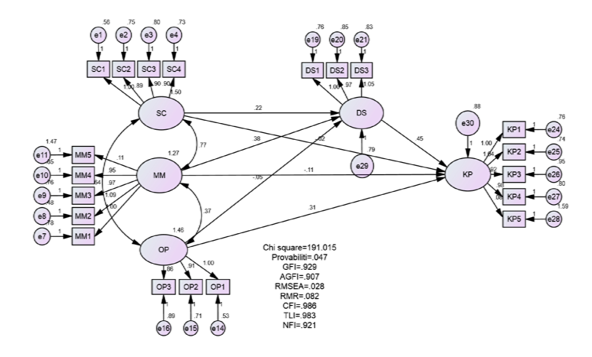
Figure 3 shows that Supply Chain Management (SC), Marketing Mix (MM), and Customer Orientation (OP) act as exogenous constructs influencing DS, which in turn serves as an endogenous mediating variable. Furthermore, DS influences Marketing Performance (KP), which is a primary endogenous variable. This model specification allows for the concurrent examination of both direct and indirect relationships among the variables. Thus, it provides comprehensive insight into the mechanisms that influence the marketing performance of KUB chicken agribusiness.
The goodness-of-fit comparison before and after modifications is presented in Table 3 which presents the two stages of model evaluation modification indices (MI) and theoretical considerations
The goodness-of-fit data in Table 3 suggest that the structural model provides an acceptable fit to the observed data. Specifically, GFI (0.929), AGFI (0.907), CFI (0.986), TLI (0.983), and NFI (0.921) exceed the recommended benchmark values, whereas an RMSEA of 0.028 indicates a close fit between the hypothesized model and the empirical data. Although the obtained p-value (0.047) is marginally below the recommended significance level of 0.05, this finding is not unexpected, as both the chi-square statistic and its corresponding p-value are highly influenced by sample size. Accordingly, the evaluation of model fit is based on a combination of multiple goodness-of-fit indices rather than any single statistical criterion. As shown in Table 3, most goodness-of-fit indices fell into the ‘very good fit’ category. Furthermore, the results of the normality test show a multivariate critical ratio of 1.681, which falls within the ±2.58 range, thus fulfilling the assumption of multivariate normality. The kurtosis value of 6.306 also remained within acceptable limits. Consequently, the research model was deemed valid and suitable for testing the structural relationships among variables.
In SEM with Maximum Likelihood (ML) estimation, the assumption of multivariate normality is a critical prerequisite to ensure the accuracy of parameter estimates, the validity of significance tests, and model fit ; Sarstedt et al.,, 2021). The normality test results indicated that most indicators had skewness C.R. values ranging from -0.192 to -3.037.Several indicators exceed the threshold of ±2.58, specifically KP4 (-2.687), KP1 (-2.881), MM3 (-3.037), SC3 (-2.624), and SC2 (-2.641). The assessment of data normality showed that several observed indicators had critical ratio (C.R.) values outside the recommended range of ±2.58, indicating some departures from univariate normality. The multivariate kurtosis value was 25.972, with a critical ratio of 5.010, indicating a departure from multivariate normality. The Mahalanobis distance analysis identified several observations with p1 values
below 0.05, including observations 6, 67, 224, and 52. However, their corresponding p2 values did not indicate that these observations were extreme relative to the overall multivariate distribution. Therefore, these observations were retained because there was insufficient evidence to classify them as serious multivariate outliers. Given the departure from multivariate normality, the robustness of the SEM model was further assessed using maximum likelihood bootstrap with 2,000 bootstrap samples and the Bollen–Stine procedure. The Bollen–Stine bootstrap resulted in a p-value of 0.250, which exceeded the 0.05 significance level, indicating that the hypothesized model could not be rejected based on the bootstrap assessment of model fit. These results provide additional support for the adequacy of the model despite the observed departure from multivariate normality. Furthermore, the multicollinearity assessment showed that none of the correlations among the observed indicators exceeded 0.90, indicating no evidence of severe multicollinearity .
Common method bias assessment
To assess the potential for common method bias, Harman’s single-factor test was conducted using the 20 final measurement indicators. The first factor accounted for 30.178% of the total variance, which was below the commonly used 50% threshold. This result suggests that common method bias is unlikely to represent a major concern in the study. Nevertheless, all constructs were measured using self-reported questionnaires administered to the same respondents, which remains a potential limitation. Future research should incorporate objective performance measures and, where possible, data from multiple sources to further reduce the potential influence of common method variance.
The results of the convergent validity and construct reliability assessments are presented in Table 2 show that most indicators have factor loadings above 0.70, indicating that they are capable of adequately representing the latent constructs. Every construct surpassed the 0.70 minimum benchmark for Construct Reliability (CR), specifically: supply chain at 0.88, marketing mix at 0.82, customer orientation at 0.85, competitiveness at 0.81, and marketing performance at 0.79. These results indicate that all constructs exhibit good reliability. Furthermore, the Average Variance Extracted (AVE) for each variable generally met the 0.50 threshold, specifically: supply chain at 0.64, marketing mix at 0.52, customer orientation at 0.65, and competitiveness at 0.59. Meanwhile, the marketing performance construct has an AVE of 0.48. Although the AVE for marketing performance (0.48) is slightly below the recommended threshold of 0.50, the construct reliability (0.79) exceeds the 0.70 benchmark, and convergent validity is considered acceptable. Discriminant validity was assessed using the Fornell-Larcker criterion. The square roots of AVEs for each construct exceeded the inter-construct correlations, confirming discriminant validity. . After indicator purification, the remaining indicators demonstrated satisfactory convergent validity and reliability, supporting the use of the measurement model for subsequent structural analysis ; .
Structural model and hypothesis testing
After confirming the model’s validity and robustness, the structural model was estimated to evaluate the hypothesized relationships among the study variables. The results of the structural model indicate that Supply Chain Management (SC) has a positive and significant effect on Competitiveness (DS) (β = 0.220, p = 0.032), thereby supporting H1, which proposed that Supply Chain Management (SC) positively affects Competitiveness (DS). Similarly, the Marketing Mix (MM) has a positive and significant effect on Competitiveness (DS) (β = 0.380, p = 0.001), supporting H2. In contrast, Customer Orientation (OP) does not have a significant positive effect on Competitiveness (DS), as indicated by its negative and statistically insignificant path coefficient (β = −0.020, p = 0.776); therefore, H3 is not supported. Competitiveness (DS), however, has a significant positive effect on Marketing Performance (KP) (β = 0.450, p < 0.001), supporting H4, which hypothesized that higher competitiveness leads to better marketing performance. The direct effect of Supply Chain Management (SC) on Marketing Performance (KP) is negative and statistically insignificant (β = −0.020), resulting in the rejection of H5. Similarly, the Marketing Mix (MM) does not have a significant positive effect on Marketing Performance (KP) (β = −0.110), leading to the rejection of H6. By contrast, Customer Orientation (OP) has a positive and significant effect on Marketing Performance (KP) (β = 0.310, p = 0.003), thereby supporting H7. Overall, the findings indicate that the effects of organizational capabilities on marketing performance in KUB chicken agribusiness are not uniform. In particular, supply chain management and marketing mix contribute significantly to ompetitiveness, while competitiveness itself significantly enhances marketing performance. These findings further suggest that competitiveness plays an important mediating role in translating supply chain and marketing capabilities into improved marketing performance.
The proposed causal directions are grounded in the theoretical relationships among the constructs. From the resource-based view, supply chain management capabilities represent organizational resources and capabilities that can enhance coordination, operational efficiency, responsiveness, and ultimately competitiveness. Similarly, marketing mix capabilities enable agribusiness actors to configure product, pricing, distribution, and promotional activities in ways that strengthen their competitive position. Competitiveness is subsequently expected to translate these operational and market capabilities into superior marketing performance. From a market orientation perspective, customer orientation enables firms to understand and respond to customer needs, which can contribute directly to improved marketing performance. Accordingly, the hypothesized paths specify supply chain management, marketing mix, and customer orientation as antecedents of competitiveness and/or marketing performance, while competitiveness is positioned as a mediating mechanism between selected organizational capabilities and marketing performance. While the proposed causal paths are theoretically grounded, the cross-sectional design precludes definitive causal inferences. Longitudinal studies are needed to establish temporal precedence.
The hypothesized relationships among the latent constructs were evaluated using Covariance-Based Structural Equation Modeling (CB-SEM) with the Maximum Likelihood (ML) estimation method in IBM SPSS AMOS. Within the CB-SEM framework, the structural model is specified to capture the causal relationships among latent variables rather than directly measured indicators. Model parameters are estimated by minimizing the discrepancy between the observed covariance matrix and that implied by the proposed theoretical model. Accordingly, the structural equations examined in this study are specified as follows:
Competitiveness Equation:
DS = 0.220 SC + 0.380 MM - 0.020 OP + ζ1
Marketing Performance (PM) Equation:
KP = 0,450 DS - 0,020 SC - 0,110 MM + 0,310 OP + ζ2
This equation represents the total effect of supply chain management, the marketing mix, and customer orientation on marketing performance, where the coefficient reflects the combined direct and indirect effects, and the error term captures the residual variance not explained by the endogenous constructs. The equation can further be simplified to:
KP = 0,079 SC + 0, 061 MM + 0,301 OP + ζ
The equation above shows that KP was influenced by three main variables: SC, MM, and OP, with ζ representing the error term or other variables outside the model that are not explicitly analyzed in this study. The substitution equation provides an algebraic representation of the estimated linear structural relationships. By substituting the structural equation for competitiveness into the marketing performance equation, the overall direct and indirect contributions of the exogenous constructs to marketing performance can be represented in a single linear expression. This representation is based on the linear specification of the SEM and does not imply that nonlinear or interaction effects are absent in the broader population.
The path coefficients in this study indicate the relative contribution of each variable to Marketing Performance (KP). The Supply Chain Management (SC) variable had a coefficient of 0.079, indicating a positive effect, albeit smaller than that of other variables. The Marketing Mix (MM) variable, with a coefficient of 0.061, also contributes, albeit moderately. The Customer Orientation (OP) variable has the highest coefficient, 0.301, indicating a dominant influence on KP. These findings indicate that meeting consumer needs plays a more influential role in the marketing success of KUB chicken products than operational factors or alternative marketing strategies.
Mediation analysis
The mediation analysis presented in Table 4 indicated that Competitiveness (DS) serves as a significant mediating variable in the relationship between Supply Chain Management (SC) and Marketing Performance (KP), as well as between the Marketing Mix (MM) and Marketing Performance (KP). The results in Table 4 confirm that the indirect effect of SC on KP through DS is significant, indicating full mediation. Similarly, the indirect effect of MM on KP through DS is also significant, thus supporting full mediation. Conversely, Customer Orientation (OP) does not show a significant indirect effect through DS, while its direct effect on KP remained significant, indicating the absence of a mediating effect. A comprehensive interpretation of both direct and indirect effects was presented in Table 4. The present study demonstrated provided Overall, these findings confirm that DS functions as the primary transmission mechanism linking structural capabilities and marketing strategies to marketing performance in the KUB chicken agribusiness system.
Effects of supply chain management, marketing mix, and customer orientation on competitiveness
The first objective of this study was to examine how supply chain management, marketing mix, and customer orientation influence the competitiveness of KUB chicken agribusiness. Based on the SEM model in Figure 3, the results of the structural analysis of Supply Chain Management (SC) show a positive effect on Competitiveness (DS) with a path coefficient of 0.22 (standardized estimate = 0.253). This finding indicates that the better the supply chain management, the higher the competitiveness of the KUB chicken agribusiness. Effective supply chain management supports the availability of production inputs, smooth distribution, operational cost efficiency, and the ability to respond more quickly to changes in market demand. For perishable commodities such as KUB chicken, good coordination between farmers, traders, and culinary entrepreneurs also plays a crucial role in maintaining supply continuity and product quality. This finding is in line with the Resource-Based View (RBV), which states that an organization’s ability to manage resources and strategic capabilities can create sustainable competitive advantage . In the agribusiness context, integrating relationships with suppliers, distributors, and customers is a capability that can improve operational efficiency while strengthening competitiveness. The results of this study are also consistent with stated that supply chain management practices increase competitive advantage through distribution efficiency, collaboration between business actors, and improved market responsiveness. Similarly, found that supply chain integration contributes to increased competitiveness through improved service quality, delivery accuracy, and cost efficiency.
This results of the structural analysis of the Marketing Mix (MM) have the greatest influence on Competitiveness (DS) with a path coefficient of 0.38 (standardized estimate = 0.396). This finding indicates that the marketing mix is the most dominant factor in increasing the competitiveness of KUB chicken agribusiness. Marketing strategies that include product quality, competitive prices, effective distribution, and appropriate promotions can increase customer perceived value, thereby strengthening the product’s competitive position in the market. Thus, the competitiveness of KUB chicken is not only determined by production capacity but also by the ability of business actors to design marketing strategies that suit market needs. The results of this study are in line with who stated that the implementation of the marketing mix has a significant effect on increasing the competitiveness of small and medium enterprises through increasing customer satisfaction and expanding market share. This finding is also supported by (Nuseir and Madanat., 2020) who explained that the combination of product, price, promotion, and distribution strategies is a key factor in building competitive advantage in the agribusiness and food industry sectors. Therefore, strengthening the
Tabel 4: Mediation analysis results.
Mediation Path
Direct Effect
Indirec Effect (β)
SE
CR (z)
P
95% CI
Mediation Type
SC→DS→KP
Insigni ficant
0.099
0.038
2.605
0.009
0.025–0.173
Full mediation
MM→DS→KP
Insigni ficant
0.171
0.047
3.638
<0.001
0.079–0.263
Full mediation
OP→DS→KP
Signi ficant
−0.009
0.020
−0.450
0.653
−0.048–0.030
No mediation
marketing mix strategy is a priority for KUB chicken agribusiness actors to increase competitiveness and expand market opportunities.
Contrary to expectations, customer orientation did not exhibit a statistically significant effect on competitiveness (path coefficient = −0.05; standardized estimate = −0.052). This finding suggests that a better understanding of customer needs and preferences does not automatically translate into stronger competitive capability within the KUB chicken agribusiness sector. This finding differs from , , and , who reported that customer orientation has a positive effect on competitive advantage. This difference is likely due to the characteristics of the respondents. Previous research has generally been conducted on companies or MSMEs that have implemented more modern marketing strategies, while KUB chicken agribusinesses are still dominated by small-scale, production-oriented businesses. As a result, information regarding customer needs has not been translated into product innovation, differentiation, or marketing strategies that create competitive advantage.
However, the results of this study align with , who showed that customer orientation does not always generate direct competitive advantage. The influence of customer orientation will be more optimal when supported by other capabilities, such as innovation, digital marketing, and the organization’s ability to transform customer information into added value for the market.
This finding strengthens the Resource-Based View (RBV) which explains that competitive advantage is built through internal capabilities that are difficult to imitate. In KUB chicken agribusiness, Supply Chain Management and Marketing Mix are strategic capabilities that significantly increase competitiveness, while Customer Orientation has not been able to become a source of competitive advantage if it is not supported by innovation, marketing digitalization, and the organization’s ability to transform market information into value-added business strategies.
Assess the effects of supply chain management, marketing mix, and customer orientation on marketing performance,
The second objective was to assess the effects of supply chain management, marketing mix, and customer orientation on marketing performance. Based on figure 2, the analysis results show that Supply Chain Management (SC) has a negative and insignificant effect on Marketing Performance (KP), with a path coefficient of -0.02 (standardized estimate ≈ -0.026). Although the coefficient for supply chain management on competitiveness (β = 0.220) is modest, it is statistically significant and practically meaningful given the constraints of the agricultural context.
This finding indicated that supply chain management has not been able to directly improve marketing performance. Although supply chain management can improve operational efficiency, smooth distribution, and supply continuity, these benefits are not automatically reflected in increased sales, customer growth, or market share. This suggested that operational improvements first increase competitiveness, and then this competitiveness contributes to improved marketing performance.
These results differ from research by , which stated that supply chain integration can directly improve organizational performance through improved service quality and operational efficiency. However, this finding is supported by the Resource-Based View (RBV) approach, which explains that internal capabilities do not always directly lead to performance but often impact it through the formation of competitive advantage as an intermediary variable. In the KUB chicken agribusiness, the ability to manage the supply chain plays a greater role in strengthening competitive position than directly improving marketing performance.
Similarly, Marketing Mix (MM) showed a negative and insignificant effect on Marketing Performance (KP) with a path coefficient of -0.11 (standardized estimate ≈ -0.107). This result indicated that the marketing mix strategy has not been able to directly improve marketing performance. This condition indicated that underscored advanced the implementation of product, price, distribution, and promotion strategies is not enough to increase sales if it has not succeeded in creating a competitive advantage in the market. In other words, the effectiveness of the marketing mix first increases competitiveness, then this competitiveness drives improved marketing performance.
This finding is different from research by (Nuseir and Madanat., 2020) which found that the marketing mix has a direct influence on company performance. However, the results of this research show that in the KUB chicken agribusiness which is dominated by small-scale businesses, the success of marketing strategies still depends very much on the ability of business actors to build competitiveness through product quality, cost efficiency and market trust.
In contrast to these two variables, Customer Orientation (OP) has a positive effect on Marketing Performance (KP) with a path coefficient of 0.31 (standardized estimate ≈ 0.337). These findings show that the higher the business actor’s orientation towards customer needs and preferences, the better the marketing performance achieved. Business actors who understand customer needs tend to be able to provide products that meet market demand, maintain long-term relationships with customers, and increase customer satisfaction and loyalty. This condition ultimately has an impact on increasing sales and expanding the market.
These results are in line with market orientation theory which states that customer orientation is one of the main determinants of marketing success. These findings also supported research by as well as more recent research by which shows that companies with high customer orientation tend to have better marketing performance because they are able to create value that meets customer needs. In the context of KUB chicken agribusiness, although customer orientation has not been able to directly increase competitiveness, understanding customer needs has proven to be able to increase the effectiveness of marketing activities.
Evaluate of the consequences of competitiveness on marketing performance
The third objective was to evaluate the influence of competitiveness on marketing performance. The structural analysis results in Figure 3 show that Competitiveness (DS) has a positive and significant effect on Marketing Performance (KP) with a path coefficient of 0.45 (standardized estimate = 0.436). This finding indicates that the higher the competitiveness of KUB chicken agribusinesses, the better their marketing performance. In other words, increased competitiveness contributes to increased sales, expanded market share, customer retention, and the achievement of marketing targets.
This relationship indicates that competitiveness results from a business’s ability to create superior value compared to competitors through product quality, cost efficiency, supply reliability, and the ability to respond to market needs. These advantages enable businesses to gain customer trust, increase loyalty, and strengthen the position of KUB chicken products in the market. Therefore, competitiveness is a strategic factor determining marketing success in KUB chicken agribusinesses.
This finding aligns with the Resource-Based View (RBV), which explains that competitive advantage built through the utilization of organizational resources and capabilities will result in superior performance. In this study, competitiveness can be viewed as the result of internal capabilities developed through effective supply chain management and marketing strategies, which then translate into improved marketing performance.
The results of this study are also consistent with research by , which states that competitive advantage positively impacts company performance because it enhances the organization’s ability to create higher value than competitors. Similarly, found that companies with high competitiveness tend to achieve better marketing performance through increased customer satisfaction, loyalty, and expanded market share. Research by also shows that competitiveness is a key factor bridging the relationship between a company’s internal capabilities and improved business performance.
Furthermore, this study supported the work of Khan et al, (2022), which showed that increasing competitiveness through operational efficiency, product quality, and marketing innovation can boost sales and the sustainability of agribusinesses. This demonstrates that competitive advantage not only serves as a differentiator in the market but also as a factor that directly increases marketing success.
In the KUB chicken agribusiness in Banten Province, competitiveness is reflected in the ability of business actors to provide quality products, maintain supply continuity, offer competitive prices, and build good relationships with business partners and customers. This combination of factors increases market confidence in KUB chicken, resulting in increased demand and marketing performance.
The results demonstrate that competitiveness significantly enhances marketing performance, indicating that enterprises with stronger competitive capabilities are more likely to achieve superior market outcomes.
Investigating the role of mediation in competition
The fourth objective was to investigate whether competitiveness mediates the relationships between supply chain management, marketing mix, and marketing performance. The research results, shown in Table 4, indicate that Supply Chain Management (SC) has no direct effect on Marketing Performance (KP), but it does have a significant indirect effect through Competitiveness (Indirect Effect = 0.099). This indicates that Competitiveness acts as a full mediator. Therefore, effective supply chain management does not directly increase sales, customer growth, or market share; it first builds competitiveness through improved cost efficiency, supply reliability, service quality, and the ability to meet market needs. In the KUB chicken agribusiness, which is a perishable product, distribution efficiency, coordination between stakeholders, and timely delivery are operational advantages that only impact marketing performance when they are able to produce more competitive prices, better product quality, and supply continuity.
This finding supports the Resource-Based View (RBV) , which states that internal capabilities must be converted into competitive advantages before producing superior performance. Empirically, these results align with (Tarigan et al.,, 2021), , who found that competitive advantage mediates the relationship between suplay chain management practices and firm performance. Conversely, these results differ from who reported a direct effect of suplay chain management on performance. This difference is thought to be influenced by the characteristics of the respondents, as this study focused on small-scale KUB chicken agribusinesses who still face limitations in technology, logistics, and supply chain integration.
The relationship between marketing mix and marketing performance shows an insignificant direct effect, while the indirect effect through competitiveness is significant (Indirect Effect = 0.171), thus competitiveness acts as a full mediator. The larger indirect effect compared to the supply chain management pathway indicates that the marketing mix strategy has a stronger contribution to shaping competitiveness. This finding indicates that product, pricing, distribution, and promotion strategies are not capable of directly improving marketing performance; they must first create a competitive advantage. Therefore, the success of the marketing mix is determined by its ability to deliver differentiated and superior value compared to competitors.
This study’s findings align with (Nuseir and Madanat., 2020) who stated that the marketing mix improves business performance through competitive advantage, who found that the marketing mix increases the competitiveness of MSMEs before impacting performance, and , which explains that marketing capabilities improve performance by creating superior customer value. However, these results differ from those of (Oktora et al., 2020) which reported a direct effect of the marketing mix on marketing performance. This difference is thought to be due to the characteristics of the KUB chicken agribusiness, which is still dominated by small-scale businesses with simple marketing strategies. Therefore, the effectiveness of the marketing mix is first realized in the form of increased competitiveness before improving marketing performance.
Unlike the previous two variables, Customer Orientation has a direct effect on Marketing Performance, while the indirect effect through Competitiveness is not significant (Indirect Effect = -0.009). This finding indicates that customer orientation can improve marketing performance without necessarily fostering competitiveness.
In the KUB chicken agribusiness, understanding customer needs enables businesses to maintain better relationships, improve customer satisfaction, and maintain customer loyalty. These impacts directly increase sales volume and marketing success.
On the other hand, these results contradict the following research: who found that customer orientation increases competitive advantage and who showed that customer orientation strengthens competitiveness through increased innovation.
This difference is likely due to the level of organizational maturity. Previous research was conducted on companies that had implemented customer relationship management (CRM) and modern marketing systems, while KUB chicken businesses are still predominantly small businesses that rely on experience and personal relationships, thus underutilizing customer information as a source of strategic innovation.
CONCLUSION
The results of this study indicate that Supply Chain Management and Marketing Mix have a positive and significant effect on Competitiveness, while Customer Orientation does not have a significant effect. Among the Supply Chain Management and Marketing Mix variables, the one with the greatest influence is Marketing Mix.
Furthermore, regarding the influence of these three variables on Marketing Performance, only Customer Orientation had a positive and significant direct effect, while Supply Chain Management and Marketing Mix did not show a significant direct effect. This indicates that understanding customer needs can improve marketing performance, while operational and marketing capabilities do not directly result in improved performance.
Competitiveness was shown to have a positive and significant effect on Marketing Performance, indicating that the higher a business's competitiveness, the better its marketing performance.
The results of the mediation analysis indicate that competitiveness acts as a full mediator in the relationship between supply chain management and marketing mix and marketing performance, but does not mediate the relationship between customer orientation and marketing performance. Therefore, improved marketing performance derived from supply chain management and the marketing mix must first be realized through increased competitiveness, while customer orientation has a direct influence on marketing performance.
Theoretical Implications
This study provides several theoretical implications for understanding competitiveness and marketing performance in KUB chicken agribusiness. First, the findings extend the application of the resource-based view by demonstrating that supply chain management and marketing mix capabilities can function as organizational capabilities that contribute to competitiveness. The significant effects of supply chain management and marketing mix on competitiveness indicate that the ability to coordinate resources, manage supply chain activities, and configure marketing activities is relevant to building competitive positions in KUB chicken agribusiness.
Second, the findings complement the market orientation perspective by demonstrating the relevance of customer orientation to marketing performance. The significant direct relationship between customer orientation and marketing performance suggests that understanding and responding to customer needs remains important for achieving market-related outcomes.
Third, this study integrates the RBV and market orientation perspectives by positioning internal capabilities and market responsiveness as complementary mechanisms. RBV explains the internal capability foundation of competitiveness, whereas market orientation explains how organizational capabilities are aligned with market requirements. The mediating role of competitiveness therefore provides a theoretical mechanism linking selected internal capabilities to marketing performance in the KUB chicken agribusiness context.
Limitations and Future Research
This study has several limitations. First, its cross-sectional design limits the ability to establish temporal ordering and definitive causal relationships. Although the proposed relationships are theoretically grounded in the resource-based view, supply chain management, and market orientation perspectives, the findings should therefore be interpreted as theoretically grounded associations. Future studies could employ longitudinal or panel designs to strengthen causal inference.
Second, all constructs were measured using self-reported questionnaires from the same respondents, creating potential common method bias. Harman’s single-factor test showed that the first factor accounted for 30.178% of the variance, below the 50% threshold, suggesting that common method bias is unlikely to be a major concern. Nevertheless, future research should incorporate objective measures and multiple data sources.
Third, purposive sampling and the focus on KUB chicken agribusiness in Banten may limit representativeness and generalizability to other poultry breeds, regions, and agribusiness contexts. Broader and, where feasible, probability-based samples are recommended.
Fourth, potential endogeneity from unobserved factors may affect the estimated relationships. Future research should consider control variables, longitudinal data, or appropriate endogeneity-correction approaches.
Finally, the linear and additive model did not examine interaction or nonlinear effects. Future research could test whether supply chain management and marketing mix capabilities interact or produce synergistic effects on competitiveness.
ACKNOWLEDGEMENTS
The authors extends sincere gratitude to the Ministry of Agriculture of the Republic of Indonesia, the Agency for Agricultural Modernization (BRMP), relevant agricultural agencies in Banten Province, and all respondents and stakeholders involved in the KUB chicken agribusiness value chain for their support, cooperation, and valuable contributions to this research. The author also thanks all those who provided assistance during the data collection and manuscript preparation processes.
NOVELTY STATEMENT
This study makes a significant contribution by revealing the important mediating role of competitiveness in linking supply chain management and the marketing mix to marketing performance in KUB chicken agribusiness in Banten, Indonesia. The findings also show that business actors’ perceptions of customer orientation have a direct effect on marketing performance but do not significantly contribute to competitiveness. These findings highlight the need to prioritize operational transformation and marketing strategies to strengthen competitive positioning, while also underscoring the need for further research to improve the operationalization of customer orientation among business actors in local product markets.
AUTHOR’s CONTRIBUTION
Dewi Haryani: Conceptualization, methodology, formal analysis, data curation, and original draft preparation; Aliudin: Critically revised the manuscript for conceptual and intellectual content; Mirajiani: Drafted manuscripts and evaluated content completeness and Kartina, A.M: Critically evaluated and revised the methodology section of manuscript
Generate AI and AI assisted technology statement
The authors declare that no generative AI and AI assisted technology was used in the creation of this manuscript.
Conflict of interests
The writers assert that they possess no conflict of interests.
Figures
Figure 1:.
Research design and workflow of the study.
Figure 2:.
Initial measurement modle for sem-amos.
Figure 3:.
Final structural model
References
Adam L, Jin J, Khan A, Hussain J, Sophia TT (2021). A study of the adoption of technology in agriculture: Evidence from the Indonesian Paddy-Rice Farmer. Cutting-Edge Res. Agric. Sci. Vol. 12, 105–124. https://doi.org/10.9734/bpi/cras/v12/2487F[CrossRef]
Anwar M, Shah SZA (2021). Entrepreneurial orientation and generic competitive strategies for emerging SMEs: Financial and nonfinancial performance perspective. J. Public Aff. an Internasional J., 21(1), 21–25. https://doi.org/10.1002/pa.2125[CrossRef]
Arun K, Ozmutlu SY (2024). The effect of environmental competitiveness, customer and competitor orientation on export performance Available to Purchase. J. Bus. Ind. Mark., 39(2), 142–160. https://doi.org/10.1108/JBIM-01-2022-0019[CrossRef]
Bakrie B, Tohaeni ES, Yusriani Y, Tirajoh S (2021). The development of a newly formed superior local chicken in Indonesia–A review. J. Hunan Univ. Nat. Sci., 48(9). https://www.jonuns.com/index.php/journal/article/view/740
Barney J (1991). Firm Resources and sustained competitive advantage. J. Manag., 17(1), 99–120. https://doi.org/10.1177/014920639101700108[CrossRef]
Brown P, Daigneault A, Dawson J (2019). Age, values, farming objectives, past management decisions, and future intentions in New Zealand agriculture. J. Environ. Manag., 231, 110-120. https://doi.org/10.1016/j.jenvman.2018.10.018[CrossRef]
Byrne BM (2016). Structural equation modeling with AMOS. In Structural Equation Modeling With AMOS. https://doi.org/10.4324/9781315757421-11[CrossRef]
Crick JM (2021). The dimensionality of the market orientation construct. J. Strategic Mark., 29(4), 281–300. https://doi.org/10.1080/0965254X.2019.1677747[CrossRef]
Ferreira IA, Oliveira JP, Antonissen J, Carvalho H (2023). Assessing the impact of fusion-based additive manufacturing technologies on green supply chain management performance. J. Manuf. Technol. Manage., 34(1), 187–211. https://doi.org/10.1108/JMTM-06-2022-0235[CrossRef]
Flick U (2022). Doing interview research: The essential how to guide. SAGE Publ. Ltd. https://doi.org/10.4135/9781036235697[CrossRef]
Flynn BB, Huo B, Zhao X (2010). The impact of supply chain integration on performance: A contingency and configuration approach. J. Oper. Manage., 28(1), 58–71. https://doi.org/10.1016/j.jom.2009.06.001[CrossRef]
Fornell C, Larcker DF (1981). Evaluating structural equation models with unobservable variables and measurement error. J. mark. Res., 18(1), 39-50. https://doi.org/10.2307/3151312[CrossRef]
Ge L (2022). To buy or not to buy? A research on the relationship between traceable food extrinsic cues and consumers’ purchase intention. Front. Psychol., 13(April), 1–14. https://doi.org/10.3389/fpsyg.2022.873941[CrossRef]
Gharib HB, El-Menawey MA, Hamouda RE (2023). Factors affecting small-scale broiler chicken farm profitability and challenges faced by farmers in egyptian rural. Trop. Anim. Sci. J., 46(2), 261–268. https://doi.org/10.5398/tasj.2023.46.2.261[CrossRef]
Gonu E, Agyei PM, Richard OK, Asare-Larbi M (2022). Customer orientation, service quality and customer satisfaction interplay in the banking sector: An emerging market perspective. Cogent Bus. Manage., 10(1). https://doi.org/10.1080/23311975.2022.2163797[CrossRef]
Hidayat C, Asmarasari SA (2015). Native chicken production in Indonesia: A review. Indonesian J. Anim. Sci., 17(1), 1-11. https://doi.org/10.25077/jpi.17.1.1-11.2015[CrossRef]
Jojo, Harianto, Rita Nurmalina, Dedi BH (2021). Integration of broiler chicken markets in production centers in West Java and the Indonesian market. Food, 30(1), 31–44. https://www.academia.edu/download/87476201/432.pdf https://doi.org/10.33964/jp.v30i1.526[CrossRef]
Juan JG (2025). Market orientation and distribution strategies in poultry agribusiness: Evidence from chicken layer farms in Nueva Ecija. Asian J. Agric. Rural Dev., 15(3), 396–405. https://doi.org/10.55493/5005.v15i3.5565[CrossRef]
Kamarudin AM, Bandera AD (2025). Market orientation in agribusiness: A Review of Key Drivers and Boundaries. Am. J. Econ. Bus. Innov., 4(3), 188–194. https://doi.org/10.54536/ajebi.v4i3.6194[CrossRef]
Kant S, Jabo D, Borji B (2024). From customer orientation to competitive edge: Unpacking Bank Performance Dynamics. Int. J. Mark., Commun. New Media, 12(23), 28–48. https://doi.org/10.54663/2182-9306.2024.v.12.n.23.28-48[CrossRef]
Khan S, Naseer M, Hayat M, Zamir SW, Khan FS, Shah M (2022). Transformers in vision: A Survey. ACM Comput. Surv., 54(10). https://doi.org/10.1145/3505244[CrossRef]
Kline RB (2018). Response to leslie hayduk’s review of principles and practice of structural equation modeling,1 4th edition. Can. Stud. Popul., 45(3–4), 188–195. https://doi.org/10.25336/csp29418[CrossRef]
Lo HW, Liou JJH, Wang HS, Tsai YS (2018). An integrated model for solving problems in green supplier selection and order allocation. J. Cleaner Prod., 190, 339–352. https://doi.org/10.1016/j.jclepro.2018.04.105[CrossRef]
Mintz O, Currim IS, Deshpandé R (2023). National customer orientation: an empirical test across 112 countries. Mark. Lett., 34(2), 189–204. https://doi.org/10.1007/s11002-023-09668-5[CrossRef]
Morgan NA, Whitler KA, Feng H, Chari S (2018). Research in marketing strategy. J. Acad. Mark. Sci., 47(1), 4–29. https://doi.org/10.1007/s11747-018-0598-1[CrossRef]
Nurfadillah S, Rachmina D, Kusnadi N (2018). Impact of trade liberalization on indonesian broiler competitiveness. J. Indones. Trop. Anim. Agric., 43(4), 421–428. https://doi.org/10.14710/jitaa.43.4.429-437[CrossRef]
Nurhasanah N, Murwatiningsih M (2018). The influence of market orientation, Learning orientation, innovation and competitive advantage to improve marketing performance. Manage. Anal. J., 7(4), 458–468. https://doi.org/10.15294/maj.v7i4.25637[CrossRef]
Nuseir MT, Madanat, H (2020). 4Ps: A strategy to secure customers’ loyalty via customer satisfaction. Int. J. Mark. Stud., 7(4), 78–87. https://doi.org/10.5539/ijms.v7n4p78[CrossRef]
Oktora YS, Sudarmiatin, Hermawan A (2022). Effect of marketing mix and market orientation on the marketing performance of pia japanan cake business. Int. J. Humanit. Educ. Soc. Sci. (IJHESS), 2(3), 894–902. https://doi.org/10.55227/ijhess.v2i3.320[CrossRef]
Owot GM, Okello DM, Olido K, Odongo W (2023). Trust-supply chain performance relationships: unraveling the mediating role of transaction cost attributes in agribusiness SMEs. Front. Sustainable Food Syst., 7. https://doi.org/10.3389/fsufs.2023.1113819[CrossRef]
Quisumbing A, Pandolfelli L (2009). Promising aproaches to address the needs of poor female farmers. IFPRI Note, 13(July). http://www.ifpri.org/pubs/dp/IFPRIDP00882.pdf
Quraysin I, Diposumartob NS, Muharam H (2024). Analysis of the relationship between digital marketing strategies and customer orientation with the competitive advantage of SMEs. J. Soc. Econ. Educ.,13(01). 33–47. https://doi.org/10.24235/edueksos.v13i01.17392[CrossRef]
Reardon T, Liverpool-Tasie LSO, Minten B (2021). Quiet revolution by SMEs in the midstream of value chains in developing regions: wholesale markets, wholesalers, logistics, and processing. Food Secur., 13(6), 1577–1594. https://doi.org/10.1007/s12571-021-01224-1[CrossRef]
Saharan P, Mishra US (2025). Exploring the relationship among digital marketing, market orientation, and SME Sustainability: A Systematic Review. J. Int. Commer. Law Technol., 6, 872-887.
Santoso RP, Sopingi I, Laili CN, Irawati W (2025). The effect of marketing performance and market orientation on competitive advantage. BIMA : J. Bus. Innov. Manage., 7(3), 290–298. https://doi.org/10.33752/bima.v7i3.9894[CrossRef]
Saptana, Ilham N (2020). Development of integrated supply chains of chicken meat in West Java and East Java. Agric. Policy Anal., 18(1), 41–57.
Sarstedt M, Liu Y (2024). Advanced marketing analytics using partial least squares structural equation modeling (PLS-SEM). In J. Mark. Anal. (Vol. 12, Number 1, pp. 1–5). Palgrave Macmillan. https://doi.org/10.1057/s41270-023-00279-7[CrossRef]
Sarstedt M, Ringle CM, Hair JF (2021). Partial least squares structural equation modeling. In Handb. Mark. Res. (pp. 1–47). Springer International Publishing. https://doi.org/10.1007/978-3-319-05542-8_15-2[CrossRef]
Sgroi F, Sciancalepore VD (2022). Dynamics of structural change in agriculture, transaction cost theory and market efficiency: The case of cultivation contracts between agricultural enterprises and the food industry. J. Agric. Food Res., 10(August), 100396. https://doi.org/10.1016/j.jafr.2022.100396[CrossRef]
Soper J (2022). An investigation of the influence of a decision support system on simulated ice management performance (Doctoral dissertation, Memorial University of Newfoundland). https://hdl.handle.net/20.500.14783/9945
Sudarsono B, Tentama F, Ghozali FA (2022). Employability analysis of students in yogyakarta: Confirmatory Factor Analysis. AL-ISHLAH: J. Educ., 14(2), 1451–1462. https://doi.org/10.35445/alishlah.v14i2.1782[CrossRef]
Sugiyono S (2021). The evaluation of facilities and infrastructure standards achievement of vocational high school in the Special Region of Yogyakarta. J. Educ. Res. Eval., 25(2), 207–217. https://doi.org/10.21831/pep.v25i2.46002[CrossRef]
Sukati I, Bawaain A (2019). The practices of halal foods and beverages supply chain on marketing performance: A Conceptual Framework. Int. J. Bus. Soc. Sci.,10(8),110–117. https://doi.org/10.30845/ijbss.v10n8p13[CrossRef]
Sumiati, Fadilah R, Darmawan A, Nadia R (2025). Challenges and constraints to the sustainability of poultry farming in Indonesia. Anim. Biosci., 38(4 Special Issue), 802–817. https://doi.org/10.5713/ab.24.0678[CrossRef]
Tarigan ZJH, Siagian H, Jie F (2021). Impact of enhanced enterprise resource planning (Erp) on firm performance through green supply chain management. Sustainability (Switzerland), 13(8). https://doi.org/10.3390/su13084358[CrossRef]
Teece DJ (2018). Business models and dynamic capabilities. Long Range Planning, 51(1), 40–49. https://doi.org/10.1016/j.lrp.2017.06.007[CrossRef]
Tolossa AT, Singh M, Gautam RK (2024). Unveiling the nexus: the crucial role of competitive advantage in bridging entrepreneurial marketing practices and sustainable firm performance in small and medium enterprises. J. Innov. Entrepreneurship, 13(1). https://doi.org/10.1186/s13731-024-00398-0[CrossRef]
Wahyuni S, Ghozali I (2019). The impact of brand image and service quality on consumer loyalty in the banking sector. https://www.um.edu.mt/library/oar/handle/ 123456789/53354 https://doi.org/10.35808/ijeba/352[CrossRef]
Wang Q, Zhao X, Voss C (2016). Customer orientation and innovation: A comparative study of manufacturing and service firms. Int. J. Prod. Econ., 171, 221–230. https://doi.org/10.1016/j.ijpe.2015.08.029[CrossRef]
Westland (2010). Lower bounds on sample size in structural equation modeling. Electron. Commerce Res. Appl., 9(6), 476–487. https://doi.org/10.1016/j.elerap.2010.07.003[CrossRef]
Wichean A, Sungsanit M (2022). Factors influencing the intentions to adopt technology of the broiler farmer in livestock Region 3, Thailand. Trends Sciences, 19(1), 1–11. https://doi.org/10.48048/tis.2022.1707[CrossRef]
Wijaya D, Subagjo (2025). The influence of customer orientation and competitor orientation on business performance through innovation capability. 75–93. https://doi.org/10.37715/performa.v10i1.3908[CrossRef]
Zhang T, Yan T, Qiu T (2020). Effects of age on farmers’adoption of intertemporal green agricultural technology. Resour. Sci., 42(6), 1123–1134. https://doi.org/10.18402/resci.2020.06.10[CrossRef]
Driving Competitiveness in Local Poultry Agribusiness: Evidence on Supply Chain Efficiency and Marketing Strategies from Banten Province, Indonesia · ResearchersLinks