Research Article · Volume 14, Issue 11, 22 October 2026 · Open Access
Date Waste and Whey in Broiler Diets: Effects on Growth, Feed Efficiency, and Water Intake in Algeria
· ·
Affiliations & Notes ⌄
- 1Department of Agronomic Sciences, Faculty of Sciences, University of M’Sila, Road Bourdj Bou-Arreridj, M’Sila 028 000, Algeria
- 2Laboratory of Genetics, Biotechnology, and Valorization of Bioresources (LGBVB), University of Biskra, Biskra 07 000, Algeria. *Correspondence | Aroussi Yazid, Department of Agronomic Sciences, Faculty of Sciences, University of M’Sila, Road Bourdj Bou-Arreridj, M’Sila 028 000, Algeria
- 3Email: yazid.aroussi@univ-msila.dz
Article Info ⌄
- Journal:
- Advances in Animal and Veterinary Sciences
- Published:
- 22 October 2026

From the article
- Adding date waste to the drinking water of broiler chickens is an effective way to optimise their feed intake.
- The group that received both whey and date waste (WH+DW) had the best feed conversion ratio (1.65) and consumed the least amount of feed (4 116.51 g per bird).
- This study examined the impact of adding date waste and whey to the diet of broiler chickens on their growth performance.
- Our results showed that combining these two by-products in the WH+DW diet reduced total feed intake by approximately 4 116 g, achieving an optimal feed conversion ratio of 1.65 with a significance level of p ˂ 0.001.
Selected from the article's own text.
Abstract
Introduction
Broiler poultry farming plays a strategic role in ensuring global food security. In 2022, over 140 million tonnes of poultry meat were produced, accounting for 38.8% of global meat production and establishing poultry as the primary source of animal protein consumed worldwide (FAO, 2023). The broiler poultry sector has become an important part of Algeria’s food supply. On average, people consume more than 15 kg of poultry per year, accounting for nearly half of their dietary animal protein intake. The industry produces an average of 340,000 tonnes of white meat and 4.8 billion eggs each year. It consists of 20,000 farmers, who together employ around 500,000 people . The global animal feed market is dominated by two raw materials that account for 60-70% of feed costs: corn (55-65% of the ration) and soybean meal (30-38%) ; ; . Algeria only meets 25 per cent of its own cereal requirements and relies on imports for the remaining 75 per cent. Consequently, the cost of these imports places a heavy burden on the state budget. In 1990, expenditure on cereals amounted to 824 million US dollars. This figure rose to 9.85 billion US dollars by 2011, 2.5 billion US dollars of which was spent on cereals such as maize and soya meal ; . This dependence exposes the sector to two major challenges: Reliance on foreign currency and high production costs (70%). In light of this vulnerability, utilising local by-products has become a national priority. Studies have demonstrated that maintaining acceptable levels of animal performance is possible by adjusting feed formulations, particularly with regard to amino acids and enzymes, thereby reducing the pressure on corn and soybean supplies ; ; . Significant potential substitutes include date waste by-products and whey. Algeria produces 1.2 million tonnes of dates each year, generating 20-25% waste in the form of sorting residues and pits. The Algerian dairy industry processes 3.5 billion litres of milk each year, producing 2.8 billion litres of whey in the process. This whey can be used in various sectors, particularly for animal feed.This by-product, which is often discarded, is rich in lactose and soluble proteins. When used in liquid, dehydrated, or fermented form, whey can help to improve gut flora and feed conversion ratios . Although some studies have examined the effects of these by-products individually, such as the study by Bara et al. (2021), which recorded increases in live weight of 162 g (20%), 82 g (30%) and 31 g (40%) after 48 days in all experimental groups where maize was replaced with date by-products at various levels. Furthermore, Raza et al. (2023) investigated the impact of varying levels of date by-product meal in broiler chicken feed. They discovered that chicks fed a diet comprising 9% dried dates exhibited a notably higher increase in live weight (p < 0.05) than the control group, little research has focused on their combined use in broiler chicken feed. This study is innovative in its integrated approach to evaluating the synergistic effects of these two by-products. It tests the hypothesis that dates, rich in vitamins A and B as well as minerals such as potassium, calcium, and iodine , could complement the mineral content of whey. Furthermore, the study determines the extent to which these by-products can replace corn and soybean meal in broiler chicken feed without compromising performance (growth and feed conversion ratio) or the economic profitability of poultry farming in Algeria.
Materials and Methods
Animals, diet and experimental protocol
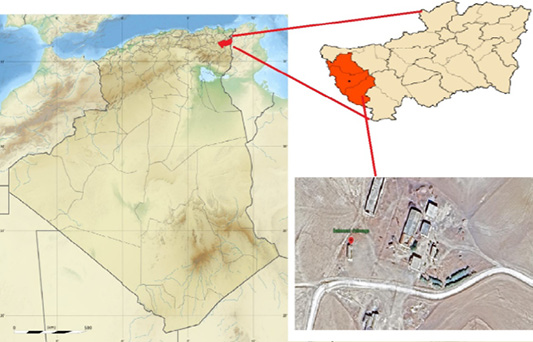
The experiment took place in the Mesabhia region, in the Bir-Bouhouche municipality, which is located in the Souk-Ahras wilaya (Figure 1). It was conducted in a 45 m² closed poultry equipped with static ventilation. The initial flock consisted of 377 one-day-old Hubbard Efficiency chicks, both male and female, weighing an average of 52 g each. After removing the nine chicks that had died during transport, the remaining 368 were randomly divided into four groups of 92 chicks each. To maintain an optimal temperature, each starter pen covered an area of 4 m². These were then gradually expanded each week by moving the partitions between the lots, reaching an area of approximately 10 m² per lot during the finishing phase. The bedding was made of a blend of chopped wheat straw and wood shavings that was 10 cm deep. During the cool season, it was changed as needed, especially in the vicinity of the waterers. During the first week, the ambient temperature was maintained at 32 °C, then reduced by 2 °C each week until reaching 22 °C at the 45 days mark. Lighting was provided for 24 hours a day during the first three days. From the fourth to the seventh day, we provided 23 hours of light, and from the seventh day onwards, we provided 18 hours of light. Access to water and feed was unrestricted. The chicks were vaccinated against Newcastle disease, Gumboro disease and infectious bronchitis, according to the programme below:
From the first day of life at the hatchery, a vaccine against infectious bronchitis is administered via eye drops using the Massachusetts strain (H120) to establish an initial immune barrier in the upper respiratory tract. A few days later, on day six, the primary Newcastle disease vaccination is carried out using a mild lentogenic strain of the Hitchner B1 type, administered by beak dipping. On day twelve, a vaccination against infectious bursal disease (Gumboro disease) is administered using an intermediate strain. A second Gumboro vaccination is given on the twenty-first day. At the same time, a booster dose against Newcastle disease is administered using a more immunogenic La Sota-type strain via the drinking water. Finally, a second vaccination against infectious bronchitis is given on day 21 to broaden the scope of protection.
The Deglet Nour date waste used in the experiment was sourced from palm groves in the Tolga region of the Biskra wilaya, in north-eastern Algeria. After sun-drying, the waste was ground using a hammer mill fitted with a 1 mm screen. A solution of water and 100 g of ground DW is prepared daily to prevent fermentation. The chemical composition of the Deglet Nour date waste is presented in Table 1.
Table 1: Chemical composition of date waste (% per kg of dry matter) .
|
Composition |
% |
|
Dry matter |
94.7 |
|
Crude protein |
3.69 |
|
Fat |
0.89 |
|
Minerals |
1.61 |
|
Starch |
10.2 |
|
Total sugar |
59 |
|
Fiber |
19.2 |
|
Feed Unit for Milk (FUM) |
1.05 |
|
Feed Unit for Meat (FUMe) |
0.97 |
Table 2: Chemical composition of whey powder (Kerry Group, 2021).
|
Composition |
Content |
|
Fat (g/100 g) |
1.0 |
|
Saturated fatty acids (g/100 g) |
0.7 |
|
Total carbohydrates (g/100 g) |
76.5 |
|
Protein (g/100 g) |
11.5 |
|
Salt (NaCl) (g/100 g) |
2.5 |
|
Sodium (mg/100 g) |
1 000.0 |
|
Ash (g/100 g) |
8.0 |
|
Energy (kcal /100 g) |
355.0 |
Although Algeria has been producing whey powder on a large scale since 2015, this sector is still in its infancy. Some industrial dairies and cheese factories have installed spray dryers to process whey produced during the manufacture of pressed cheeses. Some agri-food companies collect liquid whey from cooperatives, dry it, and then sell it to animal feed manufacturers. However, total production capacity remains insufficient to meet market demand, meaning we have had to use imported whey powder from the Kerry Group for our study. The chemical composition of sweet whey powder is shown in Table 2.
As part of this experiment, four feed formulas were developed using the WUFFDA software programme. This software uses Excel’s Solver function to solve feed formulation problems. Linear programming is employed to determine the most cost-effective solution. The diets were adapted according to the age of the animals.
The control group received a standard concentrate containing 51%, 55% and 60% maize for the starter, growth and finishing phases, respectively.
- The WH experimental group received a standard concentrate containing 5 per cent whey per kg, replacing 3 per cent maize, 1 per cent soya meal and 1 per cent wheat bran.
- The DW experimental group received a standard concentrate and drinking water in which 100 g/l of crushed date waste had been soaked.
- The WH+DW experimental group received a standard concentrate containing 5 per cent whey per kg of feed, as well as drinking water enriched with date waste.
The chemical composition and feed formulations are presented in Table 3.
The animals were weighed individually using an electronic scale with an accuracy of 5 g. This was done during the start-up and growth phases every ten days and again on the 45th day, at the end of the finishing phase. The amount of feed and water consumed by each group was measured daily. Food wastage is minimised by placing trays beneath the feeders to collect, weigh and deduct any food that falls. Water wastage is minimised through regular checks of the water troughs and inspection of the litter beneath them. The general condition of the chicks, as well as any abnormal clinical signs such as diarrhea, respiratory problems or locomotor disorders, was checked every day, as were any deaths.
Statistical analysis
Data on animal production performance (live weight, average daily gain, feed conversion ratio, and mortality rate) were entered into and analysed using SPSS version 26.0. First, a descriptive statistical analysis was conducted for each tested diet, including calculating means and standard deviations, to characterise the general trend in performance for the four types of feed formulated from local raw materials. To compare the effect of the feed type factor on growth parameters, a one-way analysis of variance (ANOVA, Type I) was performed. The Welch test was used to check for homogeneity. When the effect of the diet was significant at the 5% level (p < 0.05), means were compared using the Student-Newman-Keuls post-hoc test. The SNK test was then used to perform pairwise multiple comparisons of means and rank the four diets according to their effectiveness. This made it possible to evaluate the variation between the different local feed sources. The threshold for statistical significance was set at p < 0.05.
Table 3: Formulas (kg per 100 kg of feed) for starter feed (days 1-10), grower feed (days 11-40), and finisher feed (days 41-45).
|
Type of feed |
Starter |
Grower |
Finisher |
|||||||||
|
Groups |
Control |
WH |
WD |
WH+ DW |
Control |
WH |
WD |
WH+ DW |
Control |
WH |
DW |
WH+ DW |
|
Ingredients |
||||||||||||
|
Corn |
51 |
48 |
51 |
48 |
55 |
53 |
55 |
53 |
60 |
58 |
60 |
58 |
|
Soybean meal |
34 |
33 |
34 |
33 |
30 |
28 |
30 |
28 |
25 |
23 |
25 |
23 |
|
Wheat bran |
5 |
4 |
5 |
4 |
7 |
6 |
7 |
6 |
8 |
7 |
8 |
7 |
|
Vegetable oil |
2 |
2 |
2 |
2 |
3 |
3 |
3 |
3 |
3 |
3 |
3 |
3 |
|
Whey |
0 |
5 |
0 |
5 |
0 |
5 |
0 |
5 |
0 |
5 |
0 |
5 |
|
Calcium carbonate |
1 |
1 |
1 |
1 |
0.8 |
0.8 |
0.8 |
0.8 |
0.7 |
0.7 |
0.7 |
0.7 |
|
Dicalcium phosphate |
1.5 |
1.5 |
1.5 |
1.5 |
1.2 |
1.2 |
1.2 |
1.2 |
1.0 |
1.0 |
1.0 |
1.0 |
|
MVS |
5 |
5 |
5 |
5 |
4 |
4 |
4 |
4 |
3 |
3 |
3 |
3 |
|
L-Lysine |
0.25 |
0.25 |
0.25 |
0.25 |
0.20 |
0.20 |
0.20 |
0.20 |
0.18 |
0.18 |
0.18 |
0.18 |
|
DL-Methionine |
0.25 |
0.25 |
0.25 |
0.25 |
0.15 |
0.15 |
0.15 |
0.15 |
0.12 |
0.12 |
0.12 |
0.12 |
|
DW* (g/liter of water) |
0 |
0 |
100 |
100 |
0 |
0 |
100 |
100 |
0 |
0 |
100 |
100 |
|
Nutrients content as a percentage (%) of dry matter |
||||||||||||
|
ME Kcal/kg |
2 806.7 |
2 831.9 |
2 806.7 |
2 831.9 |
2 945.5 |
2 981.9 |
2 945.5 |
2 981.9 |
2 993.5 |
3 029.9 |
2 993.5 |
3 029.9 |
|
Crude protein |
20.8 |
20.6 |
20.8 |
20.6 |
19.6 |
18.9 |
19.6 |
18.9 |
17.8 |
17.2 |
17.8 |
17.2 |
|
Fat |
4.73 |
4.61 |
4.73 |
4.61 |
5.90 |
5.81 |
5.90 |
5.81 |
6.06 |
5.97 |
6.06 |
5.97 |
|
MM |
6.60 |
6.80 |
6.60 |
6.80 |
5.79 |
5.94 |
5.79 |
5.94 |
5.06 |
5.21 |
5.06 |
5.21 |
|
Crude fiber |
4.20 |
3.96 |
4.20 |
3.96 |
4.17 |
3.88 |
4.17 |
3.88 |
3.98 |
3.69 |
3.98 |
3.69 |
|
Lysine |
1.35 |
1.36 |
1.35 |
1.36 |
1.22 |
1.19 |
1.22 |
1.19 |
1.07 |
1.05 |
1.07 |
1.05 |
|
Methionine |
0.60 |
0.59 |
0.60 |
0.59 |
0.48 |
0.47 |
0.48 |
0.47 |
0.42 |
0.41 |
0.42 |
0.41 |
|
Calcium |
1.33 |
1.37 |
1.33 |
1.37 |
1.08 |
1.11 |
1.08 |
1.11 |
0.89 |
0.92 |
0.89 |
0.92 |
|
Phosphorus |
1.00 |
1.01 |
1.00 |
1.01 |
0.90 |
0.90 |
0.90 |
0.90 |
0.79 |
0.80 |
0.79 |
0.80 |
DW, Date waste powder; MVS, Mineral and vitamin supplements; ME, Metabolizable energy; WD, waste date; WH+DW, whey/ date waste; WH, whey; MM, Mineral material; DM, dry matter.
Results
Mortality
Just 2.38 per cent of the chicks died before the rearing process began. This may have been due to the stress they experienced while being transported. No nutritional or health problems were observed throughout the rearing period.
Growth trends
Throughout the entire rearing period, the DW group demonstrated the most consistent and highest growth performance, achieving the greatest live weight at almost every stage, except at 30 days, when the WH group had the highest weight (1,175.2 g). There was also an upward trend in its average daily gain (ADG) at each phase, and the group finished with the highest growth rate (58.5 g per day) at the end of the rearing period.
The WH+DW group exhibited a significant slowdown in growth between days 21 and 30 (average daily gain (ADG) of 50.27 g/d vs. 57.64 g/d in the control group; p < 0.001), achieving the lowest body weight on day 30 (1,080.4 g). This was followed by the highest ADG of all the groups between days 31 and 40 (87.24 g/day), which is consistent with compensatory growth. The final body weight on day 45 was not different to that of the control group. The WH group exhibited an initial advantage (days 11–30) that diminished during the growing-finishing phase. They had the lowest ADG (75.79 g/d) between days 31 and 40, and the lowest weight on days 40 and 45. At the end of the 45-day study, overall growth had progressed as follows: During the first ten days of the experiment, the DW (187.7 g) and WH+DW (186.9 g) groups experienced faster initial growth than the Control (182.7 g) and WH (181.4 g) groups. Similarly, the DW and WH+DW groups produced the highest average daily gains (p = 0.01): 13.6 g and 13.5 g, respectively, compared to 13.1 g for the Control group and 12.9 g for the WH treatment (Table 4).
During the growth period, the DW group remained in the lead after 20 days, with an average weight of 605.4 g. This was followed by the WH group (593.1 g) and the WH+DW group (577.6 g). The control group had the lowest weight of 564.3 g. The same trend was observed for the average daily gain (ADG). However, at 30 days, this trend reversed: the WH group had the highest weight (1 175.2 g) and had the best ADG (58.2 g/bird/day), while the WH+DW group had the lowest body weight and feed intake and the least favourable feed conversion ratio (FCR= 1.89) of all the groups in the trial over the 21–30 day period. This critical period may correspond to a transitional phase during which the gut microbiota adapt to the new combination of fermentable substrates provided by the whey and date by-products. It is thought that this adaptation may be linked to the period of post-vaccination stress generally observed in broiler chickens.
However, this slowdown was transient: between days 31 and 40, WH+DW achieved the best FCR (1.73) and the highest ADG (87.24 g/d) of all groups, consistent with compensatory growth, possibly linked to a digestive adaptation that was not directly assessed in this study. This recovery could be linked to a digestive and microbial adaptation to the whey–date combination, possibly with a prebiotic-like effect, but this hypothesis would require confirmation through microbiota and digestibility measurements. This continued until day 45, by which time there was no significant difference (p= 0,546) in weight between the WH+DW group (2 551.6 g) and the control group (2 566.5 g). This confirms that the initial deficit observed on day 30 had been fully compensated for. While this is a key finding, the authors do not report the p-value for this comparison. This indicates that the initial deficit observed on day 30 had been fully compensated for (Table 4).
At the end of the final phase (day 45), the DW group achieved the best results, reaching the highest final weight (2 626.5 g) (p < 0.001). The WH group, which performed well at 30 days, had the lowest weight (2 507.7 g) at 45 days.
The analysis of variance revealed that the factor under investigation had no effect on average live weight during the finishing phase (with a value below the conventional significance threshold of p = 0.054).
The control group (119.99 ± 31.7 g/day) and the WH+DW group (119.74 ± 38.3 g/day) showed intermediate values that were not significantly different (p = 0.054) from each other or from the two preceding groups.
In terms of effect size, the growth phases (ADG2, ADG3 and ADG4; days 10–40) exhibited large to very large effects (η²= 0.174, 0.246 and 0.414, respectively), indicating that diet has a strong influence on growth during these stages. The starter phase (ADG1) showed a small but significant effect (η² = 0.043).
The finisher phase (ADG5; 41–45 days) exhibited the smallest effect size (η² = 0.021). While the overall F-test was borderline significant (p = 0.054; η² = 0.021; small effect size), multiple pairwise comparisons (SNK and Tukey HSD; concordant results) revealed a significant difference between the WH and DW groups.
Table 4: Weight progression and weight gain according to diet (Mean ± SD).
|
Group |
Control |
WH |
DW |
WH+DW |
SEM |
P |
η² |
|
Starter |
|||||||
|
Initial weight (g) |
52 |
52 |
52 |
52 |
|||
|
Weight at 10 days (g) |
182.7 ± 13.4 a |
181.4 ± 7.54 a |
187.7 ± 14.1 b |
186.9 ± 14.2 b |
0.669 |
0.001 |
0.043 |
|
ADG 1-10 (g/bird/day) |
13.1 ± 1.34 a |
12.9 ± 0.75 a |
13.6 ± 1.4 b |
13.5 ± 1.41 b |
0.066 |
0.001 |
0.043 |
|
Grower |
|||||||
|
Weight at 20 j (g) |
564.3 ± 16.7 a |
593.1 ± 25.6 c |
605.4± 16.3 d |
577.6 ± 46.9 b |
1.72 |
<0.001 |
0.218 |
|
ADG 11-20 (g/bird/day) |
38.1 ± 2.06 a |
41.2 ± 2.49 b |
41.7 ± 2.42 b |
39.1± 4.97 a |
0.184 |
<0.001 |
0.174 |
|
Weight at 30 j (g) |
1 140.7 ± 60.9 b |
1 175.2 ± 27.6 c |
1 163.6 ± 47.6 c |
1 080.4 ± 28.4 a |
2.95 |
<0.001 |
0.424 |
|
ADG 21-30 (g/bird/day) |
57.6 ± 6.66 c |
58.2 ± 4.45 c |
55.8 ± 5.27 b |
50.2± 5.62 a |
0.332 |
<0.001 |
0.246 |
|
Weight at 40 j (g) |
1 966.5 ± 78.5 bc |
1 933.2 ± 76.6 a |
1 981.2 ± 75.6 c |
1 952.8 ± 66.1 ab |
3.96 |
<0.001 |
0.054 |
|
ADG 31-40 |
82.6± 9.86 b |
75.8± 8.46 a |
81.7 ± 8.24 b |
87.2 ± 6.49 c |
0.482 |
0.001 |
0.0414 |
|
ADG 11-40 (g/bird/day) |
59.5 ± 2.49 bc |
58.4 ± 2.51 a |
59.8 ± 2.82 c |
58.9 ± 2.53 ab |
0.137 |
0.001 |
0.197 |
|
Finisher |
|||||||
|
Weight at 45 j (g) |
2 566.5 ± 174.2b |
2 507.7 ± 135.5 a |
2 626.5 ± 181.5 c |
2 551.6 ± 174.5 ab |
8.96 |
<0.001 |
0.061 |
|
ADG 41-45 (g/bird/day) |
119.99 ± 31.7 |
114.9 ± 27.3 |
129.06± 42.1 |
119.74 ± 38.3 |
1.85 |
0.054 |
0.021 |
|
ADG 1-45 (g/bird/day) |
57.1 ± 3.95 b |
55.8 ± 3.07 a |
58.5 ± 4.12 c |
56.8 ± 3.96 ab |
0.203 |
<0.001 |
0.061 |
ADG, average daily gain; SEM, standard error of the mean; WH+DW, Whey/ date waste; WH, whey; DW, date waste. The présence of diferent letters on the same line indicates a significant difference between the treatment groups at p < 0,05. eta-squared: η²= Intergroup sum of squares/ Total sum of squares. Interpretation grid of η² (Cohen, 1988): ≈ 0.01 = small effect; ≈ 0.06 = medium effect; ≥ 0.14 = large effect.
The total ADG (ADG 1-45) reflects a moderate effect size (η² = 0.061), resulting from the combination of the previous phases (Table 4).
The smaller treatment effect observed during the finishing phase compared to the growing phase may reflect a convergence in performance towards the end of the rearing period. This is because the transient differences recorded earlier, notably the slowdown of the WH+DW group between days 21 and 30, were progressively attenuated. The high individual variability of ADG between days 41 and 45 likely contributed to this attenuation as well. The control and WH+DW groups occupied intermediate positions, not differing from either extreme (WH and DW). This reduces the between-group variance explained by the treatment but does not remove the difference between the two extreme groups.
The improvement in ADG observed in the DW group could be explained by the energy provided by the simple sugars contained in the date waste, as well as its mineral and antioxidant content, which are likely to improve health and digestive efficiency during the finishing phase. Total ADG (ADGT) reflects an average effect (η²= 0.061) resulting from the combination of preceding phases.

Feed intake and feed conversion ratio
Although the WH+DW group had the lowest feed intake across all rearing phases, this did not result in impaired growth. The final weight of this group (2 551.6 ± 174.5 g) was not significantly different to that of the control group. The overall feed conversion ratio (1.65 ± 0.119) was the most favourable in the trial and was statistically equivalent to that of the DW group. This combination of low feed intake and good feed conversion efficiency suggests that the reduction in feed intake observed in this group is more likely to be the result of compensatory energy regulation linked to the additional calorie intake provided by the drinking water enriched with sugars from dates and lactose from whey. This is in contrast to a reduction in appetite or food rejection, which would have resulted in a deterioration in the feed conversion ratio. The improvement in feed conversion ratio in the WH+DW group over the whole rearing period (1.65 vs 1.76 in the control), and particularly between days 31 and 40 (1.73 vs 1.99), followed a period of reduced efficiency between days 21 and 30 (1.89), consistent with a phase of digestive adaptation followed by compensatory growth. However, the DW group alone showed a comparable cumulative FCR (1.678), whereas WH did not differ from the control (1.75). These results suggest that the improved feed efficiency is mainly attributable to dates rather than to a synergistic effect of the combination, which cannot be claimed without testing the whey × dates interaction. Possible mechanisms (changes in caecal microbiota, lactose fermentation, effects of date fibre and polyphenols on digestibility) remain hypotheses requiring digestibility, caecal pH and volatile fatty acid measurements. A significant hierarchy in cumulative feed consumption emerged (p < 0.001): Control (4 412.78 g) > WH (4 301.46 g) > DW (4 299.81 g) > WH+DW (4 116.51 g). The DW and WH+DW groups were the most efficient at converting feed into body weight (Table 5).
However, the whey (WH) treatment resulted in a low feed conversion ratio (FCR) of 1.6 during the finishing phase, with no significant difference. At the end of the rearing cycle, the FCR was statistically similar to that of the control treatment (1.76), at 1.75. This suggests that an overall efficiency improvement is not significantly greater with a whey-containing diet than with a maize-containing diet.
The diet clearly influences the feed conversion ratio throughout the cycle (days 1–40), with the strongest effect observed between days 11 and 40 (η² = 0.300). However, this effect disappears completely towards the end of the rearing period (days 41–45), when the four groups converge towards a comparable feed conversion ratio. This is consistent with the diet’s effect already being attenuated for average daily gain (ADG) during the finishing phase.
Water consumption
Water consumption has followed three main trends. First, it increases with age, in parallel with body weight and food consumption. It also depends on the watering system and how well it is maintained. Finally, it varies according to diet and treatment. As the subjects age, the volume of water ingested increases steadily and significantly. For example, in the Control group, consumption increased from 759.92 ml during the starter phase (days 1-10) to 3 425.8 ml by the end of the growth phase (days 31–40). Although the total volume increases, the ratio of water consumed to food intake (FI) decreases overall, indicating more efficient water use in relation to solid food intake. This trend can be broken down into three phases : During the starter phase (days 1-10), efficiency is at its lowest, with high ratios (between 2.91 and 3.78), as a large amount of water is consumed relative to the small amount of food ingested. During the growth phase (days 11-40), efficiency improves steadily, with the water/feed ratio gradually decreasing (for example, from 2.53 to 2.11 for the Control group) (Table 6). This trend then reverses slightly or stabilises during the final five days of the cycle, with a slight increase in the ratio (returning to 2.27 for the control group).
Table 5: Changes in feed intake and conversion index according to diet (Mean ± SD).
|
Group |
Control |
WH |
DW |
WH+DW |
SEM |
P |
η² |
|
Feed intake (g) |
|||||||
|
Starter |
|||||||
|
01-10 days |
246.46 c |
236.45 b |
247.50 d |
226.42 a |
0.447 |
<0.001 |
|
|
Grower |
|||||||
|
11-20 days |
607.14 b |
680.28 d |
638.32 c |
576.10 a |
2.02 |
<0.001 |
|
|
21-30 days |
1 043.65 d |
1 016.93 c |
985.02 b |
939.37 a |
2.03 |
<0.001 |
|
|
31-40 days |
1 620.87 d |
1 499.12 b |
1 541.36 c |
1 498.16 a |
2.59 |
<0.001 |
|
|
11-40 days |
3 271.66 d |
3 196.33 a |
3 164.71 b |
3 013.63 a |
4.91 |
<0.001 |
|
|
Finisher |
|||||||
|
41-45 days |
894.65 d |
868.67 a |
887.59 c |
876.46 b |
0.52 |
<0.001 |
|
|
01-45 days |
4 412.78 d |
4 301.46 c |
4 299.81b |
4 116.51 a |
5.56 |
<0.001 |
|
|
Consumption index |
|||||||
|
Starter |
|||||||
|
01-10 days |
1.91 ± 0.19 c |
1.83± 0.109 b |
1.84 ± 0.209 b |
1.69 ± 0.16 a |
0.009 |
<0.001 |
0.1616 |
|
Grower |
|||||||
|
11-20 days |
1.59 ± 0.086 c |
1.66 ± 0.099 d |
1.53 ± 0.087 b |
1.49 ± 0.179 a |
0.007 |
<0.001 |
0.2119 |
|
21-30 days |
1.84 ± 0.217 b |
1.76± 0.138 a |
1.78 ± 0.159 a |
1.89 ± 0.214 c |
0.01 |
<0.001 |
0.0750 |
|
31-40 days |
1.99 ± 0.233 c |
2.0 ± 0.230 c |
1.90 ± 0.189 b |
1.73 ± 0.13 a |
0.011 |
<0.001 |
0.2372 |
|
11-40 days |
1.83 c |
1.82 c |
1.76 b |
1.71 a |
0.004 |
<0.001 |
0.3001 |
|
Finisher |
|||||||
|
41-45 days |
1.61 ± 0.48 |
1.60 ± 0.4 |
1.68 ± 1.18 |
1.67 ± 0.72 |
0.039 |
0.846 |
0.0022 |
|
01-45 days |
1.76 ± 0.124 b |
1.75 ± 0.09 b |
1.678 ± 0.121 a |
1.65 ± 0.119 a |
0.006 |
<0.001 |
0.1443 |
WH+DW, whey/ date waste; SEM, standard error of the mean; WH, whey; DW, Date waste. The présence of diferent letters on the same line indicates a significant difference between the treatment groups at p < 0,05. eta-squared: η² = Intergroup sum of squares/ Total sum of squares. Interpretation grid of η² (Cohen, 1988): ≈ 0.01 = small effect; ≈ 0.06 = medium effect; ≥ 0.14 = large effect.
The physiological decrease in the water-to-feed ratio in broiler chickens as they age is a well-established phenomenon. This is due to the gradual maturation of thermoregulation, which reduces dependence on evaporative cooling, and to the maturation of the kidneys’ ability to concentrate urine, which reduces the volume of urine required to excrete nitrogenous waste. Changes in weight composition also play a role. During the finishing phase, the proportion of adipose tissue in body weight increases while body water content decreases . As fat contains less water than the muscle and viscera formed during the starter phase, water requirement per unit of body weight tends to decline with age, which may contribute to the lower water intake relative to body weight in this phase.
Unlike the WH+DW group, the DW-only group exhibited a water-to-feed ratio of 2.328. This was comparable to the control group’s ratio (2.326), despite the high content of simple sugars in the date waste. The absence of excessive water intake in this group can be explained by the type of sugars provided by the dates, mainly glucose and fructose. These sugars are absorbed by specific intestinal transporters, namely SGLT1 for glucose and galactose and GLUT5 for fructose ; , although fructose uptake is less efficient than glucose uptake in chicks. This limits their residual osmotic load. Lactose in whey is poorly digestible in chickens because of the very low lactase activity of the small intestine ; undigested lactose is fermented in the caeca by the microbiota, which may give it a prebiotic effect at low inclusion levels but increase excreta moisture at high levels . It remains in the intestinal lumen for longer, exerting a prolonged osmotic effect and potentially being fermented by the caecal microbiota. This can account for the higher water intake and water-to-feed ratio observed in groups receiving whey (WH and WH+DW). These results suggest that the increase in the water-to-feed ratio in the WH+DW group is primarily due to the whey fraction in the mixture rather than the date waste.
Table 6: Water intake (ml) and water/feed intake ratio according to diet.
|
Groups |
Control |
WH |
DW |
WH+DW |
SEM |
P |
|
Water intake |
||||||
|
Starter |
||||||
|
01-10 days |
759.92 b |
843.29 c |
720.29 a |
856.48 d |
2.97 |
<0.001 |
|
Grower |
||||||
|
11-20 days |
1 540.62 a |
1 644.89 c |
1 590.62 b |
1 759.79d |
4.26 |
<0.001 |
|
21-30 days |
2 502.54 c |
2 492.86 b |
2 412.50 a |
2 553.41d |
2.64 |
<0.001 |
|
31-40 days |
3 425.80 d |
3 403.91 c |
3 307.42 a |
3 389.58 b |
2.32 |
<0.001 |
|
11-40 days |
7 468.97 b |
7 541.66 c |
7 310.54 a |
7 702.79 d |
7.38 |
<0.001 |
|
Finisher |
||||||
|
41-45 days |
2 037.40 d |
2 000.18 c |
1 982.66 b |
1 981.71 a |
1.17 |
<0.001 |
|
01-45 days |
10 266.29 b |
10 385.14 c |
10 013.50 a |
10 540.98 d |
10.1 |
<0.001 |
|
Drinking efficiency index = Water/feed intake (ml/g) |
||||||
|
Starter |
||||||
|
01-10 days |
3.083 b |
3.566 c |
2.91 a |
3.78 d |
0.018 |
<0.001 |
|
Grower |
||||||
|
11-20 days |
2.53 c |
2.42 a |
2.491 b |
3.05 d |
0.013 |
<0.001 |
|
21-30 days |
2.38 a |
2.45 c |
2.45 b |
2.72 d |
0.006 |
<0.001 |
|
31-40 days |
2.11 a |
2.27 d |
2.15 b |
2.26 c |
0.003 |
<0.001 |
|
11-40 days |
2.27 a |
2.35 c |
2.31 b |
2.55 d |
0.005 |
<0.001 |
|
Finisher |
||||||
|
41-45 days |
2.28 c |
2.30 d |
2.23 a |
2.26 b |
0.001 |
<0.001 |
|
01-45 days |
2.326 a |
2.41 c |
2.328 b |
2.56 d |
0.005 |
<0.001 |
WH+DW, whey/date waste; SEM, standard error of the mean; WH, whey; DW, date waste. The présence of diferent letters on the same line indicates a significant difference between the treatment groups at p < 0.05.
The WH+DW group had the highest water intake (10,540.98 ml) and water-to-feed ratio (2.56) of all the groups in the trial, which were both higher than the values usually reported for broiler chickens under thermoneutral conditions (1.6–2.0). This increase could be attributed to the high osmotic load resulting from date by-products being soaked in the drinking water, which caused the chickens to drink more water to compensate. However, the absence of any adverse effects on final body weight, coupled with the most favourable feed conversion ratio in the trial for this group, suggests that this increase in water intake is a physiological adaptation mechanism rather than indicating a harmful osmotic imbalance.
Discussion
The steady growth of the DW Group’s chickens, which are fed dates soaked in their drinking water, demonstrates accelerated weight gain and a high yield.These results are broadly consistent with those of Kadhim et al. (2019), who reported significant improvements in the growth performance of broiler chickens that received date molasses and/or ascorbic acid, and with those of Goharrizi et al. (2020), who demonstrated significant improvements in weight gain over time in chickens that received date waste vinegar in their drinking water. However, there was no significant effect on the feed conversion ratio.
While these studies reported the beneficial effects of processed date by-products (molasses and vinegar) on the growth performance of broiler chickens, it is important to emphasise that these forms differ fundamentally from the raw date waste used in the present study. Molasses, which is concentrated in simple sugars (50–60%), is mainly regarded as a source of rapid energy , whereas vinegar, a fermentation product rich in acetic acid, is generally considered to act by acidifying the digestive tract and limiting the growth of pathogenic bacteria ; , although results in drinking water are not consistent across studies. Conversely, raw date waste retains the entire fibrous and polyphenolic matrix of the fruit, suggesting a mode of action oriented more towards prebiotic effects through colonic fermentation and antioxidant activity. Despite their potentially distinct mechanisms, the convergence of positive effects observed across these different forms of date valorisation nevertheless reinforces the overall relevance of date by-products as promising natural additives in poultry feed. However, direct comparative studies between raw and processed forms are needed to identify the most effective valorisation method.
Although our study did not directly measure the composition of the gut microbiota or short-chain fatty acids, the improvement in growth performance and feed conversion ratio observed with date by-products is consistent with a potential prebiotic effect. The studies by Alhomsi and Kılıç Bayraktar (2025) and Bamigbade et al. (2022, 2024) collectively demonstrate that date by-products-specifically their polysaccharides- exert prebiotic effects by selectively stimulating beneficial gut bacteria and increasing the production of health-promoting metabolites, particularly short-chain fatty acids (SCFAs). In broiler chickens, the addition of degraded date stones reduced total bacterial populations and those of several pathogens , but these effects have yet to be confirmed for date waste added to drinking water. However, this mechanistic hypothesis would benefit from being confirmed through further microbiological and biochemical analyses (e.g. caecal bacterial count, short-chain fatty acid assay and intestinal histomorphology) in future studies.
Adding date waste to the drinking water of broiler chickens is an effective way to optimise their feed intake. Al-Ramamneh and Alanzi (2022) found that adding 1% date syrup to the drinking water of broiler chickens during the first three weeks of life increased their feed intake. Increasing the amount of date syrup to 4% improves feed conversion efficiency, resulting in higher body weights at six weeks of age.
The WH group demonstrated optimal growth performance during the starter and grower phases (days 20–30), but the poorest performance during the late grower and finisher phases (days 40–45). This reversal could be explained by a physiological decline in intestinal lactase activity in ageing chickens, leading to progressive lactose malabsorption from whey. This results in excessive intestinal fermentation and an adverse osmotic effect on digestion, limiting nutrient absorption at the end of the growth cycle. Interestingly, adding date waste (the WH+DW group) mitigated this negative effect. Animals in this group showed intermediate performance at 45 days, suggesting that the prebiotic and antioxidant compounds in dates may protect against or compensate for the negative effects of whey on digestive tolerance.
Several studies have confirmed that the effect of whey on broiler chickens is both dose-dependent and non-linear, reaching a tipping point beyond a certain threshold. Tsiouris et al. (2020) demonstrated that supplementing the diet with 1% or 2% whey significantly increased body weight, whereas supplementing the diet with 5% whey significantly decreased it.
The DW treatment also had the highest drinking efficiency index (Water/feed intake (ml/g)) (2.328), which explains why dates alone do not stimulate thirst as much as whey alone (WH : 2.41) or in whey in combination with date waste (WH+DW: 2.56). Aggrey et al. (2023) report that chickens consume approximately 1.6 to 2.0 times more water than feed. However, these values vary depending on several factors, such as the composition of the water and feed, according to Ebrahimi et al. (2024) and Raut et al. (2025). Higher water intake and a higher water-to-feed ratio are generally associated with excess salts in both the feed and the water, as well as ambient heat. These factors may explain the lower water efficiency observed in the WH+DW group. Higher nitrogen intake leads to increased excretion of nitrogen in the form of uric acid, consequently raising water requirements ; . This could explain the higher water-to-feed ratio observed in the WH+DW group. When combined with date waste, simple sugars such as glucose and fructose are rapidly absorbed, causing a spike in blood glucose levels that results in moderate thirst, while soluble fibers (pectins, β-glucans, arabinoxylans) significantly increase the viscosity of intestinal contents by retaining water and slowing transit, which induces a sensation of thirst ; .
From an economic standpoint, the diet combining 5% whey powder and 100 g of date waste per liter offers the best growth performance. Feed intake is lowest (4 116 g) and the feed conversion ratio is optimal (1.65) throughout the entire rearing period. The whey/date waste combination was therefore advantageous after 45 days. Pineda-Quiroga et al. (2018) found that adding 60 g of dehydrated whey powder per kilogram of feed promoted growth and feed efficiency in broiler chickens from the earliest stages of their development. They also found that these dietary supplements improve the digestibility of calcium and phosphorus in the ileum, positively affecting intestinal health. These findings corroborate those of Tsiouris et al. (2019), who reported a beneficial effect of whey on growth at low doses (generally between 1% and 2%) but a decrease in its effectiveness at higher doses. The group that received both whey and date waste (WH+DW) had the best feed conversion ratio (1.65) and consumed the least amount of feed (4 116.51 g per bird). Meanwhile, the group that received only date waste achieved the highest live weight (2 626.5 g) and average daily weight gain (58.5 g per day). This feed efficiency may reflect a complementary relationship between the two by-products. Administering date waste in drinking water provides rapidly available sugars and fibre, which may exert a prebiotic effect. This is consistent with the effects of date-based sugar water on feed efficiency reported by Al-Ramamneh and Alanzi (2022). Whey powder provides easily digestible protein and may improve the ileal digestibility of calcium and modulate the caecal microbiota . However, the WH+DW group had the least favourable water-to-feed ratio (2.55), reflecting the mineral content of the whey, and this represents a trade-off that should be considered.
The results of this study confirm those of Ashour et al. (2019), Pineda-Quiroga et al. (2018), and Fallah (2016). These studies demonstrated that improving the feed conversion ratio in broiler chickens is possible by incorporating whey into their diets in a controlled manner. This dairy by-product is a source of nutrients, including lactose, minerals and protein ; , and its inclusion at moderate levels has been associated with improved weight gain and feed conversion ratio in broiler chickens , which could reduce feed costs and optimise the use of local agricultural resources. However, its use remains limited due to by its high lactose and mineral content . Furthermore, Gulsen et al. (2002) demonstrated that adding 38.5 g/kg of whey powder as a lactose source to diets for the growth and finishing phases of broiler chickens increased body weight. Additionally, Shariatmadari and Forbes (2005) emphasised that the impact of whey depends heavily on its method of administration.
Conclusion
This study examined the impact of adding date waste and whey to the diet of broiler chickens on their growth performance. Our results showed that combining these two by-products in the WH+DW diet reduced total feed intake by approximately 4 116 g, achieving an optimal feed conversion ratio of 1.65 with a significance level of p ˂ 0.001. This diet is therefore the most effective and promising from an economic perspective. Furthermore, using dates alone in the DW treatment was effective, as evidenced by the highest final live weight (2 626 g) and average daily weight gain (58.5 g per bird per day) recorded, with a significance level of p ˂ 0.001. This study has demonstrated that combining these two by-products strategically yields very satisfactory results. The whey inclusion (WH+DW) rate was 5 per cent, contrasting with previous studies’ recommendations for whey alone, which suggested an inclusion threshold of 1–2 per cent. In light of these results, various alternative, local, and inexpensive food sources could be prioritised within the national economy by disseminating information and encouraging their production and/or recycling. This would promote the ‘livestock production’ sector and reduce import costs to some extent. Based on the findings of this study, we recommend further investigating the effectiveness of administering whey to monogastric animals in wet form or as a drink.
Acknowledgement
The authors would like to thank the staff at the El Baraka livestock feed manufacturing unit in Oum El Adaime, Souk Ahras, for their contribution to this study.
Novelty Statement
This study is the first to explore the synergistic effects of supplementing the diet of broiler chickens with whey protein, sugars, fiber, and phenolic compounds derived from whole date waste.
Author’s Contribution
All of the authors contributed to the study’s protocol and design. AY prepared the materials and collected the data. BY wrote the initial draft of the manuscript. BA performed the statistical analysis. All authors approved the final version of the manuscript.
Ethical approval
Ethical approval for the study was granted by the Animal Care and Use Committee of the Laboratory of Genetics, Biotechnology and Valorization of Bioresources (LGBVB) at the University of Biskra (approval no. 03/2023).
Generative AI and AI assisted technology statement
The authors declare that no generative AI and AI assisted technology was used in the creation of this manuscript.
Conflict of interest
The authors have declared no conflict of interest.
Figures

The location of the experimental site in the wilaya wilaya of Souk-Ahras.
References
- Abdelgader M, Haren HIH, Ismoyowati and Iriyanti N (2019). Effect of beet molasses as a source of energy on performance of broiler chickens. IOP Conf. Ser. Earth Environ. Sci., 372: 012041. https://doi.org/10.1088/1755-1315/372/1/012041[CrossRef]
- Acar MC, Türkekul B, Karahan UÖ, Özkan S, Yalcin S (2024). Effects of partial replacement of soybean with local alternative sources on growth, blood parameters, welfare, and economic indicators of local and commercial broilers. Animals, 14: 314. https://doi.org/10.3390/ani14020314[CrossRef]
- Aggrey S, Ghareeb A, Milfort M, Ariyo O, Aryal B, Hartono E, Kwakye J, Sovi S, Hipple S, Stevenson C, Fuller A, Sabry M, Stino F, Rekaya R (2023). Quantitative and molecular aspects of water intake in meat-type chickens. Poult. Sci., 102(11). https://doi.org/10.1016/j.psj.2023.102973[CrossRef]
- Alfonso-Avila AR, Cirot O, Lambert W, Létourneau-Montminy MP (2022). Effect of low-protein corn and soybean meal-based diets on nitrogen utilization, litter quality, and water consumption in broiler chicken production: insight from meta-analysis. Animal, 16(3): 100458. https://doi.org/10.1016/j.animal.2022.100458[CrossRef]
- Alhomsi A, Bayraktar M (2025). Prebiotic properties of dates and their impact on health. Turk. J. Agric. Food Sci. Technol., 13(1): 229–236. https://doi.org/10.24925/turjaf.v13i1.229-236.7148[CrossRef]
- Alloui N, Bennoune O (2013). Poultry production in Algeria: Current situation and future prospects. World’s Poult. Sci. J., 69(3): 613–620. https://doi.org/10.21608/jappmu.2013.71641[CrossRef]
- Alloui N, Sellaoui S, Ayachi A, Bennoune O (2021). Evaluation of biosecurity practices in a laying hens farm using BiocheckUGent. Multidiscipl. Rev., 3(3). https://doi.org/10.29327/multiscience.2021014[CrossRef]
- Al-Ramamneh D, Alanzi B (2022). Effect of date syrup “Dibs” on some performance, behavioural indicators in broiler chickens raised under Saudi Arabia conditions. Russ. Agric. Sci., 48: 309–315. https://doi.org/10.3103/S1068367422040024[CrossRef]
- Alyileili SR, Belal IEH, Hussein AS, El-Tarabily KA (2020). Effect of inclusion of degraded and non-degraded date pits in broilers’ diet on their intestinal microbiota and growth performance. Animals, 10(11): 2041. https://doi.org/10.3390/ani10112041[CrossRef]
- Ashour EA, Abd El-Hack ME, Alagawany M, Swelum AA, Osman AO, Saadeldin IM, Abdel-Hamid M, Hussein El-Sayed OS (2019). Use of whey protein concentrates in broiler diets. J. Appl. Poult. Res., 28(4). 1078-1088. https://doi.org/10.3382/japr/pfz070[CrossRef]
- Baa A, Bara Y, Mammeri A, Attir B, Garti F (2025). Effets d’incorporation des rebuts de dattes et du lactosérum sur les performances de croissance et l’évolution corporelle des agneaux Rembi (Algérie). Biotechnol. Agron. Soc. Environ., 29(3): 172-180. https://doi.org/10.25518/1780-4507.21294[CrossRef]
- Bamigbade G, Subhash A, Kamal-Eldin A, Nyström L, Ayyash M (2022). An updated review on prebiotics: Insights on potentials of food seeds waste as source of potential prebiotics. Molecules, 27. https://doi.org/10.3390/molecules27185947[CrossRef]
- Bamigbade GB, Subhash AJ, Al-Ramadi B, Kamal-Eldin A, Gan RY, Liu SQ, Ayyash M (2024). Gut microbiota modulation, prebiotic and bioactive characteristics of date pomace polysaccharides extracted by microwave-assisted deep eutectic solvent. Int. J. Biol. Macromol., 262(Pt 2): 130167. https://doi.org/10.1016/j.ijbiomac.2024.130167[CrossRef]
- Bara Y, Arbouche R, Arbouche Y, Montaigne E, Baa A, Arbouche F (2021). Date scraps and rumen content extract in broiler feed: Effects on growth performances, carcass yields, meat quality and economic efficiency. Adv. Res. Life Sci., 5: 55–63. https://doi.org/10.2478/arls-2021-0030[CrossRef]
- Beal C, Robinson D, Smith J, Van Doren L, Tabler G, Rochell S, Kidd M, Bottje W, Lei X (2023). Economic and environmental assessment of U.S. broiler production: Opportunities to improve sustainability. Poult. Sci., 102: 102887. https://doi.org/10.1016/j.psj.2023.102887[CrossRef]
- Borges SA, Ariki J, Jerônimo R, Martins CL, Moraes VMB (1998). Níveis de cloreto de sódio em rações para frangos de corte. Arquivo Brasil. Med. Vet. Zoot., 50(5): 619–624. http://hdl.handle.net/11449/219287
- Caldas JV, Boonsinchai N, Wang J, England JA, Coon CN (2019). The dynamics of body composition and body energy content in broilers. Poult. Sci., 98(2): 866-877. https://doi.org/10.3382/ps/pey422[CrossRef]
- Dongare N, Deshmukh A, Dhok A, Lende S, Taksande P (2017). Supplementation of protease and xylanase enzymes in broiler diet with varying energy and protein levels. Int. J. Curr. Microbiol. Appl. Sci., 6: 1715-1720. https://doi.org/10.20546/ijcmas.2017.611.207[CrossRef]
- Dorado-Montenegro S, Habibi M, Gerrits W, De Vries S (2024). Effect of adding soluble viscous fibers to diets containing coarse and finely ground insoluble fibers on digesta transit behavior and nutrient digestibility in broiler chickens. Poult. Sci., 103. https://doi.org/10.1016/j.psj.2024.103487[CrossRef]
- Ebrahimi N, Nobakht A, İnci H, Palangi V, Suplata M, Lackner M (2024). Drinking water quality management for broiler performance and carcass characteristics. World, 5(4): 952-961. https://doi.org/10.3390/world5040048[CrossRef]
- Fallah R (2016). Productive performance, carcass trait and blood parameters of broiler chickens fed different levels of dried whey and protexin probiotic. Int. J. Basic Res., 4: 240-247.
- FAO (2023). Food outlook biannual report on global food markets. Rome. https://openknowledge.fao.org/server/api/core/bitstreams/924989b4-5647-4942-bc0f-077b912c88ce/content
- Garriga C, Barfull A, Planas JK (2004). Characterization of apical d-fructose transport in chicken Jejunum. J. Membrane Biol., 197: 71–76. https://doi.org/10.1007/s00232-003-0640-0[CrossRef]
- Goharrizi LY, Tasharo S, Mohammadi F (2020). Pathogen control, and digestion and immunity development in broilers by supplementing drinkable water with waste date vinegar. Res. J. Vet. Practit., 8(3): 29-36. https://doi.org/10.17582/journal.rjvp/2020/8.3.29.36[Full text][CrossRef]
- Gülşen N, Coşkun B, Umucalilar HD, İnal F, Boydak M (2002). Effect of lactose and dried whey supplementation on growth performance and histology of the immune system in broilers. Arch. Für Tierernaehrung, 56(2): 131–139. https://doi.org/10.1080/00039420214186[CrossRef]
- Hernández F, López M, Martínez S, Megías MD, Catalá P, Madrid J (2012). Effect of low-protein diets and single sex on production performance, plasma metabolites, digestibility, and nitrogen excretion in 1- to 48-day-old broilers. Poult Sci. 91(3):683-92. https://doi.org/10.3382/ps.2011-01735[CrossRef]
- Hussar P, Popovska-Percinic F, Blagoevska K, Järveots T, Dūrītis I (2020). Immunohistochemical study of glucose transporter GLUT-5 in duodenal epithelium in norm and in T-2 mycotoxicosis. Foods, 9(7): 849. https://doi.org/10.3390/foods9070849[CrossRef]
- Javed S, Khose K, Nikam M, Wankhede S, Rindhe S, Waghamare R (2025). Comparative study of rapeseed meal and fermented rapeseed meal replacing soybean meal in diet on growth performance, nutrient digestibility and economics in broiler chicken. Asian J. Dairy Food Res., 10: 18805. https://doi.org/10.18805/ajdfr.DR-2258[CrossRef]
- Kadhim M, Shammari K, Ulsagheer M, Rmul M (2019). Effect of addition date molasses or/and ascorbic acid with/without feeding method in some productive performance of broiler chickens Ross 308. J. Phys. Conf. Ser., 1294: 092012. https://doi.org/10.1088/1742-6596/1294/9/092012[CrossRef]
- Kerry Group (2021). Sweet whey powder-nutritional information. Kerry Dairy Ingredients, 2021.
- Khempaka S, Molee W, Guillaume M (2009). Effect of dried whey on growth performance of broiler chickens. Trop. Anim. Health Prod., 41(7): 1417-1423.
- Mozdziak PE, Pophal S, Borwornpinyo S, Petitte JN (2003). Transgenic chickens expressing β-galactosidase hydrolyze lactose in the intestine. J. Nutr., 133(10): 3076-3079. https://doi.org/10.1093/jn/133.10.3076[CrossRef]
- ONAB (2022). Rapport annuel sur la filière avicole en Algérie. Office National des Aliments du Bétail. Alger.
- Paraskeuas VV, Papadomichelakis G, Brouklogiannis IP, Anagnostopoulos EC, Pappas AC, Simitzis P, Theodorou G, Politis I, Mountzouris KC (2023). Dietary Inclusion level effects of yoghurt acid whey powder on performance, digestibility of nutrients and meat quality of broilers. Animals (Basel), 13(19): 3096. https://doi.org/10.3390/ani13193096[CrossRef]
- Pineda-Quiroga C, Camarinha-Silva A, Borda-Molina D, Atxaerandio R, Ruiz R, García-Rodríguez A (2018). Feeding broilers with dry whey powder and whey protein concentrate affected productive performance, ileal digestibility of nutrients and cecal microbiota community. Anim. Consortium, 2017. 12(4): 692–700. https://doi.org/10.1017/S1751731117002208[CrossRef]
- Raut R, Biswas B, Taylor-Bowden T, Kilonzo-Nthenge A, Pokharel B, Tabler T, Nahashon S, Maharjan P (2025). Effects of chronic exposure of specific water quality parameters in poultry drinking water on dietary amino acid digestibility and early broiler performance. Poult. Sci., 104(2). https://doi.org/10.1016/j.psj.2025.104835[CrossRef]
- Raza MH, Tahir M, Naz S, Alhidary I, Khan R, Losacco C, Tufarelli V (2023). Dried date (Phoenix dactylifera L.) meal inclusion in the diets of broilers affects growth performance, carcass traits, nutrients digestibility, fecal microbiota and economics. Agriculture, 13(10): 1978. https://doi.org/10.3390/agriculture13101978[CrossRef]
- Seidavi AR, Azizi M, Ragni M, Laudadio V, Tufarelli V (2018). Practical applications of agricultural wastes in poultry feeding in mediterranean and middle east regions. Part 2: Tomato, Olive, Date, Sunflower Wastes. World’s Poult. Sci. J., 74(3): 443–452. https://doi.org/10.1017/S004393391800051X[CrossRef]
- Shariatmadari F, Forbes JM (2005). Performance of broiler chickens given whey in the food and/or drinking water. Br. Poult. Sci., 46(4): 498-505. https://doi.org/10.1080/00071660500190900[CrossRef]
- Sugiharto S, Adli DN, Ujilestari T, Sholikin MM, Inggrida JA (2025). Does the use of whey protein in broiler chicken diets have a positive effect? Model-based meta-analysis. J. Agric. Sci., 163(4): 403–425. https://doi.org/10.1017/S0021859625100130[CrossRef]
- Szuba-Trznadel A, Rząsa A, Lazar A, Janusz I, Kamińska J, Hikawczuk T, Jama-Rodzeńska A, Król Z, Przybylski P, Fuchs B (2025). Evaluating high-protein wheat as a protein source for broiler chicken. Sci. Rep., 15: 31896. https://doi.org/10.1038/s41598-025-17803-7[CrossRef]
- Tasharofi S, Goharrizi LY, Mohammadi F (2017). Effects of dietary supplementation of waste date’s vinegar on performance and improvement of digestive tract in broiler chicks. Vet. Res. Forum, 8(2): 127-132.
- Tebache D (2022). Russo-Ukrainian crisis and instability of the cereal market (case of wheat); What impact on the Algerian economy? (Theoretical approach). ASJP. https://www.asjp.cerist.dz/index.php/en/article/200831
- Tsiouris V, Economou E, Lazou T, Georgopoulou I, Sossidou E (2019). The role of whey on the performance and campylobacteriosis in broiler chicks. Poult. Sci., 98(1): 236-243. https://doi.org/10.3382/ps/pey388[CrossRef]
- Tsiouris V, Kontominas MG, Filioussis G, Chalvatzi S, Giannenas I, Papadopoulos G, Koutoulis K, Fortomaris P, Georgopoulou I (2020). The effect of whey on performance, gut health and bone morphology parameters in broiler chicks. Foods, 9(5): 588. https://doi.org/10.3390/foods9050588[CrossRef]
- Vivares G, De Nanclares M, Conde-Aguilera A, De Vries S (2025). Quantifying the interactions between dietary fibers and macronutrient digestibility in broiler chickens: The importance of considering fiber solubility. Anim. Feed Sci. Technol., 321: 116241. https://doi.org/10.1016/j.anifeedsci.2025.116241[CrossRef]
Services
Article usage statistics
Loading…