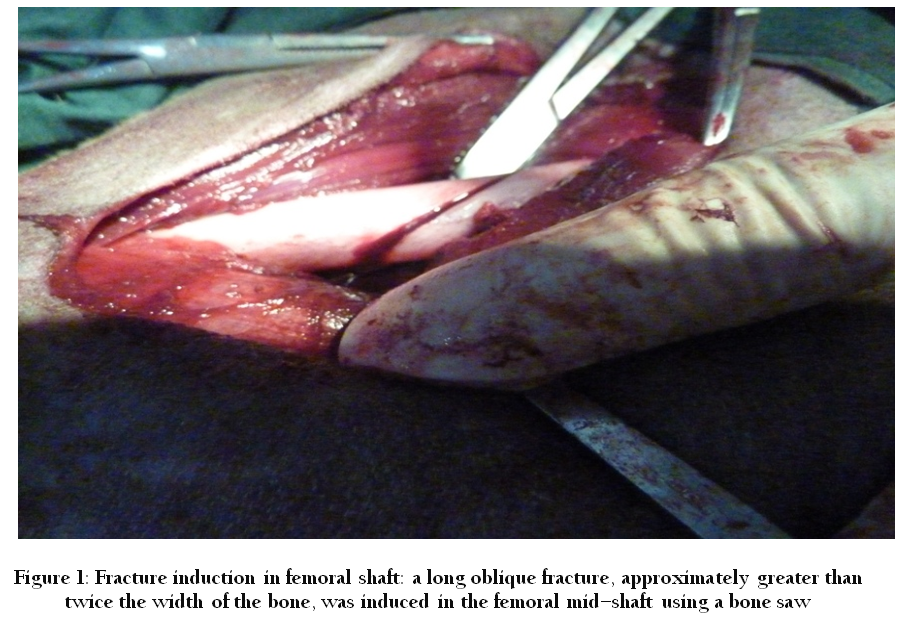
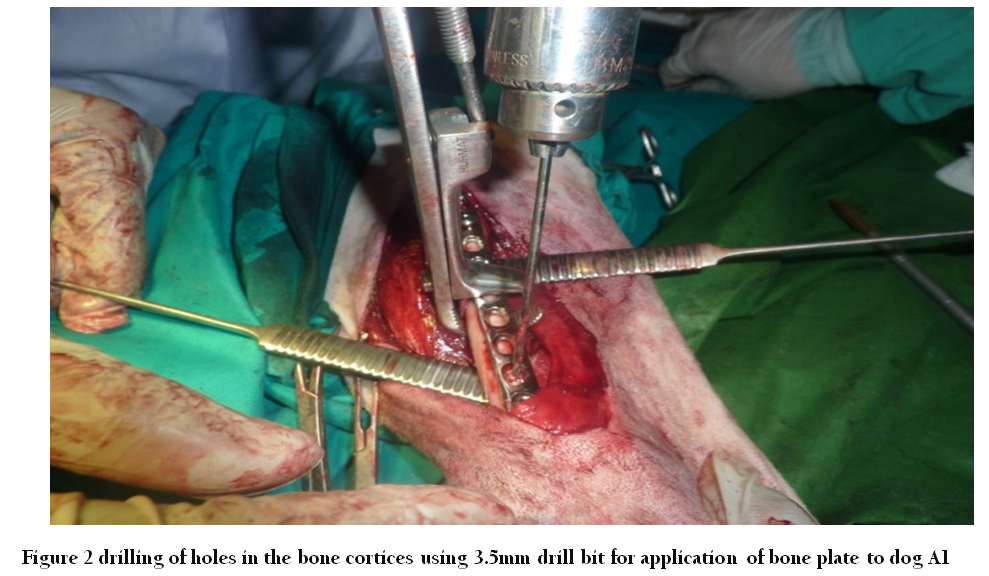
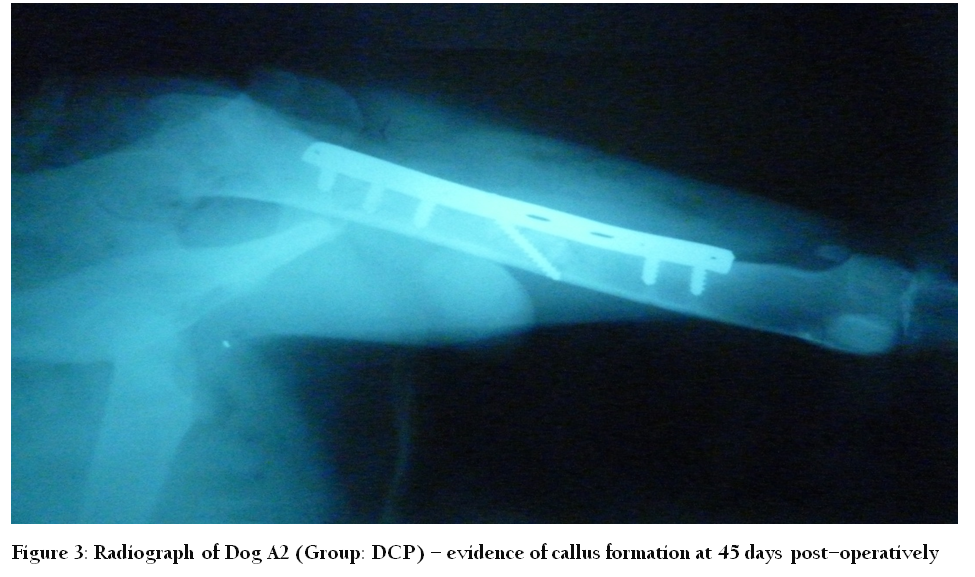
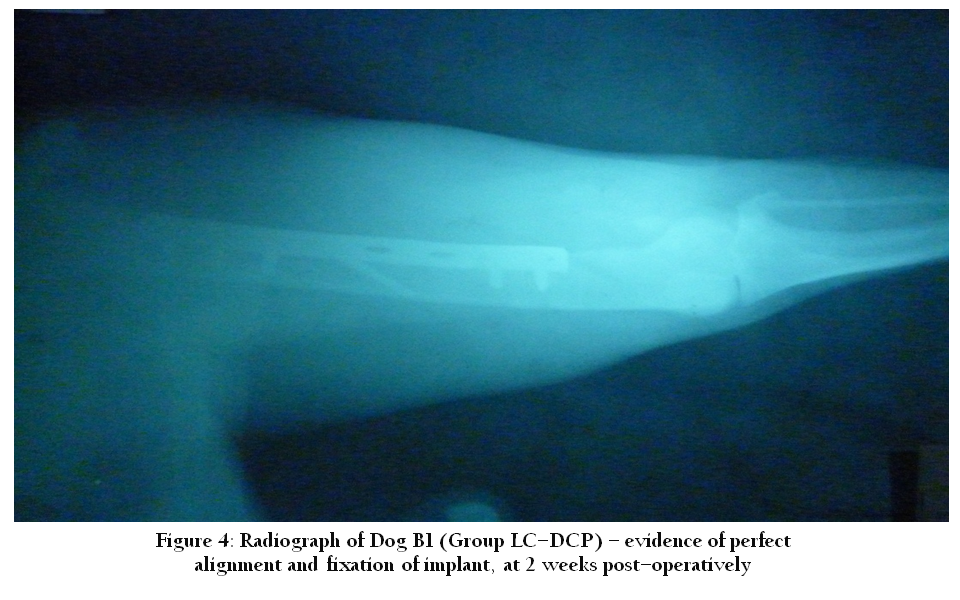
In this experimental study my project DCP had been compared with LC–DCP in presence control by keeping physical findings and Radiographic findings.
Experimental Parameters
The effectiveness of the technique was evaluated through following parameters.
Physical findings
Radiographic findings
Physical Findings
Gait and lameness analysis
Presence of pain
Wound healing
Gait and Lameness Analysis
Animals of each group were tested at various intervals for lameness, according to the grades.
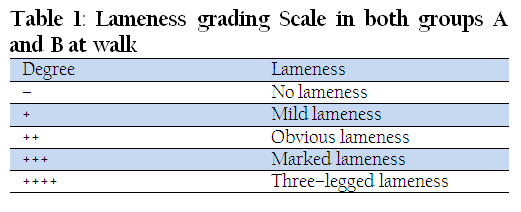
Table 1: Lameness grading Scale in both groups A and B at walk
Group A (DCP)
At Walk
During the healing period, the gait was evaluated on the basis of the degree of lameness. This was checked at an interval of 2 weeks after the surgery till three months post–operatively. The dogs showed different degrees of lameness at different periods.
In the beginning lameness was quite pronounced in all the experimental animals; Dog A1 showed three– legged lameness but with the passage of time it showed improvement and at the end of 12 weeks, no signs of lameness were present. Dog A2 and A4 showed marked lameness even after 2nd week post–operatively, however, at later stages only mild lameness ensued. Dog A3 was weak, lethargic and completely unwilling to stand up post–operatively. At two weeks after the surgery, it developed severe osteomyelitis and signs of 2nd degree lameness. Finally, after the 3rd week it expired.
Further results of lameness are evaluated in Table 2.
At Trot
Animals in group A were also evaluated for lameness at trot, at four weeks postoperatively. The results were not much different from those at walk. Dog A4 showed marked lameness at 2nd week which improved with the passage of time till at 12th week it finally resolved with good recovery and showed no signs of lameness.
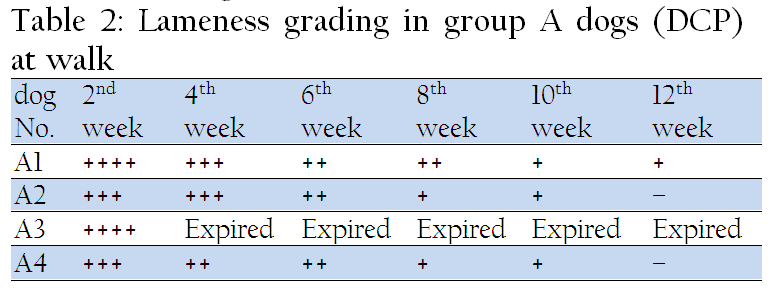
Table 2: Lameness grading in group A dogs (DCP) at walk
Assumption
–union and dog A3 expired in 3rd week
Group B (LC–DCP)
At Walk
In group B (LC–DCP), during the healing period after the surgical procedure, the gait was evaluated for signs of lameness at walk. This was checked at an interval of 2 weeks after surgery till the end of the experimental period. The results of the LC–DCP were quite promising in all dogs.
Dogs B1, B2 and B4 showed ideal weight–bearing from the very next day after surgery, owing to ideal fixation of the implant. However, dog B3 showed three–legged lameness at 2nd week. Radiographs were suggestive of plate displacement. The plate was removed; however, the dog expired at 2nd week post–operatively due to osteomyelitis and a generalized febrile skin disease.
Further results of lameness are evaluated in Table 3
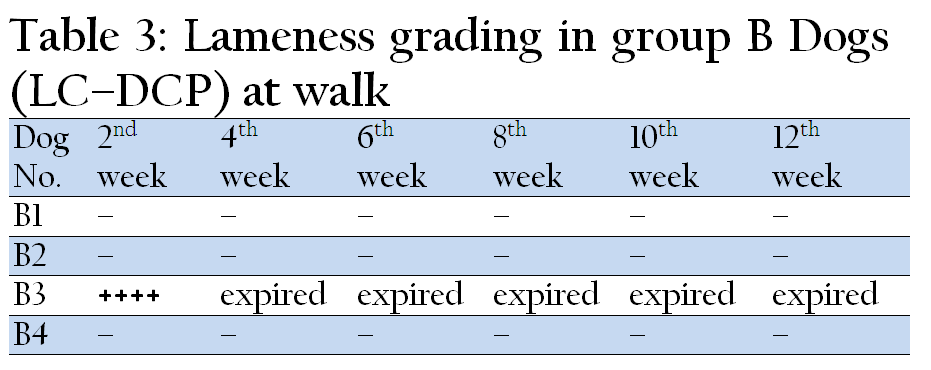
Table 3: Lameness grading in group B Dogs (LC–DCP) at walk
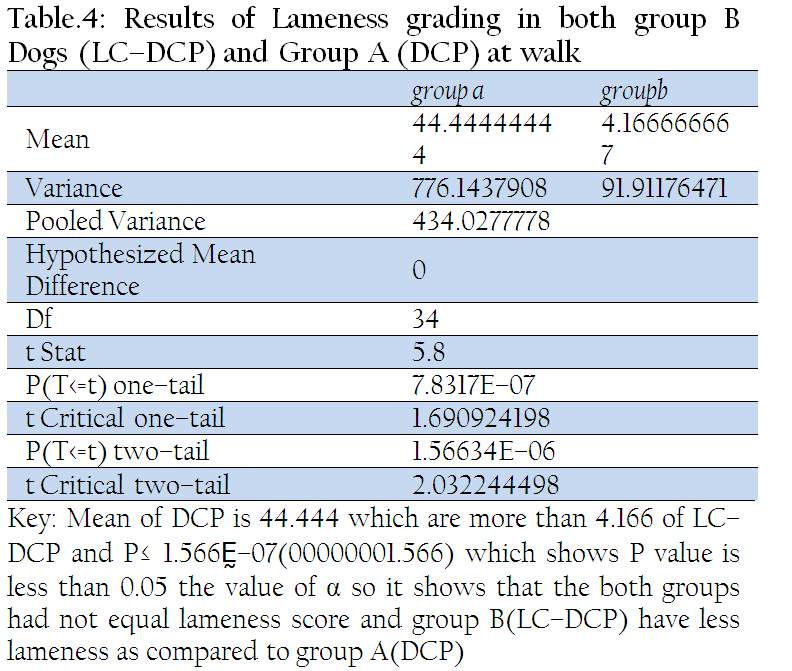
Table 4: Results of Lameness grading in both group B Dogs (LC–DCP) and Group A (DCP) at walk
At Trot
Animals in group B were also evaluated for lameness at trot. This was begun at four weeks post–operatively as in group A. The results were not much different from walk. Dogs B1, B2 and B4 showed good recovery with time, however, Dog B3 showed three–legged lameness at 2nd week due to implant loosening, and later expired at 2nd week post–operatively.
Assumption
From above table it is assumed that lameness is absent in 75% of animals. While in 25% it is sever. This was expired later on due to osteomyelitis.
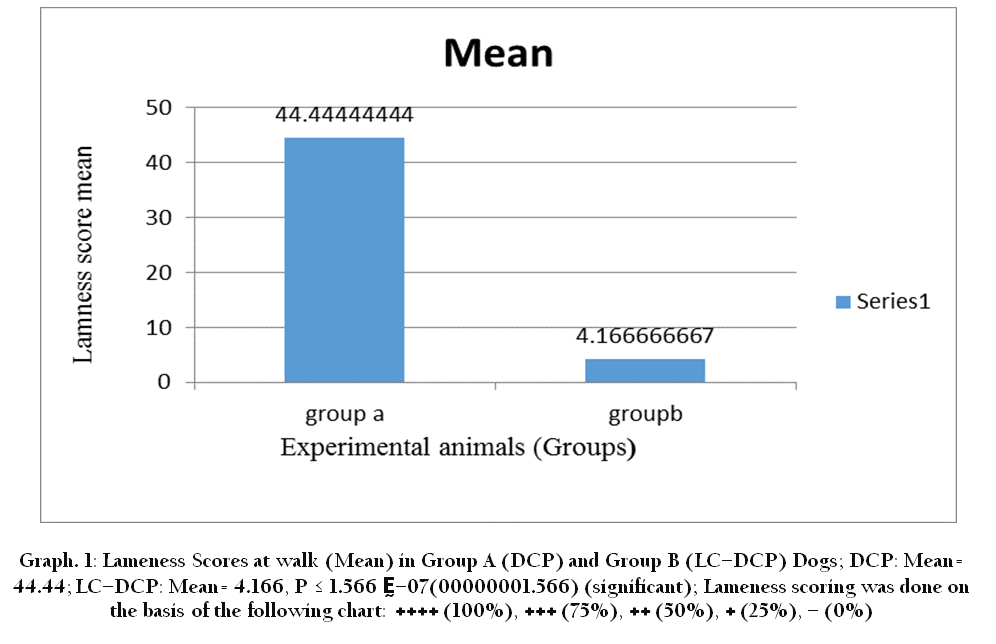
Graph 1: Lameness Scores at walk (Mean) in Group A (DCP) and Group B (LC–DCP) Dogs; DCP: Mean= 44.44; LC–DCP: Mean= 4.166, P ≤ 1.566 Ḛ–07(00000001.566) (significant); Lameness scoring was done on the basis of the following chart: ++++ (100%), +++ (75%), ++ (50%), + (25%), – (0%)
Pain Grading
All the dogs showed normal routine without the exhibition of any sever pain signs except dog A1 and A3 in group A (DCP) and B3 in group B (LC–DCP), which showed severe pain on 2nd day postoperatively; however, after the injection of Dicloran®(Diclofenac sodium) BD, the pain was alleviated the very next day. Response to pain was recorded according to the following scale:–
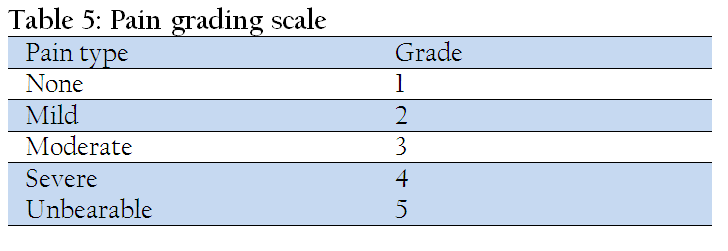
Table 5: Pain grading scale
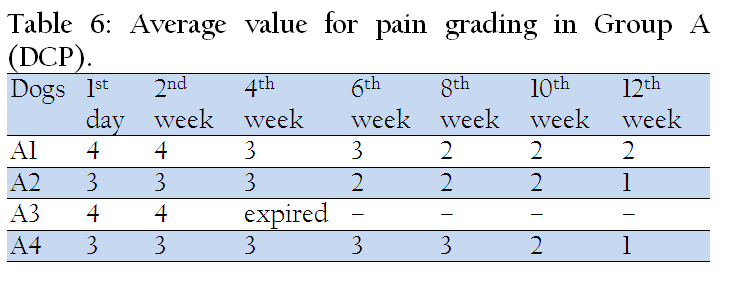
Table 6: Average value for pain grading in Group A (DCP)
Assumption
From table it is assumed that sever pain in 50 % animals and Moderate in 50% at start. Later on controlled but A1 had pain throughout research trial.
Assumption
From table it is assumed that 75 % have moderate and just 25% sever signs of pain.
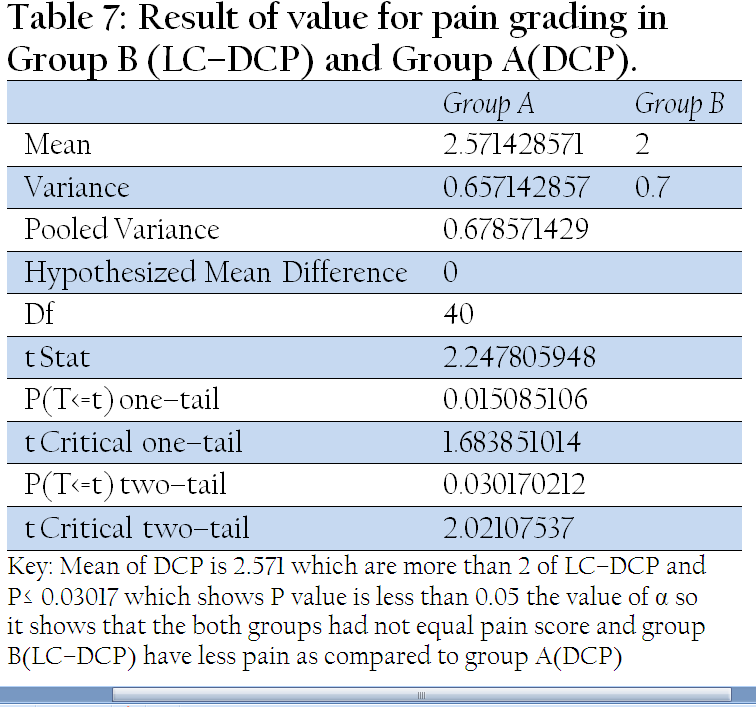
Table 7: Result of value for pain grading in Group B (LC–DCP) and Group A(DCP)
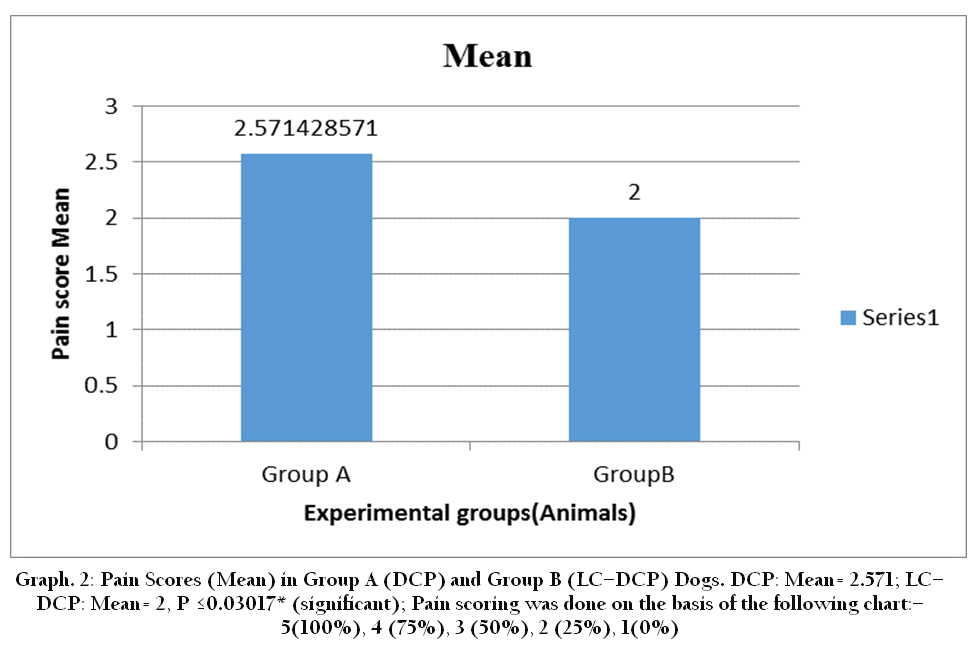
Graph 2: Pain Scores (Mean) in Group A (DCP) and Group B (LC–DCP) Dogs. DCP: Mean= 2.571; LC–DCP: Mean= 2, P ≤0.03017* (significant); Pain scoring was done on the basis of the following chart:–5(100%), 4 (75%), 3 (50%), 2 (25%), 1(0%)