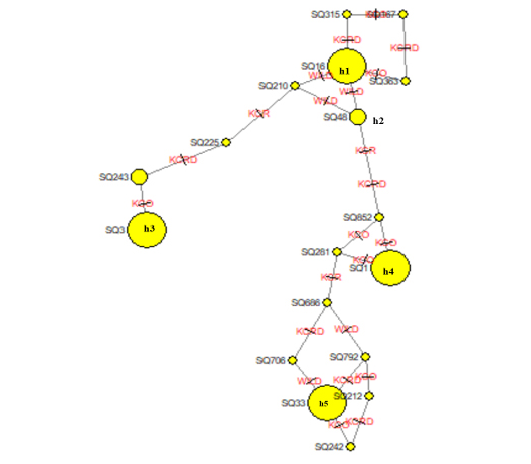
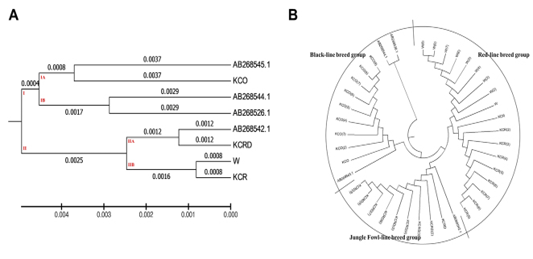
Table 2 compares the base sequence of each D-loop in mtDNA on nine native chickens in captivity at the National Institute of Animal Science and of the nine native chickens in Gyeonggi-do. Of the total 1231-1232 bp in the D-loop base sequence, single nucleotide polymorphisms (SNPs), with differences in the base transfer and substitution of a single base sequence, was found at 19 base areas. No difference was found between any individual groups; however, diversity observed among the groups. The wild type D-loop sequence analysis confirmed a base loss compared to other groups in sequences 48, 49, 50, 706, and 852, while the KCO group had base addition to 852. The KCRD, KCO, and KCR lines had a total of five base sections in a different sequence from the wild type. The KCRD and the KCO had changed at 167 (T/C), 212 (G/A), and 225 (T/C) bases. Additionally, variations at 315 (C/T) and 792(G/A) were confirmed in KCRD. The KCO had variations at 242 (G/T), 243 (T/C), 256 (T/C),
Table 2: mtDNA D-loop region sequence variations of 5 haplotypes of Samar RJFs and 17 haplotypes of Samar native chickens, derived from 5 and 43 individuals, respectively

Table 3: The identified SNP positions and haplotypes using the mtDNA D-loop control region in Korean native chickens
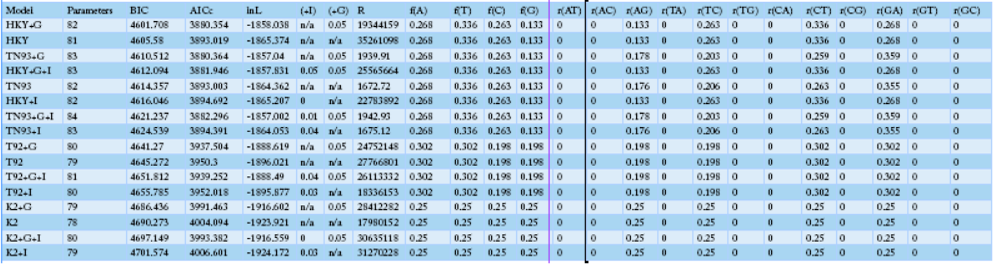
Table 4: Maximum Likelihood fits of 24 different nucleotide substitution models)
NOTE.-- Models with the lowest BIC scores (Bayesian Information Criterion) are considered to describe the substitution pattern the best. For each model, the Akaike Information Criterion, corrected (AICc value), Maximum Likelihood value (lnL), and the number of parameters (including branch lengths) are also presented. Non-uniformity of evolutionary rates among sites may be modeled using a discrete Gamma distribution with 5 rate categories and by assuming that a certain fraction of sites is evolutionarily invariable (+I). Wherever applicable, estimates of gamma shape parameter and/or the estimated fraction of invariant sites are shown. Assumed or estimated values of transition/transversion bias (R) are also shown for each model. They are followed by nucleotide frequencies (f) and rates of base substitutions (r) for each nucleotide pair. Relative values of instantaneous r should be considered when evaluating them. For simplicity, sum of r values were made equal to 1 for each model. For estimating ML values, a tree topology was automatically computed. The analysis involved 40 nucleotide sequences. Codon positions included tion (+were 1st+2nd+3rd+Noncoding. All positions containing gaps and missing data were eliminated. There were a total of 1226 positions in the final dataset. Evolutionary analyses were conducted in MEGA6.
281 (A/G), 363 (C/T), 367 (T/C) and 852 (-/C) compared to other groups. Thus, each group seemed to have a different genetic evolution. The diversities of the haplotypes were formed at wild type 1, 2, 3, 5, 17. The haplotype 4, 6, 7 were found in KCR. The KCRD had haplotype 13, 16, 18, while it was 8, 9, 11, 12, 14, 15, and 19 in KCO.