
As a key group in the Anatidae, the Mergini tribe (sea ducks) is strongly structured, with clear genetic assignments and phylogenetic relationships. The tribes also differ in terms of breeding strategy, longevity, and bionomic strategy. The mitochondrial genome (mitogenome) of Mergus serrator was 16,627 bp in length, and its structure was circular. The structure and gene arrangement of the genome were basically the same as those of Anseriformes species. The mean base composition of the mitogenome of Anseriformes was T (22.31 ± 0.51%), C (32.63 ± 0.64%), A (29.36 ± 0.64%), and G (15.71 ± 0.52%), indicating a slight specific bias towards A and C. AT content ranged of the mitogenome was from 50.27% to 55.31%, with an average value of 51.67 ± 1.10%, higher than the GC content and similar to that of birds in general (50.5% to 57.7%). In addition, the start and stop codons, the mitogenome consists of 3662 codons. The most commonly used amino acid was leucine (13.63%) in the use of M. serrator. The analyses indicated that the Anseriformes include the families Anseranatidae, Anhimidae, and Anatidae. Furthermore, Anatinae is composed of Aythyini, Anatini, Somaterini, and Mergini. M serrator was sister to M. merganser and M. squamatus, and this group belongs to Mergini. The ω value of the ND3 gene in the Mergini tribe is lower than those for other tribes. The phylogenetic relationships were analyzed and M. serrator was sister to M. merganser and M. squamatus, and formed a closely evolved Mergini clade. Different evolutionary rates between the Mergini tribe and other tribes were found.
Research Article · Volume 55, Issue 5, 1 September 2023 · Open Access
Characterization of the Complete Mitochondrial Genome of Sea Duck Mergus serrator and Comparison with other Anseriformes Species
· · · · ·
Affiliations & Notes ⌄
- 1Nanjing Institute of Environmental Sciences, Ministry of Ecology and Environment, Nanjing 210042, China 2National Marine Environmental Monitoring Center, Ministry of Ecology and Environment, Dalian 116023, China. 3Nantong Museum, Nantong 226001, China 4College of Marine Life Sciences and Frontiers Science Center for Deep Multispheres and Earth System, Ocean University of China, Qingdao 266003, China 5Institute of Evolution and Marine Biodiversity, Ocean University of China, Qingdao 266003, China
Article Info ⌄
- Journal:
- Pakistan Journal of Zoology
- Published:
- 1 September 2023

From the article
- A positive AT skew consistent with other Anseriformes species was found, which implies a slightly specific bias towards A and C in the Anseriformes.
- We summarized the RSCU values for the 13 PCGs and 3788 codons and high A+C contents were found, which also occurred in other species of Mergini.
- The phylogenetic relationships were analyzed and M. serrator was sister to M. merganser and M. squamatus, and formed a closely evolved Mergini clade.
- Compared to other species of Anseriformes, most PCGs evolved under purifying selection except for the ND6 gene.
Selected from the article's own text.
Abstract
INTRODUCTION
Mitochondrial genome (mitogenome) harbors useful molecular information that can be used to infer phylogenetic relationships among Anseriformes different taxa ; ; ; , one of the best-studied groups of birds . Anseriformes includes 3 families, 8 tribes, and more than 150 species ; . Due to gene rearrangement, genetic introgression, gene flow, and hybridization, the taxonomic statuses and phylogenetic placements within the order remain in dispute ; ; . The Mergini tribe includes 20 species of which two are extinct . As a key group in the Anatidae, the Mergini tribe (sea ducks) is strongly structured, with clear genetic assignments and phylogenetic relationships . Whereas, the relationships among the Mergini tribe species are not certain based on multiple approaches and different genes so far. For example, the phylogenetic status of Mergus serrator is inconsistent based on different genes , 2014; . There is a remarkable difference in the life history and behavioral traits among different tribes in the Anseriformes . Most tribes tend to live in inland streams, rivers, or ponds, such as the Anatini, Aythyini, and Anserini tribes ; . In contrast, the Mergini tribe roosts and forages in sea habitats . The tribes also differ in terms of breeding strategy, longevity, and bionomic strategy ; . The Mergini tribe as an excellent tribe to investigate molecular adaptions to elevate metabolic burden associated with other life-history characteristics. Phylogenetic analyses can help investigate the relationships between mitochondrial DNA (mtDNA) molecular evolution and metabolic performance ; Sonsthagen al., 2011).
MtDNA is typically double-stranded and maternally ; , it is valuable for studies of avian taxonomy and phylogeny ; ; , genetic structure , biological identification ; , and conservation genetics , as it is a neutral molecular marker ; . As the main energy suppliers of the cell, mitochondria produce approximately 90% of cellular ATP reserves through the highly efficient chemical osmotic coupling of electron and proton transfer to ATP synthesis ; . Evaluating the selective pressure of environmental temperature and oxygen availability on changes in mtDNA molecular could provide key insights for the adaptive evolution of mitogenomes . The key to successful migration to a new habitat is whether it can adapt to different energetic demands. Energetic demand is essentially related to the ability of mitochondrial to generate energy through the process of oxidative phosphorylation, such as in certain positions encoded by the NADH dehydrogenase genes (ND4 and ND5) ; . However, single or combined genes have obvious shortcomings in phylogenetic analysis, such as insufficient information . These are overcome when using complete sequences of mitochondria, and it is becoming the first-choice marker for resolving controversial species relationships (García et al., 2014; .
In this study, we sequenced the mitogenome of a typical sea duck, M. serrator, to analyze the genetic structure of and phylogenetic relationships among the Mergini tribe. In recent years, an increasing number of mitogenomes of the Mergini tribe have been sequenced. This study aims to shed increased light on the phylogenetic status of M. serrator in the Mergini tribe and to elucidate the evolutionary rates and molecular signatures of natural selection for all 13 mtDNA protein coding genes (PCGs) in sea ducks.
MATERIALS AND METHODS
Ethics approval and consent to participate
The sample collection was strictly conducted under national ethical guidelines (Regulations for Administration of Affairs Concerning Experimental Animals, China, 1988) for animal husbandry and humane treatment.
Sample collection and genome sequencing
We collected a dead specimen of M. serrator from Dalian (38°51′52.22″N 121°39′39.11″E; Liaoning, China). A muscle sample was transferred to a 5 mL centrifuge tube, 1 mL 75% ethyl alcohol was added, and the sample was stored in a refrigerator at –20°C. The sample (specimen voucher: NIES20210320HXQSYS01) was deposited in the Museum of Laboratory of Biodiversity Investigation of Nanjing Institute of Environment Science.
Total genomic DNA was extracted from muscle tissue using the Easy Pure genomic DNA kit (Trans Gen Biotech Co, Beijing, China). The original sequence data (15.65 G) was deposited in NCBI’s Sequence Read Archive (SRA; accession: SRR13516389), and complete mitogenome sequencing (15.62 G) was performed on an Illumina NovaSeq6000 platform (Novogene Bioinformatics Technology Co. Ltd., Tianjin, China) . The mitogenome was assembled using the program NOVO Plasty 3.7 and then adjusted manually. The annotated using the MITOS Web Server . The assembled mitogenome sequences have been deposited in GenBank under accession numbers MZ365040.
Data acquisition and analysis
All sequences were aligned on Clustal X using the default options . PCGs were identified by comparison with the corresponding known complete mtDNA sequence of M. merganser and M. squamatus using Sequin 11.0. The 22 tRNA genes of cloverleaf secondary structures and anticodon sequences were identified from MITOS WebServer (http://mitos.bioinf.uni-leipzig.de/index.py). The control region (CR) was identified by sequence homology analyses ; . The start and stop codons of 13 PCGs were identified in the M. serrator mitogenome by ORF Finder (https://www.ncbi.nlm.nih.gov/orffinder/) and use the CGView Server software to generate a graphical map of the mitogenome and modified it manually (Table I). The codon number and relative synonymous codon usage (RSCU) of three species of Mergus mitochondrial PCGs were obtained using MEGA X and PhyloSuite.
Table I. Organization of the complete mtDNAs of Mergus serrator.
| Gene | Location | Length (bp) | Start codon | End codon | Spacer (+) or overlap (-) | Strand |
| tRNAPhe | 1-72 | 72 | -1 | H | ||
| 12S rRNA | 72-1066 | 995 | 0 | H | ||
| tRNAVal | 1067-1137 | 71 | 0 | H | ||
| 16S rRNA | 1138-2737 | 1600 | 0 | H | ||
| tRNALeu(UUR) | 2738-2811 | 74 | 6 | H | ||
| ND1 | 2818-3795 | 978 | ATA | AGG | -2 | H |
| tRNAIle | 3794-3866 | 73 | 7 | H | ||
| tRNAGln | 3874-3944 | 71 | -1 | L | ||
| tRNAMet | 3944-4012 | 69 | 0 | H | ||
| ND2 | 4013-5051 | 1039 | ATG | T-- | 0 | H |
| tRNATrp | 5052-5127 | 76 | 3 | H | ||
| tRNAAla | 5131-5199 | 69 | 1 | L | ||
| tRNAAsn | 5201-5273 | 73 | 0 | L | ||
| tRNACys | 5274-5337 | 64 | 0 | L | ||
| tRNATyr | 5338-5408 | 71 | 1 | L | ||
| COI | 5410-6960 | 1551 | GTG | AGG | -9 | H |
| tRNASer(UCN) | 6952-7024 | 73 | 2 | L | ||
| tRNAAsp | 7027-7095 | 69 | 1 | H | ||
| COⅡ | 7097-7783 | 687 | GTG | TAA | 1 | H |
| tRNALys | 7785-7853 | 69 | 1 | H | ||
| ATP8 | 7855-8022 | 168 | ATG | TAA | -10 | H |
| ATP6 | 8013-8696 | 684 | ATG | TAA | -1 | H |
| COIII | 8696-9479 | 784 | ATG | T-- | 0 | H |
| tRNAGly | 9480-9548 | 69 | 0 | H | ||
| ND3 | 9549-9722 | 174 | ATG | TAG | 1 | H |
| 9724-9900 | 177 | 1 | H | |||
| tRNAArg | 9902-9971 | 70 | 0 | H | ||
| ND4L | 9972-10268 | 297 | ATG | TAA | -7 | H |
| ND4 | 10262-11639 | 1378 | ATG | T-- | 0 | H |
| tRNAHis | 11640-11708 | 69 | 0 | H | ||
| tRNASer(AGY) | 11709-11774 | 66 | -1 | H | ||
| tRNALeu(CUN) | 11774-11844 | 71 | 0 | H | ||
| ND5 | 11845-13668 | 1824 | GTG | TAA | -1 | H |
| CYTB | 13668-14810 | 1143 | ATG | TAA | 2 | H |
| tRNAThr | 14813-14880 | 68 | 10 | H | ||
| tRNAPro | 14891-14960 | 70 | 10 | L | ||
| ND6 | 14971-15492 | 522 | ATG | TAG | 0 | L |
| tRNAGlu | 15493-15560 | 68 | 0 | L | ||
| CR | 15561-16627 | 1067 | 0 | H |
Negative values indicate overlapping; H, heavy strand; L, light strand.
Table II. Nucleotide composition of the mitochondrial genomes of 53 Anseriformes species.
| Family/Genus | Species | T | C | A | G | AT skew | GC skew | A+T | G+C | Total | Accession number | ||||||||||
| Anatidae | |||||||||||||||||||||
| Aix | Aix galericulata | 22.35 | 32.77 | 29.21 | 15.66 | 0.13 | -0.35 | 51.57 | 48.43 | 16605 | NC023969 | ||||||||||
| Anas | Anas acuta | 22.12 | 32.86 | 28.78 | 16.24 | 0.13 | -0.34 | 50.90 | 49.10 | 16599 | NC024631 | ||||||||||
| A. crecca | 22.35 | 32.64 | 29.05 | 15.96 | 0.13 | -0.34 | 51.40 | 48.60 | 16601 | NC022452 | |||||||||||
| A. platyrhynchos | 22.21 | 32.81 | 29.20 | 15.78 | 0.14 | -0.35 | 51.41 | 48.59 | 16604 | NC009684 | |||||||||||
| A. poecilorhyncha | 22.21 | 32.82 | 29.17 | 15.81 | 0.14 | -0.35 | 51.37 | 48.63 | 16608 | NC022418 | |||||||||||
| Anser | Anser albifrons | 22.63 | 32.05 | 30.15 | 15.18 | 0.14 | -0.36 | 52.78 | 47.22 | 16737 | NC004539 | ||||||||||
| A. anser | 22.58 | 32.14 | 30.18 | 15.10 | 0.14 | -0.36 | 52.77 | 47.23 | 16738 | NC011196 | |||||||||||
| A. cygnoides | 22.49 | 32.24 | 30.21 | 15.06 | 0.15 | -0.36 | 52.70 | 47.30 | 16739 | NC023832 | |||||||||||
| A. fabalis | 22.73 | 31.84 | 30.07 | 15.36 | 0.14 | -0.35 | 52.80 | 47.20 | 16688 | NC016922 | |||||||||||
| A. indicus | 22.50 | 32.23 | 30.17 | 15.10 | 0.15 | -0.36 | 52.67 | 47.33 | 16730 | NC025654 | |||||||||||
| Asarcornis | Asarcornis scutulata | 21.77 | 33.22 | 28.88 | 16.13 | 0.14 | -0.35 | 50.64 | 49.36 | 16539 | NC052827 | ||||||||||
| Aythya | Aythya americana | 22.24 | 32.75 | 29.39 | 15.62 | 0.14 | -0.35 | 51.62 | 48.38 | 16616 | NC000877 | ||||||||||
| A. ferina | 22.19 | 32.83 | 29.42 | 15.56 | 0.14 | -0.36 | 51.61 | 48.39 | 16616 | NC024602 | |||||||||||
| A. fuligula | 22.18 | 32.87 | 29.42 | 15.52 | 0.14 | -0.36 | 51.61 | 48.39 | 16616 | NC024595 | |||||||||||
| A. nyroca | 22.28 | 32.71 | 29.66 | 15.35 | 0.14 | -0.36 | 51.94 | 48.06 | 16623 | MW287344 | |||||||||||
| Branta | Branta bernicla | 22.68 | 31.99 | 29.91 | 15.42 | 0.14 | -0.35 | 52.59 | 47.41 | 16747 | KJ680301 | ||||||||||
| B. canadensis | 22.60 | 32.07 | 30.18 | 15.14 | 0.14 | -0.36 | 52.79 | 47.21 | 16760 | NC007011 | |||||||||||
| Bucephala | Bucephala albeola | 21.82 | 33.36 | 28.52 | 16.30 | 0.13 | -0.34 | 50.34 | 49.66 | 16614 | MW849286 | ||||||||||
| B. clangula | 21.65 | 33.46 | 28.68 | 16.21 | 0.14 | -0.35 | 50.33 | 49.67 | 16625 | MW849283 | |||||||||||
| B. islandica | 21.65 | 33.43 | 28.68 | 16.24 | 0.14 | -0.35 | 50.32 | 49.68 | 16627 | MW849281 | |||||||||||
| Cairina | Cairina moschata | 21.93 | 32.95 | 29.01 | 16.12 | 0.14 | -0.34 | 50.93 | 49.07 | 16610 | NC010965 | ||||||||||
| Clangula | Clangula hyemalis | 21.83 | 33.31 | 29.18 | 15.68 | 0.14 | -0.36 | 51.01 | 48.99 | 16610 | MW849278 | ||||||||||
| Cygnus | Cygnus atratus | 22.20 | 32.55 | 29.52 | 15.73 | 0.14 | -0.35 | 51.72 | 48.28 | 16748 | NC012843 | ||||||||||
| C. columbianus | 22.79 | 31.89 | 30.09 | 15.23 | 0.14 | -0.35 | 52.88 | 47.12 | 16728 | NC007691 | |||||||||||
| C. cygnus | 22.79 | 31.97 | 29.97 | 15.27 | 0.14 | -0.35 | 52.76 | 47.24 | 16724 | NC027095 | |||||||||||
| C. olor | 22.59 | 32.12 | 29.64 | 15.65 | 0.13 | -0.34 | 52.23 | 47.77 | 16739 | NC027096 | |||||||||||
| Dendrocygna | Dendrocygna javanica | 23.67 | 30.44 | 30.44 | 15.45 | 0.13 | -0.33 | 54.11 | 45.89 | 16753 | NC012844 | ||||||||||
| Heteronetta | Heteronetta atricapilla | 23.00 | 31.93 | 30.01 | 15.06 | 0.13 | -0.36 | 53.00 | 47.00 | 16723 | CM021836 | ||||||||||
| Histrionicus | Histrionicus histrionicus | 21.79 | 33.29 | 29.32 | 15.61 | 0.15 | -0.36 | 51.11 | 48.89 | 16634 | MW849288 | ||||||||||
| Lophodytes | Lophodytes cucullatus | 21.96 | 33.02 | 29.01 | 16.01 | 0.14 | -0.35 | 50.97 | 49.03 | 16549 | MW849287 | ||||||||||
| Mareca | Mareca falcata | 22.35 | 32.65 | 28.88 | 16.11 | 0.13 | -0.34 | 51.24 | 48.76 | 16601 | NC023352 | ||||||||||
| M. penelope | 22.29 | 32.71 | 28.89 | 16.11 | 0.13 | -0.34 | 51.18 | 48.82 | 16596 | NC050973 | |||||||||||
| M. strepera | 22.19 | 32.81 | 28.84 | 16.16 | 0.13 | -0.34 | 51.03 | 48.97 | 16600 | NC045373 | |||||||||||
| Melanitta | Melanitta deglandi | 21.58 | 33.45 | 28.74 | 16.22 | 0.14 | -0.35 | 50.33 | 49.67 | 16452 | MW849279 | ||||||||||
| M. nigra | 21.77 | 33.32 | 28.83 | 16.08 | 0.14 | -0.35 | 50.60 | 49.40 | 16552 | MW849282 | |||||||||||
| M. perspicillata | 21.61 | 33.49 | 28.66 | 16.24 | 0.14 | -0.35 | 50.27 | 49.73 | 16499 | MW849280 | |||||||||||
| Mergus | Mergus merganser | 21.88 | 33.24 | 28.73 | 16.16 | 0.14 | -0.35 | 50.60 | 49.40 | 16630 | NC040986 | ||||||||||
| M. serrator | 21.72 | 33.38 | 28.77 | 16.13 | 0.14 | -0.35 | 50.49 | 49.51 | 16627 | MZ365040 | |||||||||||
| M. squamatus | 22.26 | 32.76 | 29.03 | 15.95 | 0.13 | -0.35 | 51.29 | 48.71 | 16595 | NC016723 | |||||||||||
| Table continues on next page.................... | |||||||||||||||||||||
| Family/Genus | Species | T | C | A | G | AT skew | GC skew | A+T | G+C | Total | Accession number | ||||||||||
| Netta | Netta rufina | 22.44 | 32.59 | 29.61 | 15.37 | 0.14 | -0.36 | 52.04 | 47.96 | 16625 | NC024922 | ||||||||||
| Nettapus | Nettapus auritus | 22.83 | 32.07 | 29.79 | 15.31 | 0.13 | -0.35 | 52.62 | 47.38 | 16643 | CM021833 | ||||||||||
| Oxyura | Oxyura jamaicensis | 22.94 | 32.30 | 28.81 | 15.94 | 0.11 | -0.34 | 51.75 | 48.25 | 15914 | CM021834 | ||||||||||
| Polysticta | Polysticta stelleri | 21.89 | 33.04 | 28.79 | 16.28 | 0.14 | -0.34 | 50.68 | 49.32 | 16612 | MW849289 | ||||||||||
| Sibirionetta | Sibirionetta formosa | 22.51 | 32.44 | 29.52 | 15.53 | 0.13 | -0.35 | 52.03 | 47.97 | 16592 | NC015482 | ||||||||||
| Somateria | Somateria fischeri | 21.90 | 33.12 | 28.74 | 16.25 | 0.14 | -0.34 | 50.64 | 49.36 | 16601 | MW849290 | ||||||||||
| S. mollissima | 21.97 | 33.02 | 28.62 | 16.39 | 0.13 | -0.34 | 50.59 | 49.41 | 16626 | MW849292 | |||||||||||
| S. spectabilis | 21.93 | 33.07 | 28.71 | 16.29 | 0.13 | -0.34 | 50.65 | 49.35 | 16627 | MW849291 | |||||||||||
| Spatula | Spatula clypeata | 22.47 | 32.49 | 29.39 | 15.65 | 0.13 | -0.35 | 51.86 | 48.14 | 16599 | NC028346 | ||||||||||
| Stictonetta | Stictonetta naevosa | 22.39 | 32.80 | 28.45 | 16.35 | 0.12 | -0.33 | 50.84 | 49.16 | 16778 | CM021835 | ||||||||||
| Tadorna | Tadorna ferruginea | 21.99 | 32.96 | 29.57 | 15.48 | 0.15 | -0.36 | 51.56 | 48.44 | 16639 | NC024640 | ||||||||||
| T. tadorna | 22.21 | 32.82 | 29.20 | 15.78 | 0.14 | -0.35 | 51.40 | 48.60 | 16604 | NC024750 | |||||||||||
| Anhimidae | |||||||||||||||||||||
| Chauna | Chauna torquata | 24.01 | 30.82 | 31.31 | 13.87 | 0.13 | -0.38 | 55.31 | 44.69 | 16766 | NC052807 | ||||||||||
| Anseranatidae | |||||||||||||||||||||
| Anseranas | Anseranas semipalmata | 23.49 | 31.38 | 30.92 | 14.20 | 0.14 | -0.38 | 54.41 | 45.59 | 16868 | NC005933 | ||||||||||
| Averages | 22.31 | 32.63 | 29.36 | 15.71 | 0.14 | -0.35 | 51.67 | 48.33 | 16632 | ||||||||||||
| Standard deviation | 0.51 | 0.64 | 0.64 | 0.52 | 0.01 | 0.01 | 1.10 | 1.10 | 127.12 | ||||||||||||
Retrieved and downloaded the complete mitogenomes of 53 Anseriformes species from GenBank, and including 2 families and 46 genera (Table II). We used MEGA5.0 and DNASTAR to compare the sequences of these birds and to analyze their base content. The calculation for the skewing of nucleotide composition was AT skew = (A-T) / (A + T), GC skew = (G-C) / (G + C) .
Analysis of phylogeny
We collected the complete mitogenome of 53 Anseriformes species for phylogenetic analysis (Table II). Corresponding Gallus gallus, Hydrophasianus chirurgus, and Porzana fusca sequence were used as outgroups. Phylogenetic trees were estimated using ML and BI methods. The optimal parameter model selected by MrModel Test 3.06 and PAUP 4.0b10 software . The GTR + I + G model that was selected as the best fit model for nucleotide phylogenetic analysis. The BI trees of Anseriformes birds were constructed using MrBayes 3.1.2 software . The ML tree was constructed using the MEGA5.0 software , as follows: run the files in Phy format, select the best model using the Mr Model Test 3.06 software filter, set the ML in bootstrap mode, repeat bootstraps 50 times, and run the whole process 10,000 times to obtain the ML tree. Finally, Treeview32 software was used to create and annotate the evolutionary tree diagram.
Analysis of adaptive molecular evolution
In order to test the possible influence of topology on the inference of selected locations, estimated ω (dN/dS) rate using the topology inferred from genomic data ; . dN is the non-synonymous substitution rate, or the rate at which changes in nucleotide sites lead to changes in new amino acid chains. Things are the opposite for dS (synonymous substitution). The dN/dS ratio provides evidence for selective restraint and pressures acting on PCGs ; . If natural selection is favoring amino acid changes, ω > 1 indicates positive selection. A ratio below 1 indicates purification selection, and a ratio at 1 indicates neutral evolution.
The phylogenetic tree has many branches, and test the role of selection on the Mergini branch. We employed CodeML branch models that estimate the selective pressure between Mergini tribes and other tribes, which allow the estimation of dN/dS of specific branches and clades of interest related to other clades and other parts of the tree . In the dual scale and all branch site models described below, we label these species in the Mergini tribes as the foreground branches in a separate analysis. Use branch-site analysis to determine whether a portion of sites was subject to positive selection. To further evaluate these sites, we performed a positive selection analysis using the site model in PAML4. Selection Test was carried out using likelihood-ratio tests (LRT). The model was compared with a null model, in which the ω of the foreground partition class of the selected location was restricted to 1 . LRT was used to identify the significance of selective pressure between different pedigrees.
RESULTS AND DISCUSSION
Genome organization and composition
M. serrator is a typical sea duck in the Mergini tribe and its complete mitogenome was found to be 16,627 bp (Table I). So far, the length of the mitogenome of birds that has been sequenced is from 16,300 bp to 23,500 bp ; . Among Anseriformes species, the shortest mitogenome belongs to Oxyura jamaicensis (15,914 bp) and the longest is that of Anseranas semipalmata (16,868 bp). In the Anseriformes taxa, the length and gene arrangement of the mitogenome are quite conserved. The genomes of M. serrator contained a typical set of 37 genes (Fig. 1), including 13 PCGs, 2 ribosomal RNAs, 22 transfer RNAs, and a non-coding putative CR (Table I, Fig. 2). The structure and gene arrangement were basically the same as most birds ; . An ND6 gene and eight tRNA genes (tRNAGln, tRNAAla, tRNAAsn, tRNACys, tRNATyr, tRNASer (UCN), tRNAPro, and tRNAGlu) were encoded by the L-strand, whereas other genes were encoded by the H-strand (Table I).
The overall information about the mitogenome of M. serrator was as follows: T: 21.72%, C: 33.38%, A: 28.77%, and G: 16.13% and the content of GC is 49.51% with A+T-rich feature, same as in other species of Anseriformes. The mean base composition of Anseriformes is T (22.31 ± 0.51%), C (32.63 ± 0.64%), A (29.36 ± 0.64%), and G (15.71 ± 0.52%). Additionally, in our study, the sequence of base richness was mainly C > A > T > G, and only Chauna torquata had base contents of A > C >T > G. The AT content range is 50.27% ~ 55.31%, with an average value is 51.67 ± 1.10%, which is higher than the GC content and similar to that of birds in general (50.5% to 57.7%) .
Vertebrate mtDNA usually shows significant chain bias in nucleotide composition, and this chain bias can be measured as AT and GC skew. We measured the AT skew (0.14) and GC skew (-0.35) of the H-strand in the M. serrator mitogenome. The mean AT skew was 0.14 ± 0.01, and the GC skew was -0.35 ± 0.01. It shows that the nucleotide composition of the complete mitogenome of Anseriformes has a slight specific bias against A and C.
Analysis of PCGs and codon usage
The geneme of M. serrator had 13 PCGs, and 12 PCGs were encoded on the H-strand except ND6. The overall length of 13 PCGs was 11,229 bp, which accounted for 67.53% of the whole mitogenome (Table I). The longest was the ND5 gene (1,824 bp) and the shortest was the ATP8 gene (168 bp). Among the 13 PCGs, the start codon of 9 PCGs was ATG, and the nonstandard start codon GTG was found in COI, COII, and ND5 genes. In addition, the start codon of ND1 gene was ATA (Table I). The most common stop codon was TAA, which has been used six times. TAG and AGG were used twice as stop codons, and the terminal T probably served as the stop signal in the ND2, ND4, and COIII genes. In the ND3 gene, the base A of the stop codon was not translated.
The RSCU values of 13 PCGs are shown in Figure 3. In addition, the start and stop codons, the mitogenome consists of 3662 codons. The most commonly used amino acid was leucine (13.63%) in the use of 13 PCGs of M. serrator, followed by proline (11.47%), serine (9.59%), and threonine (8.06%). In three Mergini species, eight amino acids (Pro, Thr, Leu1, Arg, Ala, Ser1, Val, and Gly) were encoded by four different codons, and the others were encoded by two different codons. The overall AT-skew and GC-skew of the 13 PCGs was 0.06 and -0.36, respectively. The base composition of PCGs has a higher A + C contents, and a preferred to use A or C nucleotides in the first codon position (Fig. 3). This phenomenon also occurs in other species of Mergini, especially M. squamatus and M. merganser.
Ribosomal RNAs, transfer RNAs, and CR
In the M. serrator mitogenome, ribosomal RNA genes include 12S rRNA and 16S rRNA, which are 995 bp and 1600 bp in length, respectively. They are located between the tRNAPhe and tRNALeu genes, and separated by the tRNAVal, a feature often found in the mitogenomes of birds ; . Two ribosomal RNAs were identified on the H-strand. The A + T content of both rRNA genes were collectively 52.5% and they had a positive AT-skew (0.28).
A total of 22 tRNAs were found in the mitogenome, and they were scattered between rRNAs and PCGs. Their sizes is between 64 bp and 76 bp (Table I, Supplementary Fig. 1). Three tRNA clusters, namely, IQM (tRNAIle tRNAGln tRNAMet), WANCY (tRNATrp tRNAAla tRNAAsn tRNACys tRNATyr), and HSL (tRNAHis tRNASer (AGY) tRNALeu (CUN)), were determined. Sequences of the tRNA genes could be folded into a canonical cloverleaf secondary structure.
The CR of mtDNAs of M. serrator was 1,067 bp, which was located between the tRNAGlu and tRNAPhe genes. The CR could be divided into three domains according to the base composition (5′-peripheral domain, Domain I; central conserved domain, Domain II; and 3′-peripheral domains, Domain III). In Domain I, extended termination-associated sequences 1 (ETAS1) was observed at position nt 77 - 98 (Fig. 2). A sequence block was also found in domain I (nt 298–323), which is similar to the conserved sequence block (CSB1-like). Four conserved sequence boxes (C, D, E, and F) were identified in Domain II. CBS1 (nt 407–589) and the H- and L-strand transcription promoter sites (nt 806–822) occurred in Domain III.
Phylogenetic analysis
The complete sequences should be suitable for the phylogenetic analysis and research of Anseriformes. Reconstruction of BI and ML trees using complete mitogenome sequences of 56 species. Use the best-fit model of GTR+G+I (-lnL = 258460.5951, AIC= 516937.2376) and calculated with the Modeltest and Mrmodeltest programs for analysis. Since the generated BI and ML trees show the same topological structure, only the BI tree is displayed (the numbers on the branches represent the bootstrap support for BI and ML trees).
Traditional morphological analysis divides Anatinae into Tadornini, Tachyerini, Cairinini, Anatini, Aythyini, Mergini, Oxyurini, and others. In the literature, Anseriformes species are relatively clearly classified at the level of the family but not the subfamily and genus ; García et al., 2014; . The replacement rate and mutation rate of the mitochondrial sequence of Anseriformes species are high ; . The BI and ML trees showed the complete mitogenome has the ability to distinguish 53 Anseriformes species. The phylogenetic analysis based on the complete mitogenome strongly supports the monophyleticity of the order Anseriformes. The analyses indicated that the Anseriformes include the families Anseranatidae, Anhimidae, and Anatidae. Anseranas semipalmata was included in the branch of Anseranatidae, and Chauna torquata was included in the branch of Anhimidae, and other species belong to the branch of Anatidae (Fig. 4). The branch of Anatidae included Dendrocygninae, Oxyurinae, Stictonettinae, Anserinae, Tadorninae, and Anatinae. The Anatinae had the largest number (32) of species. The Anatinae included Aythyini, Anatini, Somaterini, and Mergini. The results suggest that M. serrator is sister to M. merganser and M. squamatus, which is slightly different from a previous study . However, both studies suggest that this group belongs to the Mergini.
Selection analysis
Most mitochondrial genes besides the ND6 gene are conserved and evolved under purifying selection (Fig. 5). The branch model detected significant signals of positive selection for the ND6 gene tested in all tribes of Anseriformes. It also fitted better for most PCGs when the Mergini tribe was labeled as a foreground branch (Fig. 5) (LRT p value < 0.05). In addition, the ND6 gene showed the highest ω values (ω > 1) both for the foreground (ω = 4.59) and background (ω = 3.28) branches, compared to other genes. The ω value of the ND3 gene in the Mergini tribe is lower than those for other tribes. The ω values of other genes in the Mergini tribe are higher than those for other tribes. The free-ratio model fitting the data of 13 PCGs is significantly better than the null hypothesis (one-ratio model), indicating that there are different evolution rates among the tribes included in our data set.
CONCLUSION
The mitogenome (16,627 bp) was larger than those of most Anseriformes species. A positive AT skew consistent with other Anseriformes species was found, which implies a slightly specific bias towards A and C in the Anseriformes. PCGs accounted for 67.53% of the whole mitogenome and most of these genes were encoded by the L-strand. ATG and TAA were the most frequent start codon and stop codon, respectively. We summarized the RSCU values for the 13 PCGs and 3788 codons and high A+C contents were found, which also occurred in other species of Mergini. Two ribosomal RNA genes, 12S rRNA and 16S rRNA, were encoded on the H-strand and had a positive A-T skew. Sequences of 22 tRNA genes ranged from 64 bp to 76 bp and could be folded into a canonical cloverleaf secondary structure. The phylogenetic relationships were analyzed and M. serrator was sister to M. merganser and M. squamatus, and formed a closely evolved Mergini clade. Compared to other species of Anseriformes, most PCGs evolved under purifying selection except for the ND6 gene. Different evolutionary rates between the Mergini tribe and other tribes were found.
ACKNOWLEDGEMENTS
We thank researcher Yu Dandan for her help in writing this article. This study was supported by the Basic Research Business Project of National Scientific Institute (GYZX210405) and the National Science Foundation of China under Grant (32001111).
Supplementary material
There is supplementary material associated with this article. Access the material online at: https://dx.doi.org/10.17582/journal.pjz/20220314030351
Conflict of interest statement
The authors have declared no conflict of interest.
Figures
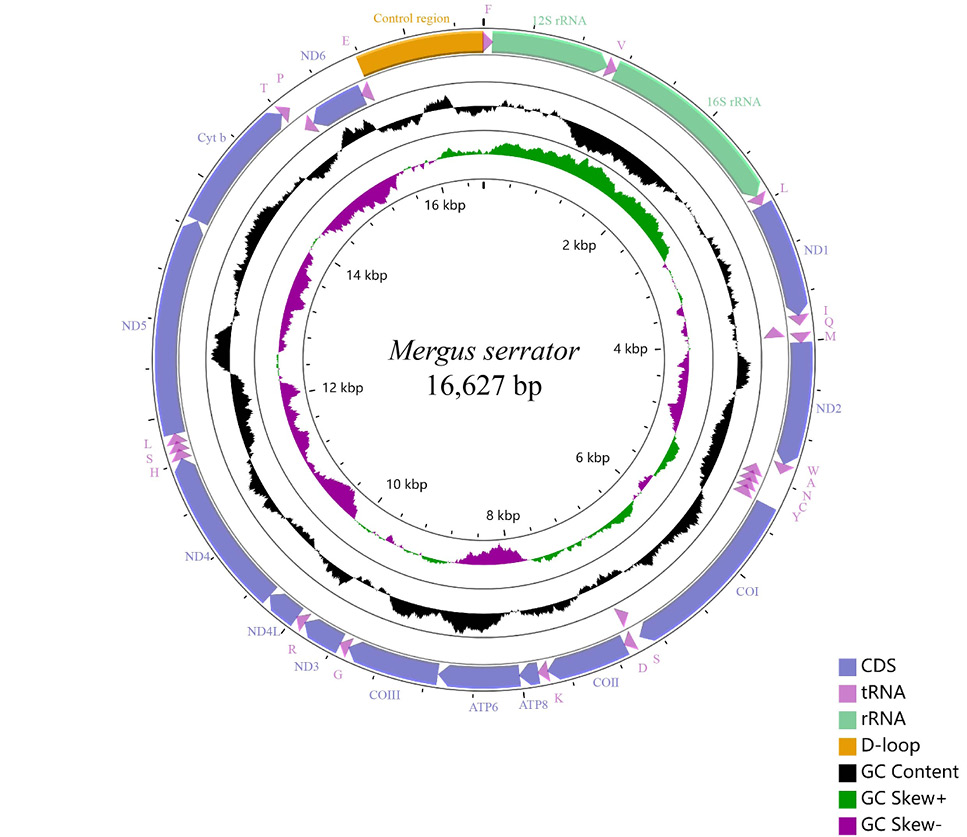
Mitochondrial genomes of M. serrator. Arrows indicate the orientation of gene transcription. PCGs are shown as blue arrows, rRNA as light green arrows, control region as orange arrows, and tRNA genes as purple arrows. tRNA genes are designated by single-letter amino acid abbreviations. Labeling from the outside to the inside circle: genes encoded on the heavy strand, genes encoded on the light strand. The black circle demonstrates the GC content (the peaks outside/inside the circle indicate values higher or lower than average GC content). The purple-green circle demonstrates GC skew, purple (between 0 and 1), and green (between -1 and 0).
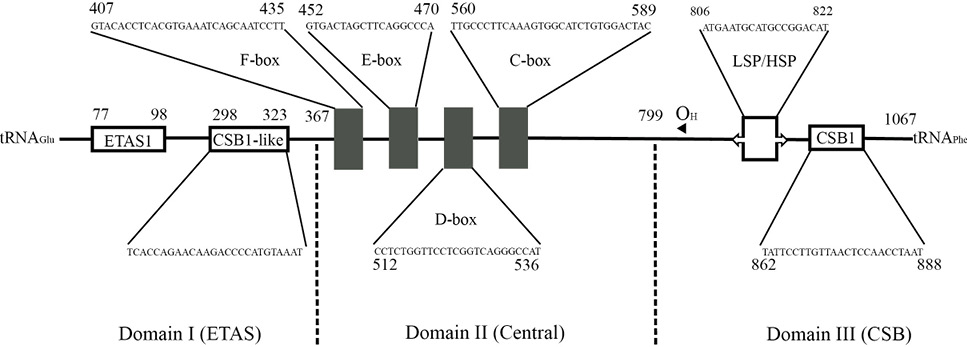
General structure of the mtDNA control region of M serrator.
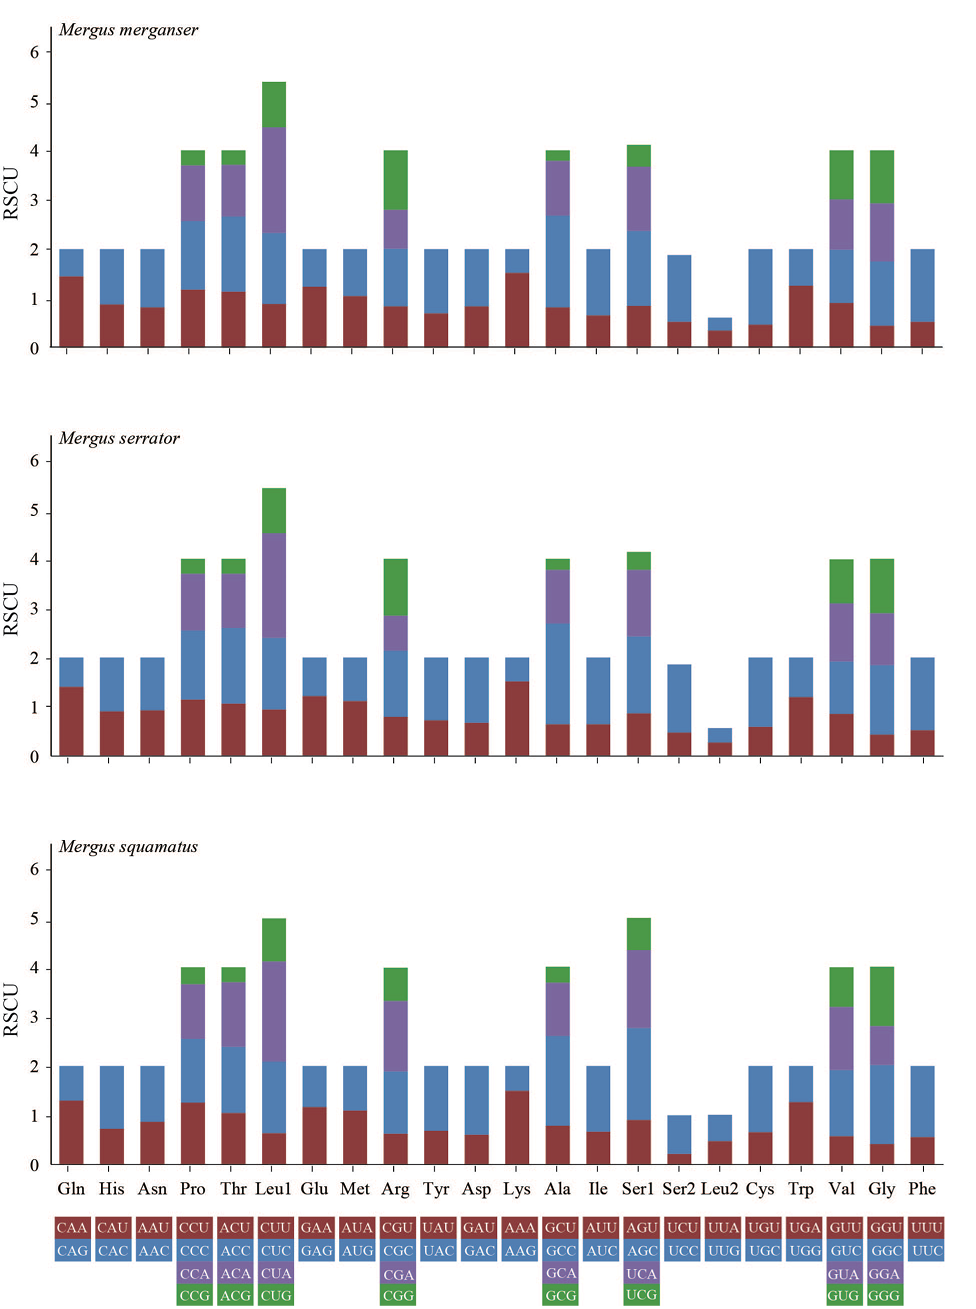
Codon number and relative synonymous codon usage (RSCU) of mitochondrial PCGs of three species of Mergus.
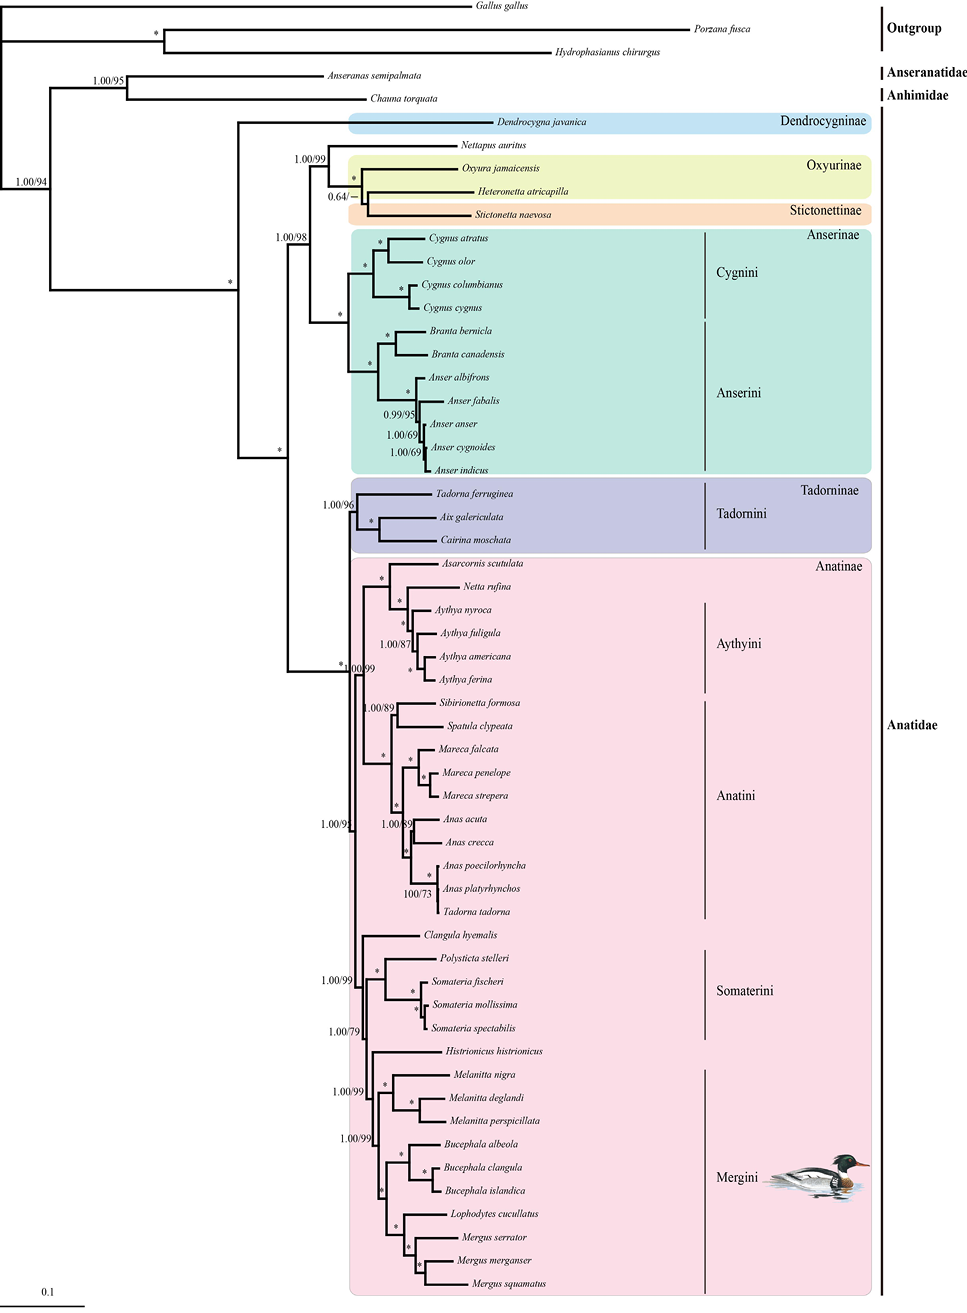
BI and ML trees constructed based on complete mtDNA sequences of Anseriformes. Numbers represent bootstrap values (MP/ML) and only those >60% are shown. Asterisks indicate posterior probabilities of 100%.
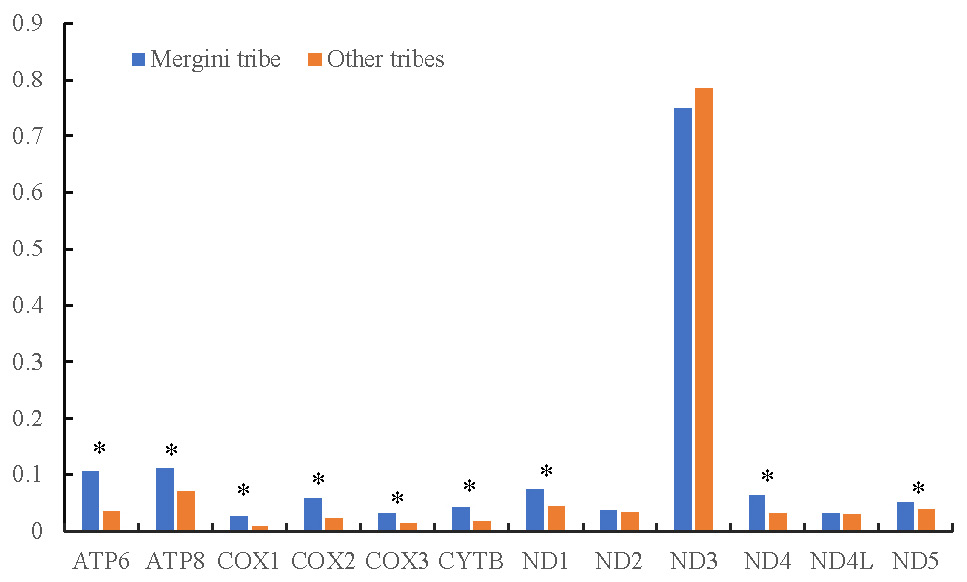
Natural selection strength and the ratio of non-synonymous to synonymous substitutions (ω) calculated using the two-ratio model for 12 purifying selective protein-coding genes between the Mergini tribe and other tribes. Genes in which the two-ratio model fits better to the data (LRT p<0.05) are marked with an asterisk.
References
- Allendorf, F.W., Hohenlohe, P.A. and Luikart, G., 2010. Genomics and the future of conservation genetics. Nat. Rev. Genet., 11: 697-709. https://doi.org/10.1038/nrg2844[CrossRef]
- Barker, F.K., Be-Nesh, M.K., Vandergon, A.J. and Lanyon, S.M., 2012. Contrasting evolutionary dynamics and information content of the avian mitochondrial control region and ND2 gene. PLoS One, 7: e46403. https://doi.org/10.1371/journal.pone.0046403[CrossRef]
- Bernt, M., Donath, A., Juhling, F., Externbrink, F., Florentz, C., Fritzsch, G., Putz, J., Middendorf, M. and Stadler, P.F., 2013. MITOS: Improved de novo metazoan mitochondrial genome annotation. Mol. Phylogenet. Evol., 69: 313-319. https://doi.org/10.1016/j.ympev.2012.08.023[CrossRef]
- Botero-Castro, F., Figuet, E., Tilak, M.K., Nabholz, B. and Galtier, N., 2017. Avian genomes revisited: Hidden genes uncovered and the rates versus traits paradox in birds. Mol. Biol. Evol., 34: 3123-3131. https://doi.org/10.1016/j.ympev.2012.08.023[CrossRef]
- Burland, T.G., 2000. Dnastar’s Lasergene sequence analysis software. Method Mol. Boil., (Clifton, N.J.), 132: 71-91. https://doi.org/10.1385/1-59259-192-2:71[CrossRef]
- Cadahia, L., Pinsker, W., Negro, J.J., Pavlicev, M., Urios, V. and Haring, E., 2009. Repeated sequence homogenization between the control and pseudo-control regions in the mitochondrial genomes of the subfamily Aquilinae. J. exp. Zool. B Mol. Dev. Evol., 312B: 171-185. https://doi.org/10.1002/jez.b.21282[CrossRef]
- Cheng, Y.Z., Wang, R.X., amd Xu, T.J., 2011. The mitochondrial genome of the spinyhead croaker Collichthys lucida: Genome organization and phylogenetic consideration. Mar. Genom., 4: 17-23. https://doi.org/10.1016/j.margen.2010.12.001[CrossRef]
- Debela, M.T., Wu, Q., Li, Z., Sun, X. and Li, Y., 2021. Habitat suitability assessment of wintering herbivorous Anseriformes in Poyang Lake, China. Diversity (Basel), 13: 171. https://doi.org/10.3390/d13040171[CrossRef]
- Dierckxsens, N., Mardulyn, P. and Smits, G., 2017. NOVOPlasty: De novo assembly of organelle genomes from whole genome data. Nucl. Acids Res., 45: e18. https://doi.org/10.1093/nar/gkw955[CrossRef]
- Donne-Goussé, Carole, Laudet, Vincent and Hänni, Catherine, 2002. A molecular phylogeny of anseriformes based on mitochondrial DNA analysis. Mol. Phylogenet. Evol., 23: 339-356. https://doi.org/10.1016/S1055-7903(02)00019-2[CrossRef]
- Fain, M.G., Krajewski, C. and Houde, P., 2007. Phylogeny of core Gruiformes (Aves: Grues) and resolution of the Limpkin–Sungrebe problem. Mol. Phylogenet. Evol., 43: 515-529. https://doi.org/10.1016/j.ympev.2007.02.015[CrossRef]
- Gao, Y., Miao, Y., Su, X., Chi, Z., Yu, B., and Jiang, F., 2009. A comprehensive analysis on 74 avian mitochondrial genome base compositions. J. Yunnan Agric. Univ., 24: 51-58. https://doi.org/10.1360/972009-1142[CrossRef]
- García, R.J.C., Gibb, G.C., and Trewick, S.A., 2014. Eocene diversification of crown group rails (Aves, Gruiformes, Rallidae). PLoS One, 9: e109635-e109635. https://doi.org/10.1371/journal.pone.0109635[CrossRef]
- Gonzalez, J., Düttmann, H., and Wink, M., 2009. Phylogenetic relationships based on two mitochondrial genes and hybridization patterns in Anatidae. J. Zool., 279: 310-318. https://doi.org/10.1111/j.1469-7998.2009.00622.x[CrossRef]
- Hu, C.C., Zhang, C.L., Sun, L., Zhang, Y., Xie, W.L., Zhang, B.W. and Chang, Q., 2017. The mitochondrial genome of pin-tailed snipe Gallinago stenura, and its implications for the phylogeny of Charadriiformes. PLoS One, 12: e0175244-e0175244. https://doi.org/10.1371/journal.pone.0175244[CrossRef]
- Janssen, R.J., Van Den Heuvel, L.P., and Smeitink, J.A., 2004. Genetic defects in the oxidative phosphorylation (OXPHOS) system. Exp. Rev. mol. Diagn., 4: 143-156. https://doi.org/10.1586/14737159.4.2.143[CrossRef]
- Jetz, W., Thomas, G.H., Joy, J.B., Hartmann, K., and Mooers, A.O., 2012. The global diversity of birds in space and time. Nature, 491: 444-448. https://doi.org/10.1038/nature11631[CrossRef]
- Jiang, F., Miao, Y., Liang, W., Ye, H., Liu, H. and Liu, B., 2009. The complete mitochondrial genomes of the whistling duck (Dendrocygna javanica) and black swan (Cygnus atratus): dating evolutionary divergence in Galloanserae. Mol. Boil. Rep., 37: 3001-3015. https://doi.org/10.1360/972009-1142[CrossRef]
- Jin, X., Wang, R., Xu, T. and Shi, G., 2012. Complete mitochondrial genome of Oxuderces dentatus (Perciformes, Gobioidei). Mitochondrial DNA, 23: 142-144. https://doi.org/10.3109/19401736.2012.660930[CrossRef]
- Johnsgard, P.A., 1966. Handbook of waterfowl behavior. Handb. Waterf. Behavior, 37: 860. https://doi.org/10.2307/4511272[CrossRef]
- Johnsgard, P.A., 2010. Ducks, geese, and swans of the world: Tribe Mergini (Sea Ducks). Paul johnsgard.
- Lavretsky, P., Wilson, Robert, E., Talbot, Sandra, L. and Sonsthagen, S.A., 2021. Phylogenomics reveals ancient and contemporary gene flow contributing to the evolutionary history of sea ducks (Tribe Mergini). Mol. Phylogenet. Evol., 161: 107164. https://doi.org/10.1016/j.ympev.2021.107164[CrossRef]
- Lecroy, M. and Barker, F.K., 2006. A new species of bush-warbler from Bougainville Island and a monophyletic origin for Southwest Pacific Cettia. Am. Mus. Novit., 3511: 1-20. https://doi.org/10.1206/0003-0082(2006)3511[1:ANSOBF]2.0.CO;2[CrossRef]
- Lei, Z., 2015. Advances on the mitochondrial genome and phylogeny of Aves. J. Wuhu Inst. Technol.,
- Liu, G., Zhou, L.Z., and Gu, C.M., 2012. Complete sequence and gene organization of the mitochondrial genome of scaly-sided merganser (Mergus squamatus) and phylogeny of some Anatidae species. Mol. Biol. Rep., 39: 2139-2145. https://doi.org/10.1007/s11033-011-0961-5[CrossRef]
- Liu, G., Zhou, L., Li, B., and Zhang, L., 2014. The complete mitochondrial genome of Aix galericulata and Tadorna ferruginea: Bearings on their phylogenetic position in the Anseriformes. PLoS One, 9: e109701. https://doi.org/10.1371/journal.pone.0109701[CrossRef]
- Liu, W., Hu, C., Xie, W., Chen, P., Zhang, Y., Yao, R., Li, K., and Chang, Q., 2018. The mitochondrial genome of red-necked phalarope Phalaropus lobatus (Charadriiformes: Scolopacidae) and phylogeny analysis among Scolopacidae. Genes Genomics, 40: 455-463. https://doi.org/10.1007/s13258-017-0632-6[CrossRef]
- Livezey, B.C., 1986. A phylogenetic analysis of recent anseriform genera using morphological characters. Auk, 103: 737-754. https://doi.org/10.1371/journal.pone.0184529[CrossRef]
- Livezey, B.C., 1997. A phylogenetic classification of waterfowl (Aves, Anseriformes), including selected fossil species. Annls Carnegie Mus., 66: 457-496. Available: https://www.biodiversitylibrary.org/part/215141
- Luo, Y., Yang, X., and Gao, Y., 2013. Mitochondrial DNA response to high altitude: a new perspective on high-altitude adaptation. Mitochondrial DNA, 24: 313-319. https://doi.org/10.3109/19401736.2012.760558[CrossRef]
- Nabholz, B., Glémin, S., and Galtier, N., 2008. Extreme variation of mtDNA neutral substitution rate across mammalian species the longevity hypothesis. Mol. Biol. Evol., 25: 795-795. https://doi.org/10.1186/1471-2148-8-20[CrossRef]
- Nadeau, N.J., Burke, T., and Mundy, N.I., 2007. Evolution of an avian pigmentation gene correlates with a measure of sexual selection. Proc. R. Soc. B Biol. Sci., 274: 1807-1813. Available: http://www.jstor.org/stable/25249253, https://doi.org/10.1098/rspb.2007.0174[CrossRef]
- Nylander, J.A., Ronquist, F., Huelsenbeck, J.P., and Nieves-Aldrey, J., 2004. Bayesian phylogenetic analysis of combined data. Syst. Boil., 53: 47-67. https://doi.org/10.1080/10635150490264699[CrossRef]
- Peng, C., Yuqing, H., Chaoying, Z., Bin, G., and Luzhang, R., 2017. Complete mitochondrial genome of Porzana fusca and Porzana pusilla and phylogenetic relationship of 16 Rallidae species. Genetica. https://doi.org/10.1371/journal.pone.0109635[CrossRef]
- Perna, N.T. and Kocher, T.D., 1995. Unequal base frequencies and the estimation of substitution rates. Mol. Biol. Evol., 2: 359-361. https://doi.org/10.1093/oxfordjournals.molbev.a040211[CrossRef]
- Peters, J.L., Bolender, K.A., and Pearce, J.M., 2012. Behavioural vs. molecular sources of conflict between nuclear and mitochondrial DNA: the role of male-biased dispersal in a Holarctic sea duck. Mol. Ecol., 21: 3562-3575. https://doi.org/10.1111/j.1365-294X.2012.05612.x[CrossRef]
- Ponomarenko, O., Banik, M., and Zhukov, O., 2021. Assessing habitat suitability for the common pochard, (Anseriformes, Anatidae) at different spatial scales in Orel’River Valley, Ukraine. Ekológia (Bratislava), 40: 154-162. https://doi.org/10.2478/eko-2021-0018[CrossRef]
- Ren, Q., Yuan, J., Ren, L., Zhang, L., Zhang, L., Jiang, L., Chen, D., Kan, X., and Zhang, B., 2014. The complete mitochondrial genome of the yellow-browed bunting, Emberiza chrysophrys (Passeriformes: Emberizidae), and phylogenetic relationships within the genus Emberiza. J. Genet., 93: 699-707. https://doi.org/10.1007/s12041-014-0428-2[CrossRef]
- Ringelman, Kevin, and M., 2015. Ducks, geese, and swans of North America. J. Field Ornithol. J. Ornithol. Invest., https://doi.org/10.1093/sysbio/sys029[CrossRef]
- Ronquist, F., Teslenko, M., Van Der Mark, P., Ayres, D.L., Darling, A., Höhna, S., Larget, B., Liu, L., Suchard, M.A., and Huelsenbeck, J.P., 2012. MrBayes 3.2: Efficient Bayesian phylogenetic inference and model choice across a large model space. Syst. Biol., 61: 539-542. https://doi.org/10.1093/sysbio/sys029[CrossRef]
- Roques, S., Godoy, J.A., Negro, J.J., and Hiraldo, F., 2004. Organization and variation of the mitochondrial control region in two vulture species, Gypaetus barbatus and Neophron percnopterus. J. Hered., 95: 332-337. https://doi.org/10.1093/jhered/esh047[CrossRef]
- Ruan, L., Xu, W., Han, Y., Zhu, C., Guan, B., Xu, C., Gao, B., and Zhao, D., 2018. Gene flow from multiple sources maintains high genetic diversity and stable population history of Common Moorhen Gallinula chloropus in China. Ibis, 160: 855-869. https://doi.org/10.1111/ibi.12579[CrossRef]
- Saldanha, A.J., 2004. Java Treeview-extensible visualization of microarray data. Bioinformatics, 20: 3246-3248. https://doi.org/10.1002/acp.1211[CrossRef]
- Saraste, M., 1999. Oxidative phosphorylation at the fin de siecle. Science, 283: 1488-1493. https://doi.org/10.1002/acp.1211[CrossRef]
- Savard, J.P.L., Reed, A., and Lesage, L., 1998. Brood amalgamation in surf scoters Melanitta perspicillata and other Mergini. Wildfowl, 49: 129-138. https://doi.org/10.2173/tbna.363.p[CrossRef]
- Scribner, K.T., Petersen, M.R., Fields, R.L., Talbot, S.L., Pearce, J.M., and Chesser, R.K., 2001. Sex-biased gene flow in spectacled eiders (Anatidae): Inferences from molecular markers with contrasting modes of inheritance. Evolution, 55: 2105-2115. https://doi.org/10.1111/j.0014-3820.2001.tb01325.x[CrossRef]
- Shen, Y.Y., Shi, P., Sun, Y.B., and Zhang, Y.P., 2009. Relaxation of selective constraints on avian mitochondrial DNA following the degeneration of flight ability. Genome Res., 19: 1760-1765. https://doi.org/10.1101/gr.093138.109[CrossRef]
- Sonsthagen, S.A., Talbot, S.L., Scribner, K.T., and McCracken, K.G., 2011. Multilocus phylogeography and population structure of common eiders breeding in North America and Scandinavia. J. Biogeogr., 38: 1368-1380. https://doi.org/10.1111/j.1365-2699.2011.02492.x[CrossRef]
- Sruoga, A., Slavenaite, S., Butkauskas, D., and Grazulevicius, G., 2008. Cross species applicability of microsatellite markers for investigation of sea ducks (Mergini) genetic differentiation. Proc. Latvian Acad. Sci. De Gruyter Poland. https://doi.org/10.1111/j.1365-2699.2011.02492.x[CrossRef]
- Starkov, A.A., 2008. The role of mitochondria in reactive oxygen species metabolism and signaling. Annls N. Y. Acad. Sci., 1147: 37-52. https://doi.org/10.1196/annals.1427.015[CrossRef]
- Stoletzki, N. and Eyre-Walker, A., 2011. The positive correlation between d N/d S and d S in mammals is due to runs of adjacent substitutions. Mol. Biol. Evol., 28: 1371-1380. https://doi.org/10.1093/molbev/msq320[CrossRef]
- Sun, Z., P. Tao, C. Hu, S. Lu, and B. Zhang, 2017. Rapid and recent diversification patterns in Anseriformes birds: Inferred from molecular phylogeny and diversification analyses. PLoS One, 12: e0184529. https://doi.org/10.1371/journal.pone.0184529[CrossRef]
- Swofford, D. L., 2003. PAUP*. Phylogenetic analysis using parsimony (*and other methods) version 4. Sinauer, Sunderland, Massachusetts, USA. Nat. Biotechnol., 18: 233-234.
- Tamura, K., Peterson, D., Peterson, N., Stecher, G., Nei, M., and Kumar, S., 2011. MEGA5: Molecular evolutionary genetics analysis using maximum likelihood, evolutionary distance, and maximum parsimony methods. Mol. Biol. Evol., 28: 2731-2739. https://doi.org/10.1093/molbev/msr121[CrossRef]
- Tang, Y., Zhang, X.Y., Ma, Y.Y. and Zheng, X.D., 2021. Descriptive study of the mitogenome of the diamondback squid (Thysanoteuthis rhombus Troschel, 1857) and the evolution of mitogenome arrangement in oceanic squids. J. Zool. Syst. Evol. Res., 59: 981-991. https://doi.org/10.1111/jzs.12478[CrossRef]
- Thompson, J.D., Gibson, T.J., Plewniak, F., Jeanmougin, F., and Higgins, D.G., 1997. The CLUSTAL_X windows interface: Flexible strategies for multiple sequence alignment aided by quality analysis tools. Nucl. Acids Res., 25: 4876-4882. https://doi.org/10.1093/nar/25.24.4876[CrossRef]
- Torroni, A., Rengo, C., Guida, V., Cruciani, F., Sellitto, D., Coppa, A., Calderon, F.L., Simionati, B., Valle, G., and Richards, M., 2001. Do the four clades of the mtDNA haplogroup L2 evolve at different rates? Am. J. Hum. Genet., 69: 1348-1356. https://doi.org/10.1086/324511[CrossRef]
- Wolstenholme, D.R., 1992. Genetic novelties in mitochondrial genomes of multicellular animals. Curr. Opin. Genet. Dev., 2: 918-925. https://doi.org/10.1016/S0959-437X(05)80116-9[CrossRef]
- Yang, R., Wu, X., Yan, P., Su, X., and Yang, B., 2010. Complete mitochondrial genome of Otis tarda (Gruiformes: Otididae) and phylogeny of Gruiformes inferred from mitochondrial DNA sequences. Mol. Biol. Rep., 37: 3057-3066. https://doi.org/10.1007/s11033-009-9878-7[CrossRef]
- Zhang, J., Nielsen, R., and Yang, Z., 2005. Evaluation of an improved branch-site likelihood method for detecting positive selection at the molecular level. Mol. Biol. Evol., 22: 2472-2479. https://doi.org/10.1093/molbev/msi237[CrossRef]
- Zhu, B.R., Verkuil, Y.I., Conklin, J.R., Yang, A., Lei, W., Alves, J.A., Hassell, C.J., Dorofeev, D., Zhang, Z., and Piersma, T., 2021. Discovery of a morphologically and genetically distinct population of black-tailed Godwits in the East Asian-Australasian flyway. Ibis, 163: 448-462. https://doi.org/10.1111/ibi.12890[CrossRef]
Supplementary material
Services
Article usage statistics
Loading…