Research Article · Volume 13, Issue 2, 20 January 2025 · Open Access
Characteristics of Ammonia Gas Emission in the Laying Hen Farming Industry in Indonesia
· · ·
Affiliations & Notes ⌄
1Department of Animal Science, Agricultural Development Polytechnic of Gowa, Indonesia
2Doctoral Student of Animal Science Study Program, Faculty of Animal Science, Hasanuddin University, Indonesia. *Correspondence | Muhammad Irfan Said, Departmen of Animal Science, Faculty of Animal Science, Hasanuddin University, Indonesia
3Email: irfanunhas@gmail.com
4Departmen of Animal Science, Faculty of Animal Science, Hasanuddin University, Indonesia
Wind speed and air ammonia levels are strongly correlated, while population, cage height, and cage area are moderately correlated.
Low air ammonia levels are partially and simultaneously present in layer chicken farms with high wind speed, population, and cage position conditions.
Farmers may implement this action to control the ammonia gas concentration surrounding the cage and prevent it from lowering the productivity of laying chickens.
The government, partner businesses, and other relevant parties can use the study’s findings as a guide to establish regulations or implement policies for safe and good laying hen farm construction complexes, which would help stop the spread of ammonia gas emissions.
Selected from the article's own text.
Abstract
The huge number of laying hens impacts the output of livestock waste, especially manure. Ammonia (NH3) and other volatile compounds are the main culprits behind manure odor. High ammonia emissions will harm laying hens’ health and decrease their egg-producing efficiency. This study aims to determine the factors that influence NH3 emissions in the agricultural sector of laying hens, specifically in Sidrap Regency. This study uses quantitative techniques to ascertain how the independent variable (X) affects the dependent variable (Y) in the four sub-districts of Sidrap Regency, Maritengngae, Pitu Riawa, Kulo, and Watang Pulu. Data was gathered from 96 units on laying hen farms. Ammonia (NH3) emissions (variable Y) were measured, and data was instantly collected using the Ammonia Gas Detector Smart Sensor AR8500 device. The 11 X variables are divided into three-factor categories: feed factors (feed consumption, feed protein content, seasonal factors (temperature, humidity, wind speed, and THI); cage systems and management factors (Population, cage density, cage area height, cage height, and length of time manure accumulate). Multiple linear regression analysis was used to determine which factors had the most influence on the farm’s manure ammonia levels, and correlation analysis was used to find interactions between groupings of factors. Ammonia emissions surrounding the cage are partially and simultaneously reduced by higher wind speed values, population, and cage height, as indicated by the regression equation NH3 = 12.343 – 0.771 Wind Speed – 0.0001 Population – 0.552 Cage Height. Information on the factors that influence air ammonia levels may be used to suggest ways that laying hen farms may reduce the effects of ammonia gas emissions. The findings of this study can also serve as a guide for the government, affiliated businesses, and other relevant stakeholders to establish guidelines or criteria for safe and high-quality laying hen farm construction complexes and control the spread of ammonia gas emissions.
The population of laying hens is growing annually due to rising consumer demand for animal protein, particularly for commodities like eggs. According to information gathered by the Directorate General of Animal Husbandry and Animal Health, there were 308.6 million laying hens in Indonesia in 2022. This information is in line with the 6.2 million tons of eggs produced in 2022, of which laying hens account for 88.89%, or roughly 5.6 million tons . In the production phase, laying hens create around 150 grams of manure per head per day, according to Tańczuk et al. (2019). Assuming the population, laying hens may produce 46.3 thousand tons of manure daily in Indonesia. Considering the huge emissions from poultry manure, this amount is extremely substantial.
South Sulawesi Province, which is primarily in Sidrap Regency, is one of the regions in Indonesia that produces the largest quantity of eggs. According to BPS Kabupaten Sidenreng Rappang (2023), there were 3.98 million laying hens in Sidrap Regency in 2022, spread across 11 sub-districts. Increased output of livestock waste, particularly manure, is a result of this large population. A daily total of 59.7 tons of manure can be produced. According to Wyer et al. (2022), this relatively high manure production has the potential to produce emissions at levels high enough to pollute the environment, harm workers and livestock, and, at even higher levels, contribute to the thinning of the ozone layer through the greenhouse effect these emissions produce . The cage system used by the majority of laying hen farms in Sidrap Regency is still an open-house style; therefore, this negative impact has a very high potential there. Uncontrolled manure emissions and odor spread are impacted by this cage model.
Since ammonia can have detrimental effects on the health of both humans and animals, it is one of the basic chemicals found in manure that is most extensively studied. Both the hydrolysis of uric acid and the microbial decomposition of organic compounds in excrement that contain nitrogen can produce NH3. Evaporation of liquid ammonia results in the creation of NH3, a soluble and reactive gas ; .
NH3 readily dissolves in water and reacts chemically with other chemicals to generate molecules that include ammonium. The largest concentration of NH3 in the atmosphere is caused by intensive livestock production . Inappropriate feed composition that contains too much protein and amino acids can cause poultry feces to smell strong. Only one-third of the necessary nitrogen reaches the tissues and eggs; the other two-thirds are ejected .
Most of the dung that birds excrete will either mineralize into ammonium (NH4+) or transform into NH3. If poultry dung falls on a solid surface without being covered with litter, it will turn into sludge since it is a mixture of solid manure and pee. Manure sludge can release gases such as nitrogen gas (N2), nitrogen dioxide (N2O), and NH3 through enzymatic and bacterial breakdown . Numerous factors, including livestock (genetics, feeding management, behavior, activity, and behavior); waste (handling, pH, temperature, and surface area); environment (temperature inside and outside the cage, ventilation flow, and wind speed above the surface manure); location; and cage floor type, all contribute to the formation and release of NH3 ; .
One important aspect impacting NH3 gas release is climate; high temperatures and humidity in the cage environment will cause ammonia gas emissions to increase ; . Since air flows around the cage in open-house cage systems, wind speed also significantly impacts how ammonia gas spreads . The amount of protein in the feed is another determinant, while undigested protein is still the precursor to ammonia production. Cage management, including how feces are handled and cage models that are made to reduce the effects of ammonia gas on animals, is an additional factor ; .
Both humans and livestock are negatively impacted by ammonia (NH3). Ammonia (NH3) may lead to skin, eye, nose, throat, and upper respiratory tract infections and irritations in laying hens. Furthermore, elevated levels of NH3 may cause respiratory system injury (air sac inflammation) and lower feed intake, which in turn lowers live weight, egg production, and quality ; . Another consequence is that chickens are more vulnerable to infection by the Newcastle Disease virus and the bacterium Mycoplasma gallisepticum . Ammonium hydroxide (NH4OH), which is created when NH3 dissolves in water and enters the eyes, can result in red eyes, keratoconjunctivitis, swelling of the eyelids, a corneal injury that makes it difficult for the chicken to open its eyes, and trouble reaching food and water . Body weight, feed intake, and feed conversion ratio (FCR) will all decrease as a result . Based on the number of laying hens in the district, Sidrap Regency has a high potential for ammonia gas emissions to spread. However, a comprehensive study has yet to be conducted to determine the extent of emissions and the factors that contribute to their spread. By this, the study was carried out as foundational research to ascertain how various parameters, including climate, diet, and cage system, relate to ammonia gas levels and to identify the most significant factors.
MATERIALS AND METHODS
Data Collection
This study uses a quantitative approach to determine how independent and dependent variables affect each other. The study was conducted in May 2024. The study was conducted in four districts of Sidrap Regency—Maritengngae, Pitu Riawa, Kulo, and Watang Pulu—that had the greatest concentration of laying hen farms. Since the population can generate a significant amount of fecal waste, which can result in emissions that have an effect, the study’s population consisted of laying hen farms with 500–20,000 laying chickens. The study had 127 farms as its population. Using the Slovin formula, the number of samples collected was calculated . The study’s sample size consisted of 96 farm units, or 75.59% of the total number of farms in Sidrap Regency, based on a total of 127 populations. Potential biases or limitations in the data collection process may be experienced by sudden changes in wind speed and direction. This can happen because the object being measured is a gaseous object. Therefore, researchers need to be careful when reading the values of the measuring instrument used. Reading the values always uses a stable condition basis, such as relatively stable wind speed and direction.
Independent Variable (X)
Climate factors (X1): Climate-related factors (X1). Temperature (°C), humidity (g/m3), wind speed (m/s), and temperature humidity index (THI) are climate parameters. An Elitech DT-3 Thermohygrometer measured the farms’ temperature and humidity. A digital anemometer was used to measure the wind speed around the fields. The formula THI = 0.8 x T + ((RH x T)/500) is used to determine THI .
Dietary factors (X2): The feed consumption (g/h/day) and diet protein content (%) are two components that make up the dietary factor. The difference between the amount of food provided and consumed in a single day is used to calculate daily feed consumption.
Management and housing system factors (X3): Population (head), stocking density (head/cage), farm area height (masl), cage height (m), and the length of time manure accumulates in the cage (times/year) are management parameters and housing systems. The number of hens per cage unit is a measure of stocking density. The number of times manure is retrieved from the cage floor in a year determines the manure collecting time.
Dependent Variable (Y)
Ammonia emissions (ppm) (Y1). Ammonia (NH3) emissions in the cage are measured using an Ammonia Gas Detector Smart Sensor AR8500 system.
Statistical Analysis
Pearson correlation analysis: An appropriate statistical method for determining the linear correlation between two variables is Pearson’s correlation coefficient. This investigation demonstrates the degree of their relationship. For variables X and Y, the experiment yielded two sets of data: X = [X1, X2, X3, Xn] and Y = [Y1, Y2, Y3.Yn]. The symbol “r” represents the correlation coefficient. The Pearson correlation range describes the degree of direct association or component connectedness between two variables, which runs from +1 to -1. According to Zhi et al. (2018), a relationship denotes a strong positive correlation between the variables or that the samples essentially have the same structure. In contrast, a relationship of -1 denotes a strong negative correlation or that the sample structures differ. This study’s analysis aimed to determine how each variable in the climate factor group, feed, management, and cage system (X) related to the ammonia gas level variable (Y).
Multiple Linear Regression Analysis
To ascertain the degree to which models including multiple independent variables influenced the dependent variable, multiple linear regression analysis was performed on the models . The following is the multiple linear regression equation utilized in this study:
Y = a + b1X1+ b2X2+ b3X3 +e
Where:
Y= Ammonia (NH3) emissions (Y)
a= Constant numbers
b1= Regression coefficients of climate
X1= Climate factors
b2= Regression coefficients of diet
X2= Dietary factors
b3= Regression coefficients of management and housing system
X3= Management and housing system factors
e = Error factor
F-test (simultaneous test):The impact of the independent factors on the dependent variable is examined using the F-test. Simultaneous hypothesis testing is used in this study to gauge how much each independent variable affects NH3 emissions. Comparing the Fcount value with the Ftable at a 5% error degree (a = 0.05) was how the test was conducted. The independent variable concurrently significantly impacts the dependent variable if Fcount > Ftable value .
T-test (partial test): To determine whether variable X independently affects the dependent variable Y, the t-test is utilized. By examining the t values of each independent variable, this test can also determine the degree to which each one influences the dependent variable. The t value indicates which independent variable influences the dependent variable most .
Coefficient of determination (R2): The percentage contribution of the independent variables’ influence on the dependent variable is determined using the coefficient of determination (R²). The following is the formula for the coefficient of determination .
CD = R² × 100%
Where;
CD = coefficient of determination
R² = correlation coefficient squared
RESULTS AND DISCUSSION
Ammonia (NH3) Emissions, Climate, Dietary, Management and Housing Systems Factors
Many factors influence ammonia (NH3) emissions. Studying these factors in more depth is important, especially when they relate to the correlation and interaction that may arise and influence each other. Climate, dietary, management, and housing systems play important roles that may influence each other. Ammonia emissions, climate conditions, dietary, management, and housing systems are among the variables included in the research results. The average, standard deviation, maximum value, and minimum value of the data are displayed in Table 1.
Table 1: Mean, standard deviation, maximum value, and minimum value of research variables.
Variables
Mean
Std. Deviation
Maximum
Minimum
Ammonia (NH3) emissions (ppm)
0.09
1.093
5.4
0
Temperature (oC)
33.47
2.203
37
29
Humidity (%)
55.91
15.763
90
30
Wind speed (m/s)
0.78
0.481
1.9
0
Temperature Humidity Index (THI)
30.46
1.282
32.9
27.94
Feed consumption (g/h/day)
116.09
4.768
120
110
Protein content %
17.28
0.451
18
17
Population (head)
10975.0
4461.330
15000
5000
Height of the Farm Area (masl)
63.03
34.883
122
19
Stocking density (h/cages)
2.01
0.827
4
1
Cage height (m)
1.25
0.554
2.5
0.5
Duration of manure accumulation (times/year)
3.47
1.809
6
0.5
Note: masl (meter above sea level).
Perdanasari et al. (2023), Table 1 shows that average NH3 emissions stay between 0.08 and 3.82 parts per million. This quantity, however, is lower than the results of research conducted by Kilic and Yaslioglu (2014), which discovered that the concentration was 1.012 ppm in laying hen farms during the summer. Temperature, humidity, wind speed, and temperature humidity index (THI) are the climate elements included in this study. The laying hens’ cage temperature in this study was more significant than the 19–22 °C range recommended by Kim et al. (2021).
Dietary parameters in this study include feed consumption and protein levels. The average feed consumption under high-efficiency conditions is about 120 g/h/day . The recommended daily dietary intake for laying hens in the layer phase is 110 g/h, per Feedmaster (2020). Within the recommended range, the feed consumption in this observation is 116.09 g/e/day. Ribeiro et al. (2016) recommend that laying hens consume 17.2% of their diet protein in the layer phase. This Figure corresponds to the protein composition of the food under study.
This finding includes the following management and housing system factors: population, farm elevation above sea level, stocking density, cage height, and length of dung buildup. The average number of laying hens per farm in this observation was 10,975. According to data on the number of households raising laying hens in Sidrap Regency in 2020, the number of farmers keeping laying hens with a population of 1000–5000 is more significant than the number of people above or below that Figure. However, the focus of this study is restricted to farmers that have between 5001 and 20,000 laying hens, which means that 10,000 laying hens are on average. The average elevation of the cage area in this investigation was 63.03 meters above sea level. According to Pemkab Sidrap (2014), the Sidrap region lies between 10 and 3000 above sea level meter (aslm), with Mount of Botto Tallu (3086 meters above sea level) being the highest point. The average laying hen stocking density is two birds per cage. According to Wan et al. (2023), laying hens should be stocked at a density of two birds per cage to produce the most eggs possible.
In this observation, the average height of the laying hen cage above the ground was 1.25 meters. This cage is shorter than the 2.03 m Hilal (2020) recommended height. In this study, the average amount of time that manure accumulated from the cage was 3.47 times per year. Weaver recommends cleaning dung in laying hen cages twice yearly (2024). This indicates that the laying hen cage’s average manure accumulation occurred more frequently than recommended during this observation.
Ammonia (NH3) Emissions in Laying Hens and their Correlation with Climate, Dietary, Management and Housing Factors
Temperature, humidity, wind speed, and temperature humidity index (THI) are examples of climate factors. Dietary considerations include the amount and consumption of protein. Housing and management parameters include population, stocking density, cage height, cage area, and manure accumulation duration. The study’s findings indicate the significance, p-value, and correlation between NH3 emissions and climate, dietary, management, and housing factors in laying hens (Table 2).
Table 2: Correlation of ammonia (NH3) emissions with climate, dietary, management and housing factors in laying hens.
Variables correlation
Correlation coefficient
p-Value
Correlation Level
NH3 - Temperature
0.155
0.066
Weak
NH3 - Humidity
-0.090
0.191
Weak
NH3 - Wind speed
-0.613
0.000
Strong
NH3 - THI
0.189
0.032
Weak
NH3 - Feed consumption
0.080
0.219
Weak
NH3 - Protein content
0.137
0.092
Weak
NH3 - Population
-0.294
0.002
Moderate
NH3 - Height of the farm area
-0.367
0.000
Moderate
NH3 –Stocking density
-0.158
0.062
Weak
NH3 – Cage height
-0.578
0.000
Moderate
NH3 - Duration of manure accumulation
0.133
0.099
Weak
Sugiyono (2013) states that correlation coefficient values of 0.60 to 0.79 are classified as strong, 0.46 to 0.59 as medium, and less than 0.46 as weak. In this category, the climate parameter that most significantly corresponds with NH3 emissions is wind speed (r=-0.613), and the correlation is statistically significant (P<0.05). The findings show that THI and other climate parameters are slightly correlated (r=0.155; r=-0.090; r=0.189). For THI, the association is substantial (P<0.05), but not for the temperature and humidity components (P>0.05).
Consumption and diet protein content had weak correlations (r=0.080 and 0.137, respectively) and were considered dietary factors with an insignificant relationship (P>0.05). Population, cage height, and cage area were significantly (P<0.05) somewhat associated with housing systems and management parameters (r=-0.294, r=-0.367, and r=-0.578, respectively). A weak correlation (r=-0.158 and r=0.133, respectively) was found between the two additional parameters, the stocking density and the length of manure buildup, with no statistically significant difference (P>0.05).
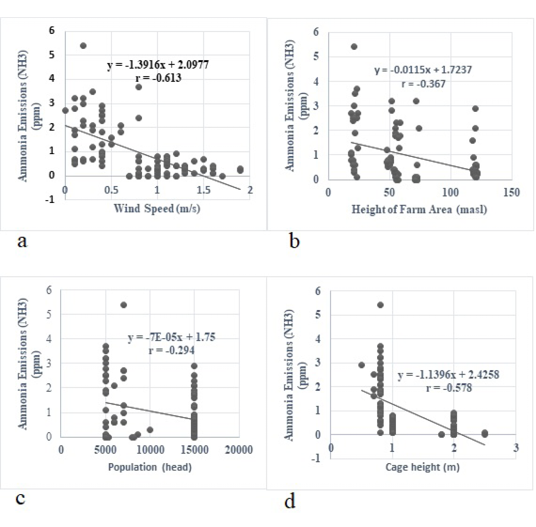
Illustrates the connection between air ammonia levels and moderately correlated variables (population, cage height, and cage area) and strongly correlated (wind speed) presented in Figure 1. There are high and moderate associations between NH3 emissions and wind speed and cage height, respectively, as shown in Figure 1a and Figure 1d. The height of the farmland (Figure 1c) and the population (Figure 1b) have a moderate association. The fact that the r value is less than 0.50, however, suggests that factors other than the farm area’s height and population account for more than 50% of the air ammonia levels. Air ammonia levels and wind speed are strongly correlated. This illustrates that the air ammonia levels in the cage decrease with increasing wind speed. Cage ventilation plays a major role in NH3 dispersion, especially in open-house dwelling systems. Wind speed significantly affects the NH3 surrounding the cage because nearly all observation farms employ open-house systems. since some NH3 was released into the farm environment’s atmosphere. Konapathri and Azimov (2024) found that the NH3 levels in the air around the cage decreased with increasing wind speed. NH3 = -1.391 wind speed +2.097 is the regression equation for this connection, which shows that wind speed influences NH3 emissions fluctuations (Figure 1a).
Another factor to consider is that the increased elevation of the cages from the ground lowers the NH3 content and simplifies managing manure. Saunders (2022) recommends utilizing “high-rise” cages for laying hens to make managing chicken waste easier. These cages are situated significantly higher above the coop floor. Based on this study, the regression equation NH3 = -1.139 cage height +2.425 (Figure 1d) shows that the NH3 levels are lower when the cages are positioned about two meters above the cage floor.
Regression of Ammonia (NH3) Emissions in Laying Hen Farms with Climate, Dietary, Management and Housing Factors
Statistical analysis to determine the relationship between factors affecting ammonia emission conditions needs to be studied more deeply. This will certainly provide an overview of these factors’ positive or negative correlation. An overview of the statistical analysis results related to the factors that influence (climate, dietary, and housing management) the amount of NH3 emissions is presented in Table 3.
Table 3: Influence of climate, dietary, management and housing factors on ammonia (NH3) emissions.
Variables
coefficient
t-value
p-value
R2
Constant
12.343
1.500
0.137
Temperature (oC)
-2.766
-1.479
0.143
Humidity (%)
-0.203
-1.500
0.137
Wind Speed (m/s)
-0.771
-3.381
0.001
Temperature Humidity Index (THI)
2.911
1.404
0.164
Feed consumption (g/h/day)
0.036
1.806
0.074
Protein content (%)
0.102
0.512
0.610
Population (head)
-0.0001
-2.847
0.006
Height of the farm area (masl)
-0.004
-1.108
0.271
Stocking density (h/cages)
-0.009
-0.031
0.976
Cage height (m)
-0.552
-2.101
0.039
Duration of manure accumulation (times/year)
0.132
1.181
0.241
Simultaneous
0.000
0.616
Note: masl (meter above sea level).
The investigation results show that wind speed has a significant (P<0.05) impact on NH3 emissions from farms, at least partially. This is because wind speed, especially in open-house housing systems, greatly affects NH3 concentration since the wind quickly disperses it. This is in line with the results of Wyer et al. (2022), who found that wind quickly deposits NH3 into the atmosphere and is highly reactive.
Population is another element that has a partial (P<0.05) impact on the cage’s NH3 emissions. This aligns with the results of Perdanasari et al. (2023), who found that larger chicken populations lead to higher levels of NH3 in the cage and more dung output. Furthermore, the cage height component had a partial effect (P<0.05) on the NH3 levels. RSPCA Assured (2017) states that the ideal cage height for laying hens is between 0.8 and 2.0 meters. This distance is calculated such that the hen is situated within the manure disposal space beneath the cage. Lower-quality eggs were produced by laying hens with health problems brought on by exposure to NH3 at concentrations higher than 50 parts per million .
The multiple linear regression analysis results show how housing, management, and climate factors affect the NH3 emissions around the cage in Table 3. The NH3=12.343-0.771; Wind Speed -0.0001; Population -0.552 Cage Height is the result of this. At the same time, 61.6% of climate parameters (wind speed) and management and housing factors (population and cage height) significantly (P<0.05) affect NH3 emissions around the farm, according to the coefficient of determination (R2) of 0.616. This formula demonstrates that the wind speed factor surrounding the cages significantly affects NH3 emissions compared to other variables.
Based on several factors contributing to the concentration of ammonia gas in cage air, farmers can implement some practical strategies to prevent the gas from spreading and minimize its negative impacts on workers and livestock. Ammonia is a chemical compound that can cause damage or inflammation. Ammonia can be contaminated by breathing and then circulate throughout the surface of the human body. Eventually, it will go to certain organs of the body. Several body organs, including the liver, lungs and blood, liver, and kidneys, can be affected. By managing the population in each cage unit according to the manure storage capacity, ammonia levels surrounding the cage can be decreased. To reduce the chance of hens becoming contaminated with manure, the cages’ height from the cage floor must also be between 0.8 and 2.0 meters. An anemometer mounted within the cage can regularly measure wind speed.
CONCLUSIONS AND RECOMMENDATIONS
Wind speed and air ammonia levels are strongly correlated, while population, cage height, and cage area are moderately correlated. Low air ammonia levels are partially and simultaneously present in layer chicken farms with high wind speed, population, and cage position conditions.
Farmers may implement this action to control the ammonia gas concentration surrounding the cage and prevent it from lowering the productivity of laying chickens. To reduce the impact of ammonia gas emissions on livestock, employees, and the surrounding community, laying chicken farms can use information related to the results of various factors that affect air ammonia levels to guide their cage building’s location, position, and direction as well as the design of the best cage model. The government, partner businesses, and other relevant parties can use the study’s findings as a guide to establish regulations or implement policies for safe and good laying hen farm construction complexes, which would help stop the spread of ammonia gas emissions. Because this study is limited and focuses on identifying the factors that play the most role in increasing ammonia gas emissions in laying hen farms, more research can be done by identifying workable solutions to maximize the reduction of ammonia gas emissions based on the recommendations of the results presented in this study.
ACKNOWLEDGMENTS
The authors would like to thank the Ministry of Agriculture, Ministry of Education, Culture, Research and Technology of the Republic of Indonesia, the Rector and Dean of the Faculty of Animal Science, Hasanuddin University, and then the Head of the Study Program of Doctoral in Animal Science Faculty for their research facilities.
NOVELTY STATEMENT
The results of previous research studies show that data related to the characteristics and distribution patterns of ammonia gas emissions in the industrial area of laying hen farming has not been found in published data and articles. The data is still limited to notes that have never been published or published in a book.
AUTHOR’S CONTRIBUTIONS
Conceptualization, Urfiana Sara, Muhammad Irfan Said, Wempie Pakiding and Sri Purwanti; investigation, Urfiana Sara; analysis and interpretation of data, Urfiana Sara, Muhammad Irfan Said, Wempie Pakiding; original draft preparation, Urfiana Sara and Sri Purwanti; review and editing, Muhammad Irfan Said, Wempie Pakiding, Sri Purwanti. project administration, Urfiana Sara; funding acquisition, Urfiana Sara, Muhammad Irfan Said, Wempie Pakiding, Sri Purwanti, authors have read and agreed to the published version of the manuscript.
Conflict of Interest
There is no conflict of interest between researchers and authors in the article preparation and publication process for this article.
Figures
Figure 1:.
Correlation of ammonia (NH3) emissions with population, wind speed, height of the farm area, and height of the cage.
References
Alberdi O, Arriaga H, Calvet S, Estellés F, Merino P (2016). Ammonia and greenhouse gas emissions from an enriched cage laying hen facility. Biosyst. Eng., 144: 1–12. https://doi.org/10.1016/j.biosystemseng.2016.01.009[CrossRef]
Bist RB, Subedi S, Chai L, Yang X (2022). Ammonia Emissions, Impacts, and Mitigation Strategies for Poultry Production: A Critical Review. J. Environ. Manage., 328(2): 1–14. https://doi.org/10.1016/j.jenvman.2022.116919[CrossRef]
BPS Kabupaten Sidenreng Rappang (2023). Kabupaten Sidenreng Rappang Dalam Angka 2023. Badan Pusat Statistik Kabupaten Sidenreng Rappang, ISSN:2528-5831, 1–340.
Brouček J, Čermák B (2015). Emission of harmful gases from poultry farms and possibilities of their reduction. Ekologia Bratislava, 34(1): 89–100. https://doi.org/10.1515/eko-2015-0010[CrossRef]
Chai L (2023). Learning for Life Agriculture and Natural Resources • Family and Consumer Sciences • 4-H Youth ugaextension.com Controlling Ammonia Generations in Poultry Houses.
Clark CEF, Akter Y, Hungerford A, Thomson P, Islam MR, Groves PJ, O’Shea CJ (2019). The intake pattern and feed preference of layer hens selected for high or low feed conversion ratio. PLoS ONE, 14(9). https://doi.org/10.1371/journal.pone.0222304[CrossRef]
Ditnakkeswan (2023). Statistik Peternakan dan Kesehatan Hewan 2023. Direktorat Jenderal Peternakan Dan Kesehatan Hewan Kementerian Pertanian, 2(ISSN 2964-1047): 1–278.
Feedmaster (2020). Layer Guide. ProPet, 1–20.
Gerber P, Opio C, Steinfeld H (2015). Poultry production and the environment-a review. Poultry in 21th Century, 1–27.
Heriyanti AP, Purwanto P, Purnaweni H, Fariz TR (2022). Greenhouse gas emissions and biogas potential from livestock in rural Indonesia. J. Pendidikan IPA Indones., 11(1): 35–46. https://doi.org/10.15294/jpii.v11i1.34465[CrossRef]
Huda NKF, Sarjana TA, Suprijatna E (2021). Atmospheric ammonia changes on different zone placement from the closed house inlet affecting broiler chicken performance in the rainy season. IOP Conference Series: Earth Environ. Sci., 803(1). https://doi.org/10.1088/1755-1315/803/1/012011[CrossRef]
Ismail IA, Lian Pernadi N, Febriyanti A (2022). How to Grab And Determine the Size of The Sample For Research. Int. J. Acad. Appl. Res.,
Jiang J, Stevenson DS, Uwizeye A, Tempio G, Sutton MA (2021). A climate-dependent global model of ammonia emissions from chicken farming. Biogeosciences, 18(1): 135–158. https://doi.org/10.5194/bg-18-135-2021[CrossRef]
Kacprzak M, Malińska K, Grosser A, Sobik-Szołtysek J, Wystalska K, Dróżdż D, Jasińska A, Meers E (2023). Cycles of carbon, nitrogen and phosphorus in poultry manure management technologies–environmental aspects. In Crit. Rev. Environ. Sci. Technol., 53(8) 914–938. https://doi.org/10.1080/10643389.2022.2096983[CrossRef]
Kilic I, Yaslioglu E (2014). Ammonia and Carbon Dioxide Concentrations in a Layer House. Asian Australas. J. Anim. Sci., 27(8): 1211–1218.
Kim E, Kim BU, Kim HC, Kim S (2021). Sensitivity of fine particulate matter concentrations in South Korea to regional ammonia emissions in Northeast Asia. Environ. Pollut., 273. https://doi.org/10.1016/j.envpol.2021.116428[CrossRef]
Konapathri R, Azimov U (2024). Assessment of ammonia distribution in a livestock farm using CFD simulations. Smart Agric. Technol., 7. https://doi.org/10.1016/j.atech.2023.100376[CrossRef]
Mažeikienė R, Bleizgys R (2022). Use of Bio-Preparations to Reduce Ammonia Emissions from Cattle Farming: Effects of Manure Storage Time and Ventilation Intensity. Agriculture (Switzerland), 12(10): 1–11. https://doi.org/10.3390/agriculture12101626[CrossRef]
Mendes LB, Pieter, JG, Snoek D, Ogink NWM, Brusselman E, Demeyer P (2017). Reduction of ammonia emissions from dairy cattle cubicle houses via improved management- or design-based strategies: A modeling approach. Sci. Total Environ., 574: 520–531. https://doi.org/10.1016/j.scitotenv.2016.09.079[CrossRef]
Mohammad Al-Kerwi MS, Mardenli O, Mahdi Jasim MR, Al-Majeed MA (2022). Effects of Harmful Gases Emitted from Poultry Houses on Productive and Health Performance. IOP Conference Series: Earth Environ. Sci., 1060(1). https://doi.org/10.1088/1755-1315/1060/1/012082[CrossRef]
Nieuwolt S (1977). Tropical Climatology: An Introduction to the Climates of the Low Latitudes. London New York Wiley.
Nowak A, Matusiak K, Borowski S, Bakuła T, Opaliński S, Kołacz R, Gutarowska B (2016). Cytotoxicity of odorous compounds from poultry manure. Int. J. Environ. Res. Public Health, 13(11): 1–15. https://doi.org/10.3390/ijerph13111046[CrossRef]
Pemkab Sidrap (2014). Kondisi Topografi Kabupaten Sidenreng Rappang. Pemerintah Daerah Kabupaten Sidenreng Rappang. https://sidrapkab.go.id/site/index.php?/Profil/detail_profil/16
Perdanasari L, Etikasari B, Rukmi DL (2023). Control system for temperature, humidity, and ammonia levels in laying hens farms based on internet of things. IOP Conference Series: Earth Environ. Sci., 1168(1). https://doi.org/10.1088/1755-1315/1168/1/012053[CrossRef]
Pohl V, Gilmer A, Hellebust S, McGovern E, Cassidy J, Byers V, McGillicuddy EJ, Neeson F, O’Connor DJ (2022). Ammonia Cycling and Emerging Secondary Aerosols from Arable Agriculture: A Eur. Ir. Perspect. Air, 1(1): 37–54. https://doi.org/10.3390/air1010003[CrossRef]
Pratiwi DM, Soemantodjo RW, Warno Utomo S (2018). Why it is often underestimated: Historical Study of Ammonia Gas Exposure Impacts towards Human Health. E3S Web Conf., 73(06003): 1–5. https://doi.org/10.1051/e3sconf/2018730[CrossRef]
Ribeiro JV, Salguero SC, Vieira RA, Silva DL, Hannas MI, Albino LFT, Rostagno HS (2016). Crude protein levels in diets for laying hens. Arch. Zootecnia, 65(250): 225–229. https://www.redalyc.org/articulo.oa?id=49545852017
RSPCA Assured (2017). RSPCA Welfare standards for Laying Hens. Royal Society for the Prevention of Cruelty to Animals Australia.
Saunders A (2022). Management of Commercial Layers in Southern Africa. South African Poultry Association.
Sugiyono (2013). Metode Penelitian Kuantitatif dan Kualitatif dan R and D. Penerbit Alfabeta, Bandung.
Swelum AA, El-Saadony MT, Abd El-Hack ME, Abo Ghanima MM, Shukry M, Alhotan RA, Hussein EOS, Suliman GM, Ba-Awadh H, Ammari AA, Taha AE, El-Tarabily KA (2021). Ammonia emissions in poultry houses and microbial nitrification as a promising reduction strategy. Sci. Total Environ., 781: 1–17. https://doi.org/10.1016/j.scitotenv.2021.146978[CrossRef]
Tańczuk M, Junga R, Kolasa-Więcek A, Niemiec P (2019). Assessment of the energy potential of chicken manure in Poland. Energies, 12(7). https://doi.org/10.3390/en12071244[CrossRef]
Ulupi N, Margisuci D, Hidayatun R, Sugiarto B (2015). Growth Performance and Production of Ammonia and Hydrogen Sulfide in Excreta of Broiler Chickens Fed Basil (Ocimum basilicum) Flour in Feed. Int. J. Poult. Sci., 14(2): 112–116.
Vilela MO, Gates RS, Souza CF, Teles Junior CGS, Sousa FC (2020). Nitrogen transformation stages into ammonia in broiler production: Sources, deposition, transformation, and emission into the environment. DYNA (Colombia), 87(214): 221–228. https://doi.org/10.15446/DYNA.V87N214.83318[CrossRef]
Wan Y, Guan H, Wang D, Ma R, Qi R, Li J, Liu W, Li Y, Zhan K (2023). Effects of cage stocking density on the production performance, serum biochemistry, immune level, and intestinal morphology of 2 laying hen breeds. J. Appl. Poult. Res., 32(4). https://doi.org/10.1016/j.japr.2023.100375[CrossRef]
Weaver A (2024). New Guide to Cleaning A Chicken Coop. The Hen House Collection by Bird-in-Hand Pet Structures. https://www.thehenhousecollection.com/blog/cleaning-a-chicken-coop/
Wyer KE, Kelleghan DB, Blanes-Vidal V, Schauberger G, Curran TP (2022). Ammonia emissions from agriculture and their contribution to fine particulate matter: A review of implications for human health. J. Environ. Manage., 323(June 2021): 116285. https://doi.org/10.1016/j.jenvman.2022.116285[CrossRef]
Zhi X, Yuexin S, Jin M, Lujie Z, Zijian D (2018). Research on the Pearson correlation coefficient evaluation method of analog signal in the process of unit peak load regulation. ICEMI : 2017 13th IEEE Int. Conf. Electron. Meas. Instrum., 365.