
The current study focuses on the physicochemical parameters including phytoplankton and zooplankton diversity of marine water ponds at Thatta district, Sindh, Pakistan. Water samples were collected monthly (Jan-Dec, 2019) from different sites of the ponds and studied the total abundance of plankton in each month. During the study, physicochemical parameters of the pond water like temperature, pH, dissolved oxygen, salinity, transparency, ammonia, phosphates, nitrates, potassium, calcium, total alkalinity and total hardness were determined. Overall, 61 species of plankton have been recorded from the studied ponds and categorized into 19 groups; of which 25 phytoplankton species belonged to four major groups, whereas, 36 zooplankton species belonged to 15 groups. Among them, Bacillariophyta (69.815%) and copepods (78.927%) were “most abundant” as compared to other groups of phytoplankton and zooplankton, respectively. Monthly abundance of phytoplankton and zooplankton was observed and the highest percentage was found in the month of November (18.559%) and July (16.560%), respectively. The optimal range of physicochemical parameters of the pond water with planktonic diversity indicates the productivity of water which is crucial for the growth of pond biota during pisciculture activities.
Research Article · Volume 38, Issue 3, 11 August 2022 · Open Access
A Preliminary Investigation of Phytoplankton and Zooplankton Diversity in Marine Water Ponds, Thatta, Sindh, Pakistan
· ·
Affiliations & Notes ⌄
- 1Centre of Excellence in Marine Biology, University of Karachi, Pakistan. *Correspondence | Asma Fatima, Centre of Excellence in Marine Biology, University of Karachi, Pakistan
- 2Email: asmafatima516@gmail.com
Article Info ⌄
- Journal:
- Sarhad Journal of Agriculture
- Published:
- 11 August 2022
From the article
- In conclusion, the studied marine water fish ponds showed differ but high abundancy of planktons in different months because they receives nutrient rich water from tidal creek.
- Thus, present study will be supportive to farmers because ponds are productive and suitable for pisciculture activities.
- However, detailed study is needed by using different fertilizers linked with primary productivity and total production of these ponds.
Selected from the article's own text.
Abstract
Introduction
Phytoplankton serves as primary producers form the base of marine food web. They transfer energy to the higher trophic level species and there is no life in the aquatic system without them. While, zooplankton graze the phytoplankton found in varying depth in the pelagic environment. The occurrence of zooplankton mainly influences the pelagic fishery potentials, like fish grow and survive in those areas where the planktonic organisms are abundant, so that their young ones can get sufficient natural food. Zooplankton indicates ecological condition because they respond changes in the nutrient level and fish population, while population of phytoplankton is totally depending on the numerous environmental factors and varying nutrient transport seasonally ; . It is verified that, plankton fulfill the nutritional requirement of farmed fish and shrimp species and also indicate the productivity of water ; . The qualitative and quantitative abundance of plankton in a fish and shrimp pond has a great importance to manage the effective aquaculture operation, because they differ from place to place and pond to pond even within the similar location and ecological condition. Water quality of pond is necessary to determine the continuous limnological change and the optimal range of physicochemical parameters of water such as temperature, pH, total hardness, alkalinity, potassium, phosphate, nitrate, sulphate, DO, and BOD show appropriateness of water which are necessary for all aquatic life ; . Moreover, water quality could directly affect the biological functions of fish such as feeding, breeding, swimming, metabolism and excretion ; . Therefore, good quality of water is indispensable for better growth, survival and high production of fish for successful aquaculture . It is consider that, quality of pond water can be deteriorated by providing excessive commercial feed and fertilizers responsible for low concentrations of DO, high concentrations of NH3, NO2 and phosphorus ; . Also, accumulation of excessive nutrients causes phytoplankton blooms in ponds, which are responsible for the polluted and anoxic condition . Apart from nutrients, fluctuation in temperature is responsible to curb primary productivity of water . Several studies have been reported on the primary productivity and water quality assessment in fresh and brackish water bodies as well as in fish and shrimp ponds by ; ; ; ; ; ; ; ; ; ; ; . Worldwide, the study of planktonic abundance has been done under the priority in aquaculture ponds to assess the health of water but no prior study was reported on marine water ponds situated at Thatta district, Sindh, except coastal water of Arabian Sea, tidal creeks, lakes and fresh water ponds in Pakistan. For that reason, present study was conducted to evaluate the diversity and abundance of phytoplankton and zooplankton along with physicochemical parameters in semi-intensive marine water ponds.
Materials and Methods
Experimental site and sampling protocol
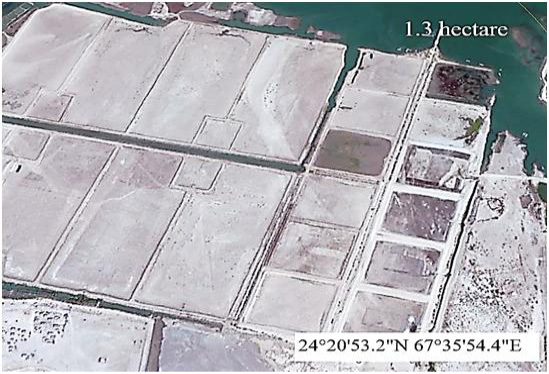
This study was investigated for a period of one year (Jan-Dec, 2019). A total of four semi-intensive marine water ponds (1.3 ha) were selected for proposed study located in Thatta district, Sindh, Pakistan (Figure 1). Seawater was directly pumped into the ponds from canal because water primarily store into the canals from thetidal creek. All ponds were stocked with commercial marine water fish juveniles (Chanos chanos, Acanthopagrus berda, and A. latus) for polyculture.
Water samples were collected monthly between 10.00 AM to 12.00 PM noon. For the quantitative findings of plankton, water (16 liters) from different selected sites was filtered from each pond via conical plankton net (56 micron), and the depth of sampling was 10 to 25 cm. Sample (120 ml) were immediately fixed into plastic bottles with (5%) formalin. Samples were carried out into Aquaculture laboratory (CEMB, University of Karachi) and examined under a compound microscope (100x). Sample analysis was consisting of 1ml subsample for up to 6mL per sample for quantitative measurement through S-R counting chamber suggested by . Each row of chamber was carefully inspected and their total number per ml were noted and calculated as a mean value. Micro-pipetting method was used for in depth analysis of plankton by using a glass slide under microscope. Planktons were identified up to the genus level. Following key guide and literatures were used for the identification of plankton ; ; ; .
Physicochemical properties of selected pond water were examined on spot before providing test feed and collecting water samples, such as temperature (°C) with thermometer (digital), pH with meter (EzDO 6011, Taiwan), transparency (cm) by Secchi disk, salinity (ppt) by refractometer (Atago, S/Mill-E, 0.100‰, Japan), ammonia and DO (mgL-1) were observed by portable test kits (Merck KGaA, 64271, Germany). Nitrate and phosphate were assessed by Boyd (1981). However, the data was analyzed through the Duncan’s new multiple test range, and were presented as mean with the standard deviation (± SD) described by Steel et al. (1997).
Results and Discussion
Water quality of fish ponds
Present study was conducted for a period of one year from January to December, 2019 for the investigation of planktonic abundance along with physicochemical characteristics of marine water ponds. It is noted that, plankton diversity is fluctuated with the physicochemical parameters of the water. So, the physical and chemical environment of the water mainly controls the diversity, species richness and population dynamics of planktons. The combined result of the physicochemical properties is presented in (Table 3). During present study, the average temperature of marine water ponds was recorded in the range of24.5 to 38.4°C. Temperature is one of the important factor that influence the plankton succession by controlling their behavioral characteristics . High atmospheric temperature speed up the evaporation rate in the water and induce positive correlation with copepods (zooplankton), because the better development of copepods were notice in warmer monthsand then deteriorate quickly, this coincide with the study of Winkler (2002), Heerkloss et al. (2005), Persaud et al. (2007), Sarkar et al. (2020). Furthermore, 18 to 38.0°C is an optimal range of water temperature for the abundance of plankton, specified by ; . Transparency is a physical parameter and it directly affects primary productivity of the water and also food web. In this study, transparency of water was recorded in the range of 27.1 to 44.8cm, while pH (7.0 to 8.5) was found in a suitable range as the pond water was well buffered and healthy during whole study period. It is reported that, pH of the pond water is likely to be higher during high photosynthetic activity by planktons . DO value was found slightly higher (5.3 to 7.5 mgL-1) and no harsh effects on plankton was recorded due to less fluctuation in DO. Although, Rukhsana et al. (2021) recommended the optimal range of DO (3.70-8.38 mg/l) for aquaculture ponds alongside Sindh coast. Similar, findings with above parameters were reported by Ali et al. (2007), Akter et al. (2015), Abbasi et al. (2016); Shoaib et al. (2017). They also specified that the temperature of the water may influence the DO level. Alkalinity can directly affect the development of plankton and the total alkalinity of our ponds was recorded in the range of 111.6 to 146.3mgL-1 (Table 3). However, the optimal alkalinity range of an average productive water of pond was 20 to 400 mg per liter as reported by Bhuiyan et al. (1970), Hossain et al. (2007); Martins et al. (2020) and Rukhsana et al. (2021). Nitrates range of our studied ponds was recorded lower (3.9 mg/l to 21.3 mg/l) than recommended range (20 to 100 mg/l) for aquaculture ponds (Pilay, 1992).
Plankton diversity
A total 61 species of plankton have been recorded from the studied ponds and categorized into 19 groups, out of which 25 species of phytoplankton were grouped into four major groups are presented in (Table 1). Among major groups, the most abundant group was Bacillariophyta comprising 18 species. In which, Rhizosolenia sp. was abundantly found in the month of (FEB31.761% to MAR-40.416%), and both Skeletonema sp. and Chaetoceros sp1 in NOV (18.518% and 31.723%), respectively. Some taxa were found in all months such as (Rhizosolenia sp., Bacillaria sp., and Oscillatoria sp1). However, the other abundant group is Cyanophyta (Oscillatoriasp1) in the month of (MAY-45.721%, JULY-42.011% to AUG-50.710%). Meanwhile, the highest mean % was found in Bacillariophyta (69.815%)>Cyanophyta (28.302%) > Dinoflagellata (1.733%) > Prymnesiophyta (0.149%), mentioned in (Table 4).
Similarly, Harrison et al. (1997) and Yaqoob et al. (2013) reported the dominant phytoplankton species belonging to Bacillariophya group from the tidal creeks of Pakistan, and also indicating the export of nutrients from tidal creeks to coastal waters of Pakistan during NE monsoon winds. Although, some authors mentioned that the dominant group of phytoplankton is Cyanophyta as compared to Bacillariophyta by ; ; . Because, Cyanophyta usually grow at high temperature while Bacillariphyta under low light or temperature as reported by ; ; ; , this statement is similar to our study results.
Table 1: Monthly distribution of Phytoplankton population (percentage of the total) in marine water ponds.
| Phyto-plankton | JAN | FEB | MAR | APR | MAY | JUN | JUL | AUG | SEP | OCT | NOV | DEC |
| Bacillario-phyta | ||||||||||||
| Bacillaria sp. | 20.714 | 17.61 | 7.501 | 4.001 | 2.9412 | 8.53 | 4.4378 | 7.109 | 5.696 | 7.3089 | 3.864 | 2.38 |
| Biddulphia sp. | - | - | - | 0.571 | 1.872 | - | 1.479 | - | 3.165 | 2.325 | - | 4.761 |
| Cosci-nodiscus sp. | 5.714 | - | - | - | 0.534 | - | 0.592 | 0.948 | - | - | - | - |
| Gyrosigma sp. | 4.285 | 13.836 | 13.333 | 13.142 | 11.229 | 7.582 | - | 7.583 | 1.266 | 1.328 | 5.153 | 4.761 |
| Nitzschia sp1. | 4.286 | 8.176 | - | 1.143 | 1.069 | 0.947 | - | 0.947 | 2.532 | 2.658 | 0.322 | - |
| Nitzschia sp2. | - | 1.572 | - | - | - | - | - | 2.844 | 5.063 | - | - | - |
| Rhizo-solenia sp. | 27.857 | 31.761 | 40.416 | 24.001 | 16.845 | 25.592 | 18.343 | 8.057 | 20.886 | 26.578 | 12.721 | 23.381 |
| Skeleto-nema sp. | 12.857 | 0.6289 | - | 15.143 | 5.882 | 9.004 | 10.059 | - | 4.43 | 6.312 | 18.518 | - |
| Chaetoceros sp1. | - | 1.572 | 5.4166 | 1.429 | 3.475 | 0.947 | 3.846 | - | 3.164 | 3.986 | 31.723 | - |
| Chaetoceros sp2. | - | - | - | 1.1429 | - | - | 1.775 | - | - | 2.657 | - | - |
| Chaetoceros sp3. | - | - | 1.25 | - | 1.069 | 7.109 | - | - | - | - | 2.254 | - |
| Navicula sp1. | 12.143 | 8.49 | 9.583 | 4.857 | 3.476 | - | - | - | - | 0.996 | 3.703 | |
| Navicula sp2. | - | 0.943 | 1.666 | 1.142 | - | - | - | - | - | 0.664 | - | |
| Cylindro-theca sp. | - | - | 0.833 | - | 0.534 | - | - | - | - | - | 0.322 | - |
| Cocconeis sp. | 1.428 | - | - | - | - | - | - | - | - | - | - | - |
| Eucampia sp. | - | - | - | 6.571 | 0.534 | 1.421 | 8.579 | 18.483 | 13.291 | 8.97 | 8.212 | - |
| Ditylum sp. | - | - | - | - | - | - | - | - | - | 0.996 | 1.771 | - |
| Thala-ssiosira sp. | 2.857 | 0.943 | - | - | - | - | - | - | - | - | 2.254 | 28.571 |
| Dino-flagellata | ||||||||||||
| Alex-andrium sp. | - | - | 2.083 | - | - | - | - | - | - | - | - | - |
| Ceratium sp. | - | - | - | - | - | - | 2.071 | - | - | 0.996 | 6.28 | - |
| Polykrikos sp. | - | 0.571 | - | 0.591 | - | - | - | - | - | |||
| Cyano-phyta | ||||||||||||
| Oscillatoria sp1. | 7.857 | 2.201 | 5 | 26.285 | 45.721 | 34.597 | 42.011 | 50.71 | 37.341 | 31.229 | 2.895 | 32.142 |
| Oscillatoria sp2. | - | - | 9.583 | - | 3.475 | 4.265 | 5.621 | 2.843 | 1.265 | 2.325 | - | - |
| Tricho-desmium sp. | - | 12.264 | 1.25 | - | 1.336 | - | 0.592 | 0.473 | 1.898 | 0.664 | - | - |
| Prymnesio-phyta | ||||||||||||
| Coccolithus sp. | - | - | 2.083 | - | - | - | - | - | - | - | - | - |
*Values are the mean of all ponds. Jan- Dec means (January to December-2019); (-) indicated absent.
About 36 zooplankton species belonging to fifteen major groups are presented in (Table 2). The most dominant group was found Copepoda (78.927%) mentioned in (Table 4). The abundancy of copepod species have been reported globally by many authors ; ; ; . However, 68% to 74.9% copepod abundance was reported from Pakistani coastal areas ; . Among copepods, the dominant order was Calanoida > Cyclopoida > Harpacticoida, and they were abundant in different months, while their females carrying egg sacs in different months. Present study coincides with the results of . Although, nauplii stage of copepods was abundantly found in the month of (FEB-39.895% to MAY 36.639%). Although, other dominant occurrences of zooplankton were medusa in the month of (JAN-67.049%), while their mean % was 7.576 after copepods (Table 4), Tintinnida (NOV30.707%) and Foraminiferans (OCT-10.311% to NOV-10.054%). Some taxa found in all months such as copepoda, nematoda and other unspecified taxa (unidentified eggs), shown in (Table 2). Our results indicated various planktonic forms specifies healthy ecological condition of the marine water fish ponds.
Overall percentage of phytoplankton and zooplankton diversity were recorded during sampling and their monthly distribution is presented in (Tables 5). The highest abundancy of phytoplankton was found in the month of November (18.559%), while zooplankton in the month of July (16.560%). The lowest abundancy
Table 2: Monthly distribution of Zooplankton population (percentage of the total) in marine water ponds.
| Zoop-lankton | JAN | FEB | MAR | APR | MAY | JUN | JUL | AUG | SEP | OCT | NOV | DEC |
| Scyphozoa | ||||||||||||
| Medusae | 67.049 | 1.214 | 0.281 | 0.418 | 1.619 | 1.734 | 0.649 | - | 0.125 | 0.693 | 13.315 | 7.017 |
| Decapoda | ||||||||||||
| Penaeid mysis | 3.302 | 1.474 | 0.337 | - | - | - | - | - | 0.125 | - | - | - |
| Penaeid nauplii | - | - | - | - | - | - | 0.173 | 0.347 | 0.543 | |||
| Lucifer sp. | - | - | - | - | - | - | - | - | - | 0.173 | - | - |
| Euphausiid juveniles (krill) | 0.287 | - | - | - | - | - | - | - | 0.125 | - | - | - |
| Brachyura larvae (crabs) | - | - | - | - | - | - | - | 0.261 | 0.125 | 0.173 | 0.543 | |
| Phyllosoma larvae (lobsters) | - | - | 0.224 | 0.139 | - | - | - | - | - | - | - | - |
| Copepoda | ||||||||||||
| Calanoid (commonly Acartia, Pseudo-calanus) | 6.891 | 13.53 | 20.911 | 51.012 | 26.417 | 18.497 | 57.885 | 63.992 | 48.185 | 31.369 | 11.141 | 12.28 |
| Cyclopoid (commonly Oithona) | 5.887 | 13.443 | 24.733 | 10.956 | 20.951 | 5.202 | 11.308 | 6.457 | 30.162 | 20.17 | 13.315 | 26.315 |
| Harpacticoid (commonly Clytemestra) | 2.727 | 14.223 | 17.201 | 4.676 | 3.846 | 20.809 | 6.239 | 2.478 | 5.569 | 1.126 | 2.717 | 1.754 |
| Cyclopoid (F) | 0.071 | - | - | 0.558 | - | - | - | - | 0.438 | 0.693 | - | - |
| Calanoid (F) | 0.143 | - | 0.112 | - | 0.101 | 0.578 | - | - | 0.062 | 0.433 | - | - |
| Harpacticoid (F) | - | 0.52 | 0.112 | - | - | 1.734 | 0.086 | - | - | - | 0.271 | - |
| Nauplii stage | 3.876 | 39.895 | 22.034 | 26.727 | 36.639 | 8.67 | 13.995 | 20.352 | 7.697 | 15.771 | 9.51 | 17.542 |
| Egg sacs | - | - | 0.393 | 0.069 | 0.202 | 1.734 | - | - | - | 0.173 | - | - |
| Cladocera | ||||||||||||
| Evadne sp. | 0.646 | 0.693 | 2.192 | 0.418 | 0.506 | 1.156 | 0.5199 | 0.391 | - | - | - | - |
| Tintinnida | ||||||||||||
| Rhabdonella sp. | - | 0.173 | - | - | - | - | 0.129 | 0.848 | - | 1.559 | 1.086 | - |
| Tintinnopsis sp. | 0.43 | 0.173 | 0.112 | - | - | 1.156 | 1.213 | 2.283 | 0.375 | 6.412 | 30.707 | - |
| Forami-nifera | ||||||||||||
| Globigerina sp. | - | - | 0.224 | 0.348 | 0.303 | 1.156 | 1.949 | 0.717 | 0.188 | - | 0.543 | 15.789 |
| Fora-miniferans (Others) | 3.0868 | 1.994 | 1.1804 | 2.163 | 1.315 | 12.716 | 1.1698 | - | 3.567 | 10.311 | 10.054 | - |
| Doliolida | ||||||||||||
| Doliolium sp. | - | - | 1.63 | 0.907 | 3.744 | 7.514 | 0.649 | - | 0.813 | 5.459 | 1.902 | 7.017 |
| Rotifera | ||||||||||||
| Bdelloids | - | - | 1.068 | - | - | - | - | - | 0.375 | 1.213 | - | - |
| Polychaeta | ||||||||||||
| Trochophore larva | - | - | 0.168 | - | - | - | 0.086 | 0.195 | ||||
| Siphonid larva | - | - | 0.168 | - | - | - | - | - | - | - | - | - |
| Nereid larva | - | - | 0.112 | - | - | - | - | - | - | - | - | - |
| Pteropoda | ||||||||||||
| Limacina sp. | 0.789 | 1.5611 | 0.843 | 0.1395 | 0.101 | 5.7803 | 0.563 | 0.065 | 0.125 | 0.346 | 0.815 | - |
| Creseis sp. | - | 1.908 | - | 0.279 | - | - | - | - | - | - | - | - |
| Copelata | ||||||||||||
| Oikopleurid appendi-cularians | - | - | 0.393 | - | - | - | - | - | - | - | - | - |
| Amphipoda | ||||||||||||
| Hyperia | - | - | 0.224 | - | 0.202 | - | 0.173 | - | - | - | - | - |
| Salpida | ||||||||||||
| Thalia democratia | - | - | - | 0.279 | - | - | - | 0.1304 | - | - | - | - |
| Table continue on next pages................ | ||||||||||||
| Zoop-lankton | JAN | FEB | MAR | APR | MAY | JUN | JUL | AUG | SEP | OCT | NOV | DEC |
| Nematoda | ||||||||||||
| Nematod worm | 0.646 | 0.173 | 0.562 | 0.139 | 0.202 | 1.734 | 0.346 | 0.521 | 0.6258 | 0.519 | 0.2717 | 3.508 |
| Aphragmo-phora | ||||||||||||
| Arrow worm (Sagitta) | 0.071 | 0.086 | - | 0.069 | - | - | 0.043 | - | - | 0.259 | 1.358 | - |
| Other unspecified taxa | ||||||||||||
| Eggs | 1.866 | 4.336 | 1.686 | 0.209 | 2.935 | 8.092 | 2.512 | 1.239 | 0.3128 | 1.906 | 1.902 | 1.754 |
| Worms | 2.081 | 3.122 | 2.754 | 0.348 | 0.304 | 1.734 | 0.216 | 0.065 | 0.75 | 0.086 | - | - |
| Larvae | 0.143 | 1.474 | - | 0.086 | - | |||||||
| Fish larvae | - | - | - | 0.139 | 0.202 | - | - | - | 0.25 | 0.173 | - | - |
| Eggs with embryo inside | - | - | 0.337 | - | - | - | - | - | - | 0.05 | - | - |
*Values are the mean of all ponds. Jan- Dec means (January to December-2019); F-females; (-) indicated absent.
Table 3: Physicochemical properties of marine water ponds.
| Water variables | Range | SD | Mean value |
| Temperature ˚C | 24.5-38.4 | 4.4 | 32.3 |
| Salinity ppt | 33.9-39.1 | 1.2 | 36.1 |
| pH | 7.0-8.5 | 0.9 | 7.8 |
| Transparency cm | 27.1-44.8 | 5.6 | 33.0 |
| Dissolved oxygen mgL-1 | 5.3-7.5 | 0.5 | 6.1 |
| Nitrates mgL-1 | 3.9-21.3 | 4.1 | 10.4 |
| Ammonia µgL-1 | 19.6-69.2 | 11 | 42.9 |
| Phosphates µgL-1 | 5.0-92.6 | 32 | 62.7 |
| Potassium mgL-1 | 20.1-49.4 | 4.1 | 38.5 |
| Calcium mgL-1 | 26.4-50.5 | 5.3 | 41.5 |
| Alkalinity mgL-1 | 111.6-146.3 | 4.2 | 131.9 |
| Total hardness gL-1 | 18.09-26.21 | 0.70 | 19.2 |
*SD indicated standard deviation; Values are the mean of all ponds.
was found in the month of December (2.51 and 0.41%, respectively), because a short period of light in winter months resulting a sharp decline of primary producers and then zooplankton as reported by . According to Brien and Noyelles (1974), who observed nutrient concentration with planktic population in nutrient rich ponds, revealed that density of phytoplankton is totally depend on the environmental factors and seasonal nutrient transport into ponds while zooplankton density is totally reliant on the phytoplankton. The difference in planktonic population in our ponds might be due to the presence of variable amount of nutrient inputs in different months. Additionally, changing physicochemical properties of water causes fluctuation in abundance of plankton, because Pakistani water receives domestic, agriculture and industrial discharge that contain high amount of dissolve nutrients, specified by ; ; .
Table 4: Mean percentage of Phytoplankton and Zooplankton in marine water ponds (Jan-Dec, 2019).
| Categories | Percentage (%) |
| Phytoplankton | |
| Bacillariophyta | 69.815 |
| Dinoflagellata | 1.733 |
| Cyanophyta | 28.302 |
| Prymnesiophyta | 0.1494 |
| Zooplankton | |
| Scyphozoa | 7.576 |
| Decapoda | 0.7533 |
| Copepoda | 78.927 |
| Cladocera | 0.581 |
| Tintinnida | 1.909 |
| Foraminifera | 3.688 |
| Doliolida | 1.471 |
| Rotifera | 0.279 |
| Polychaeta | 0.0933 |
| Pteropoda | 0.818 |
| Copelata | 0.052 |
| Amphipoda | 0.072 |
| Salpida | 0.043 |
| Nematoda | 0.452 |
| Aphragmophora | 0.861 |
| Others | 3.201 |
*Values are the mean of all ponds.
Table 5: Average month wise distribution (%) of plankton in marine water ponds (Jan-Dec, 2019).
| Months | Phytoplankton (%) | Zooplankton (%) |
| January-2019 | 4.184 | 9.994 |
| February | 9.503 | 8.272 |
| March | 7.172 | 12.764 |
| April | 10.46 | 10.281 |
| May | 11.177 | 7.089 |
| June | 6.306 | 1.241 |
| July | 10.101 | 16.56 |
| August | 6.306 | 10.999 |
| September | 4.722 | 11.465 |
| October | 8.995 | 8.28 |
| November | 18.559 | 2.64 |
| December-2019 | 2.5104 | 0.408 |
*Values are the mean of all ponds.
Conclusions and Recommendations
In conclusion, the studied marine water fish ponds showed differ but high abundancy of planktons in different months because they receives nutrient rich water from tidal creek. Thus, present study will be supportive to farmers because ponds are productive and suitable for pisciculture activities. However, detailed study is needed by using different fertilizers linked with primary productivity and total production of these ponds.
Acknowledgments
Authors are grateful for PARC-ALP project (AS010-2021-23) entitled “Commercialization of the fish culture technology development in coastal region of Pakistan” for providing funding and facilities.
Novelty Statement
The current study investigates the phytoplankton and zooplankton diversity in marine water ponds will be supportive to farmers for pisciculture activities.
Author’s Contribution
Asma Fatima: Performed the experiment, data analysis, and manuscript writing;
Ghulam Abbas: Supervised the research, helped in experimental setup and data analysis;
Shahnaz Rashid: Reviewed and edited the manuscript.
Conflict of interest
The authors have declared no conflict of interest.
Figures
Google earth view of the experimental ponds.
References
- Abbas, G., 2001. Effect of NPK fertilization on the physicochemical characteristics of water and soil and on the dry weight of planktonic and benthic biomass in carp ponds. Indian J. Anim. Sci., 71(6): 597-603.
- Abbas, S., K. Samiullah, F. Jabeen, R. Yasin, M. Samee, S.Y. Mubarik, M. Hafeez-ur-Rehman, S. Ahmad, K. Feroz and M. Ashraf. 2015. Effect of fertilizers and supplementary feeding on water quality and plankton productivity in fish ponds under uniform fish stocking density. J. Biodivers. Environ. Sci., 6(3): 434-443.
- Abbasi, M.J., Z. Abbasi, F.N. Khokhar, P. Iqbal and P.J.A. Siddiqui. 2016. Distribution and abundance of major groups of zooplankton in relation to the physico-chemical parameters, in the coastal waters of Karachi, north Arabian Sea, Pakistan. Int. J. Fish. Aquat. Stud., 4: 241-249.
- Ajuonu N., S.U. Ukaonu, E.O. Oliwajoba, B.E. Mbawuike, A.B. Williams and E.F. Myade. 2011. The abundance and distribution of plankton species in the bony estuary, Nigeria. Agric. Biol. N. Am. J., 2(6): 1032–1037. https://doi.org/10.5251/abjna.2011.2.6.1032.1037[CrossRef]
- Akinpelu, O.T., I.F. Adeniyi, A.I. Aduwo, T.O. Amoo and E.O. Akindele. 2019. Primary productivity of Ifewara Reservoir, southwestern Nigeria. Freshw. Biol., 28(2): 77-89. https://doi.org/10.4314/tfb.v28i2.7[CrossRef]
- Akter, S., M.M. Rahman and M. Akter. 2015. Composition and abundance of phytoplankton population in fish ponds of Noakhali District, Bangladesh. Am. Eur. J. Agric. Environ. Sci., 15(11): 2143-2148.
- Ali, Z., S.S. Ahmad, M. Akhtar, M.A. Khan and M.N. Khan. 2007. Ecology and diversity of planktons in lakes of Uchalli wetlands complex, Pakistan. J. Anim. Plant Sci., 17: 41-42.
- Bauer, W., P.C. Abreu and L.H. Poersch. 2017. Plankton and water quality variability in an estuary before and after the shrimp farming effluents: possible impacts and regeneration. Braz. J. Oceanogr., 65(3): 495-508. https://doi.org/10.1590/s1679-87592017143406503[CrossRef]
- Bellinger, E.G. and D.C. Sigee. 2015. Freshwater algae: Identification, enumeration and use as bio indicators. John Wiley & Sons. https://doi.org/10.1002/9781118917152[CrossRef]
- Bhuiyan, S.I., E.A. Hiler and E.T. Smerdon. 1970. Effects of rainfall on settling velocity of suspended sediment in quiescent water. Water Resour. Res., 6(3): 810-817. https://doi.org/10.1029/WR006i003p00810[CrossRef]
- Boyd, C.E., 1981. Water quality in warm water fish ponds. Auburn University Agricultural Experimental Station. Auburn. Alabanna, USA.
- Brien, W. J., and F. Noyelles. 1974. Relationship between nutrient concentration, phytoplankton density, and zooplankton density in nutrient enriched experimental ponds. Hydrobiologia, 44(1): 105-125. https://doi.org/10.1007/BF00036159[CrossRef]
- Castellani, C. and M. Edwards. 2017. Marine Plankton: A practical guide to ecology, methodology, and taxonomy. Oxford University Press. https://doi.org/10.1093/oso/9780199233267.001.0001[CrossRef]
- Coutinho, T.M.P., A.C. Brito, P. Pereira, A.S. Gonçalves and M.A. Teresa. 2012. Phytoplankton tool for water quality assessment in semi-enclosed coastal lagoons: Open vs closed regimes. Estuar. Coast. Shelf. Sci., 110: 134146. https://doi.org/10.1016/j.ecss.2012.04.007[CrossRef]
- Dai, G.Z., J.L. Shang and B.S. Qiu. 2012. Ammonia may play an important role in the succession of cyanobacterial blooms and the distribution of common algal species in shallow freshwater lakes. Glob. Chang Biol., 18: 1571–1581. https://doi.org/10.1111/j.1365-2486.2012.02638.x[CrossRef]
- Durge, L.S., A.M. Chilke and R.N. Chavhan. 2018. Seasonal Variations in the Physico-Chemical Parameters of Malgujari Pond of Ghugus, District Chandrapur (Maharashtra). Int. J. Sci. Res. Biol. Sci., 5: 5.
- Erondu, C.J. and R.J. Solomon. 2017. Identification of planktons (zooplankton and phytoplankton) behind girls’ hostel University of Abuja, Nigeria. Direct Res. J. Publ. Health Environ. Technol., 2(3): 21-29.
- Gamboa-Delgado, J., 2014. Nutritional role of natural productivity and formulated feed in semiintensive shrimp farming as indicated by natural stable isotopes. Rev. Aquac., 6: 36–47. https://doi.org/10.1111/raq.12023[CrossRef]
- Gardner, E.M., D.M. McKnight, W.M. Lewis Jr and M.P. Miller. 2008. Effects of nutrient enrichment on phytoplankton in an alpine lake, Colorado, USA. Arct. Antarct. Alp. Res., 40(1): 55-64. https://doi.org/10.1657/1523-0430(07-002)[GARDNER]2.0.CO;2[CrossRef]
- Harney, N.V., A.A. Dhamani and R.J. Andrew. 2013. Seasonal variations in the physicochemical of Pindavani pond of Central India. Weekly Sci., 1(6): 2321-7871.
- Harrison, P.J., N. Khan, K. Yin, M. Saleem, N. Bano, M. Nisa, S.I. Ahmed, N. Rizvi and F. Azam. 1997. Nutrient and phytoplankton dynamics in two mangrove tidal creeks of the Indus River delta, Pakistan. Mar. Ecol. Prog. Ser., 157: 13-19.
- Heerkloss, R., T. Rieling and H. Schubert. 2005. Long-term studies of temperature dependent plankton community changes in an estuarine system of the southern Baltic Sea. ICAM Dossier, 3: 159-164.
- Hossain, M.Y., S. Jasmine, A.H.M. Ibrahim, Z.F. Ahmed, J. Ohtomi, B. Fulanda, M. Begum, A. Mamun, M.A. El-Kady and M.A. Wahab. 2007. A preliminary observation on water quality and plankton of an earthen fish pond in Bangladesh: Recommendations for future studies. Pak. J. Biol. Sci., 10(6): 868-873. https://doi.org/10.3923/pjbs.2007.868.873[CrossRef]
- Huang, Q., S. Olenin, L. Li, S. Sun and M. De Troch. 2020. Meiobenthos as food for farmed shrimps in the earthen ponds: Implications for sustainable feeding. Aquaculture, 521: 735094. https://doi.org/10.1016/j.aquaculture.2020.735094[CrossRef]
- Jacobsen, D. and O. Dangles. 2017. Organisms and diversity patterns at high altitudes. In: (eds. D. Jacobsen and O. Dangles), Ecology of high altitude waters, 1st edn. New York: Oxford University Press. pp. 66–91. https://doi.org/10.1093/oso/9780198736868.003.0004[CrossRef]
- Khokhar, F.N., B. Zaib-un-Nisa, T. Naz, J. Abassi, N. Ahmad, A. Ali, P. Iqbal and P.J.A. Siddiqui. 2020. Phytoplankton community dynamics during Asian monsoon system preponderate in the coastal waters of northern region of Arabian Sea bordering Pakistan. Pak. J. Bot., 52(2): 703-709. https://doi.org/10.30848/PJB2020-2(28)[CrossRef]
- Kumar, D., M. Karthik and R. Rajakumar. 2017. Study of seasonal water quality assessment and fish pond conservation in Thanjavur, Tamil Nadu, India. J. Entomol. Zool. Stud., 5: 1232-1238.
- Martins, F.S., A. Moutinho, J.E. Marques, N. Formigo and S.C. Antunes. 2020. Plankton characterization of alpine ponds: A case of study for the assessment of water quality in Serra da Estrela (Portugal). Ann. J. Limnol., 56: 4. https://doi.org/10.1051/limn/2020001[CrossRef]
- Mermillod-Blondin, F., P. Marmonier, M. Tenaille, D.G. Lemoine, M. Lafont, R. Vander Vorste, L. Simon and L. Volatier. 2020. Bottom-up processes control benthic macroinvertebrate communities and food web structure of fishless artificial wetlands. Aquat. Ecol., pp. 1-15. https://doi.org/10.1007/s10452-020-09760-2[CrossRef]
- Newell, G.E. and R.C. Newell. 1963. Marine plankton: A practical guide (No. 592 NEWm).
- Ogbuagu, D.H., U.O. Nwahiri, E.C. Osuebi, I.E. Mbuka-Nwosu and C.G. Onwuagba. 2019. Investigating temperature and nutrients as drivers of primary productivity in aquatic environment. J. Geosci. Environ. Prot., 7: 92-107. https://doi.org/10.4236/gep.2019.77008[CrossRef]
- Persaud, A.D., R.E. Moeller, C.E. Williamson and C.W. Burns. 2007. Photoprotective compounds in weakly and strongly pigmented copepods and co-occurring cladocerans. Freshw. Biol., 52: 2121–2133. https://doi.org/10.1111/j.1365-2427.2007.01833.x[CrossRef]
- Pillay, T.V.R., 1992. Aquaculture and the Environment. New York: Halsted Press.
- Pollock, L.W., 1998. A practical guide to the marine animals of northeastern North America. Rutgers University Press.
- Pulle, J.S. and A.M. Khan. 2003. Phytoplanktonic study of Isapur dam water. Ecol. Environ. Conserv., 9: 403-406.
- Ramanathan, S. and A. Amsath. 2018. Seasonal variations in physico-chemical parameters of puthukulam pond, Pudukkottai, Tamilnadu.
- Rukhsana, R., S. Rashid, A. Fatima, O.I. Khan, S.B.H. Shah, M. Ali and G. Abbas. 2021. The status of water quality in various fish and shrimp farms of Sindh Province, Pakistan: abundance of planktonic biomass in relation to physicochemical properties of pond water. Sarhad J. Agric., 37(3): 847-857.
- Sahni, K. and S. Yadav. 2012. Seasonal variations in physico-chemical parameters of Bharawas Pond, Rewari, Haryana. Asian J. Exp. Sci., 26(1): 61-64.
- Sarkar, R., A.R. Ghosh and N.K. Mondal. 2020. Comparative study on physicochemical status and diversity of macrophytes and zooplanktons of two urban ponds of Chandannagar, WB, India. Appl. Water Sci., 10(2): 63. https://doi.org/10.1007/s13201-020-1146-y[CrossRef]
- Shah, M.M.R., M.Y. Hossain, M. Begum, Z.F. Ahmed, J. Ohtomi, M.M. Rahman, M.J. Alam, M.A. Islam and B. Fulanda. 2008. Seasonal variations of phytoplanktonic community structure and production in relation to environmental factors of the southwest coastal waters of Bangladesh. J. Fish Aquat. Sci., 3(2): 102-113. https://doi.org/10.3923/jfas.2008.102.113[CrossRef]
- Shoaib, M., Z. Burhan, S. Shafique, H. Jabeen and P.J.A. Siddique. 2017. Phytoplankton composition in a mangrove ecosystem at Sandspit, Karachi, Pakistan. Pak. J. Bot., 49(1): 379-387.
- Simmons, J.A., J.M. Long and J.W. Ray. 2004. What limits the productivity of acid mine drainage treatment ponds? Mine Water Environ., 23: 44-53. https://doi.org/10.1007/s10230-004-0035-1[CrossRef]
- Sommer, U., Z.M. Gliwicz, W. Lampert and A. Duncan. 1986. The PEG-model of seasonal succession of planktonic events in fresh waters. Arch. Hydrobiol., 106(4): 433–471.
- Steel, R.G.D. J.H. Torrie and D.A. Dickey. 1997. Principles and procedures of statistics: A biometrical approach. 3rd Edition. McGraw-Hill, Boston. https://doi.org/10.2307/2530180[CrossRef]
- Tamizhazhagan, V. and K. Pugazhendy. 2016. Physico-chemical parameters from the Manappadaiyur and Swamimalai fresh water ponds. Indian Am. J. Pharm. Sci., 3(5): 444449.
- Vincent, W.F., 2009. Cyanobacteria. Encycl. Inl. Waters. https://doi.org/10.1016/B978-012370626-3.00127-7[CrossRef]
- Ward, H.B. and G.C. Whipple. 1959. Freshwater biology. (2nd edition). Jhon Willey and Sons. Inc. New York, London. 1248.
- Welch, P.S., 1948. Limnology. McGraw-Hill Book Company Inc. New York. pp. 218.
- Welch, P.S., 1952. Limnology. Mc Graw-Hill, New York. pp. 218.
- Winkler, H.M., 2002. Effects of eutrophication on fish stocks in Baltic lagoons. In: Baltic coastal ecosystems (Eds. G. Schernewski and U. Schiewer), Springer-Verlag, Berlin. pp. 65-74. https://doi.org/10.1007/978-3-662-04769-9_6[CrossRef]
- Wu, H., R. Peng, Y. Yang, L. He, W. Wang, T. Zheng and G. Lin. 2014. Mariculture pond influence on mangrove areas in South China: significantly larger nitrogen and phosphorus loadings from sediment wash-out than from tidal water exchange. Aquaculture, 426: 204– 212. https://doi.org/10.1016/j.aquaculture.2014.02.009[CrossRef]
- Yaqoob, N., A. Mashiatullah, F. Chughtai, N. Sehr, T. Javed and A. Ghaffar. 2013. Phytoplanktons and zooplanktons diversity in Karachi coastal seawater under high and low tide during winter monsoon. Nuclear, 50(2): 141-148.
Services
Article usage statistics
Loading…