
Soybean meal (SBM) is a cornerstone of poultry feed formulations that shows substantial variability in nutritional quality, undermining feed reliability and animal performance. Traditional nutrient centric evaluation approaches are inadequate to capture this complexity. To overcome this gap, this research study introduced a clustering framework to classify SBM on the basis of integrated-physiochemical features. Twenty SBM samples were collected from 10 districts of Sindh Pakistan which were analyzed for mineral profile (Ca, P, Mg, Zn and Cu), proximate composition and protein quality (KOH solubility). Crude protein was uniformly elevated (44.68 ± 0.63%), substantial regional variations (p < 0.05) were observed in dry matter, protein solubility and crude fat. The hierarchical cluster analysis identified three different functional profiles including: (i) the premium cluster (e.g., Mirpurkhas, Badin) categorized by high protein solubility (>85%) with low fibre which is suitable for starter diet; (ii) standard cluster for normal application; (iii) a utility cluster for strategic blending. Furthermore, geo-spatial analysis identified districts like Tando Allahyar and Hyderabad as sources of vastly reliable SBM (CV ≈ 10%) that enhanced supply chain reliability while low Ca:P ratios (0.40:1-0.90:1) across the samples pinpoint the requirement of calcium supplements in feed formulations. This study highlights the novelty and utility of clustering as robust data driven method for SBM classification and shift the paradigm from compositional evaluation to functional profiling. The proposed pipeline enables accuracy in feed formulation, optimized ingredient valorization based on zoo-technical outcomes and improved nutritional security in poultry production systems.
Research Article · Volume 12, Issue 2, 3 September 2026 · Open Access
A Multivariate Cluster Analysis of Soybean Meal from Sindh, Pakistan Reveals Distinct Nutri-Physiochemical Profiles Governing its Valorization in Poultry Diets
· ·
Affiliations & Notes ⌄
- 1Institute of Biochemistry, University of Sindh, Jamshoro 76080, Pakistan
- 2Department of Biochemistry and Molecular Biology, Southwest University, Chongqing 400715, China
- 3Department of Biosciences, COMSATS University Islamabad, Pakistan. *Correspondence | Abdul Waheed Ghanghro, Institute of Biochemistry, University of Sindh, Jamshoro 76080, Pakistan
- 4Email: abdulwaheed@usindh.edu.pk
- 5Bheem Raj Serani, Department of Biochemistry and Molecular Biology, Southwest University, Chongqing 400715, China
- 6Email: bheemrajserani@gmail.com
Article Info ⌄
- Journal:
- Veterinary Sciences: Research and Reviews
- Published:
- 3 September 2026
From the article
- The present study has effectively shown that a multivariate cluster analysis method offers a better and more practical categorization of soybean meal than the more traditional univariate or geographic comparisons.
- We determined three functional profiles namely Premium, Standard, and Utility profiles which directly correspond to ideal application in poultry feed formulation.
- Furthermore, these clusters could be correlated with in-vivo tests in poultry which would directly validate their applicability.
- Despite the shortcomings, this study proposes a novel and data-driven method for SBM evaluation beyond simple compositional analysis with great potential for precision feed formulation and ensuring nutritional uniformity in poultry production.
Selected from the article's own text.
Abstract
Introduction
Soybean meal (SBM) is the most widely used protein source in monogastric animal feeds due to its balanced amino acid profile and high digestibility . Yet it is not always of the same quality. Nevertheless its nutritional value is not reliable. Variability in SBM composition arises from several reasons such as soybean genotype, agronomic conditions, oil extraction and processing methods ; . The significant indicator for processing adequacy is the potassium hydroxide (KOH) protein solubility which quantifies the degree of heat treatment. Anti-nutritional factors are not destroyed through insufficient processing, and excessive heat may diminish protein bioavailability . Consistency in feed quality is particularly crucial for the poultry industry which is a low margin sector that relies on predictable nutritional inputs to optimize growth performance and feed efficiency. SBM serves as a primary contributor of protein and amino acids in poultry diets; however, its chemical composition and nutritional value can vary significantly depending on processing conditions, storage practices, and geographic origin ; ; . Traditional evaluation methods are based solely on crude protein content which are increasingly inadequate as they fail to capture the complex interactions among other nutritional components such as fiber, lipids, and minerals . In For instance, the balance among calcium and phosphorus is crucial for skeletal development, and any imbalance might lead to metabolic disorders . Furthermore, the nutrient composition of SBM in various studies has demonstrated to vary greatly between geographical regions suggesting that reliance on average nutrient levels may not be sufficiently precise for feed formulation ; . These constraints emphasize the need for a more holistic and systems-based evaluation of SBM that accounts for its multidimensional nutritional profile. Accordingly, the current study moves beyond conventional univariate analyses by utilizing multivariate statistical methods including cluster analysis and principal component analysis to reveal the complex nutri-physicochemical interactions amongst commercially available SBM samples in districts of Sindh, Pakistan. Secondly, to identify and characterize distinct clusters with functional significance to specific poultry feeding stages. Lastly, to evaluate geo-specific variability and mineral balance to provide an additional strategic sourcing and feed formulation practices.
Materials and Methods
Sample collection
Twenty commercial SBM samples (n=20) were systematically collected from distributors and feed mills across ten major districts of Sindh province, Pakistan (Hyderabad, Tando Allahyar, Matiari, Jamshoro, Badin, Shaheed Benazirabad, Sanghar, Mirpurkhas, Thatta, and Larkana). Two representative samples were collected from each district and were stored at 4°C prior to analysis.
Chemical analysis
The analysis of all the collected samples was conducted in duplicate.
Proximate analysis
The proximate composition including dry matter (DM; Method 934.01), crude protein (CP; Method 984.13), crude fat (CF; Method 920.39), crude fiber (CFi; Method 978.10), and ash (Method 942.05) was quantified following the standard protocols of the Association of Official Analytical Chemists .
Protein quality assessment
The protein solubility in 0.2% potassium hydroxide (KOH) solution was determined according to Araba and Dale (1990) which is one of the important indicator of protein denaturation due to over-processing.
Mineral analysis
The samples were dry-ashed in muffle furnace at 550°C for 6 hours. The ash was dissolved in 5 mL of 25% HCl and digested in a hot block at 125°C. Deionized water was added to the final volume to 100 mL. The concentrations of calcium (Ca), phosphorus (P), magnesium (Mg), zinc (Zn), and copper (Cu) were measured using flame atomic absorption spectrometry (PerkinElmer PinAAcle 900T) according to AOAC method 968.08.
Statistical and multivariate analysis
The data was initially processed employing SPSS version 26 (IBM Corp.) with outcomes were expressed as mean ± standard deviation. A one-way ANOVA was utilized to test for significant differences (p < 0.05) between districts. For multivariate analysis, the data were standardized (Z-scores) to avoid the influence of different units. Hierarchical Cluster Analysis (HCA) using Ward’s method with squared Euclidean distance was performed to group SBM samples into distinct clusters based on all analyzed parameters. The quality and consistency of SBM from different districts were further assessed by calculating the Coefficient of Variation (CV% = (SD/Mean)*100).
Results and Discussion
Geographic variation in proximate composition and protein quality
The summary of the proximate composition and the protein quality of SBM across the ten districts is provided in Table 1. The total mean crude protein (44.68%) fell within the normal range of SBM and there was no geographic significant difference (p=0.743). This implies that CP is a relatively stable component which is mainly dictated by the variety of soybean and standard solvent extraction process.
Nevertheless, the geographic diversity was found to be significant in terms of dry matter (p=0.037), crude fat (p=0.005), and the KOH solubility (p=0.012). The differences in DM can presumably be explained by the different local ambient humidity and post-processing storage and geographical origin ; . The significant differences in CF are critical, as they directly impact the metabolizable energy value of the meal. The low CF (e.g., Badin, 0.50%), would indicate the high efficiency of the solvent extraction process, whereas the high values (e.g., Mirpurkhas at 2.52%) could be indicative of expeller-processed meal consumption or local differences in the efficiency of the process . The protein quality parameters such as the KOH solubility significantly differed. The Shaheed Benazirabad samples (75.28%) were found to be below the optimal 78-85 range indicating the possibility of protein damage due to over-processing that would degrade the availability of the amino acids to the bird . In contrast, the samples of Mirpurkhas (85.97%) and Badin (84.56%) showed excellent protein quality.
Multivariate cluster analysis and nutritional ranking reveals functional SBM profiles
The HCA was able to cluster the SBM samples into three different clusters which transcended their geographic origin. This classification offers a more feasible way of feed formulation as compared to geographic sourcing alone. To enhance interpretability a composite nutritional quality score was calculated and the districts were subsequently ranked based on CP, KOH solubility, and crude fiber content (Table 2). The topmost quality soybean meal is produced by Mirpurkhas followed by Badin, and Sanghar. On the contrary, the lowest quality meals were offered by Shaheed Benazirabad and Matiari. The sharp
Table 1: Mean values of proximate composition (± Standard Deviation) of soybean meal from ten different districts of sindh province
|
District |
Dry matter (%) |
Crude protein (%) |
Crude fat (%) |
Crude fiber (%) |
Ash (%) |
KOH Solubility (%) |
|
Hyderabad |
88.77 ± 0.80 |
44.95 ± 0.69 |
2.60 ± 0.01 |
1.56 ± 0.78 |
5.18 ± 0.59 |
82.96 ± 1.95 |
|
Tando allahyar |
86.79 ± 1.07 |
44.84 ± 0.00 |
1.14 ± 0.37 |
1.57 ± 0.83 |
5.40 ± 0.11 |
82.93 ± 0.00 |
|
Matiari |
87.56 ± 0.63 |
45.17 ± 0.47 |
0.92 ± 0.15 |
2.03 ± 0.21 |
6.00 ± 0.28 |
81.36 ± 2.05 |
|
Jamshoro |
86.72 ± 1.70 |
45.17 ± 0.06 |
0.91 ± 0.59 |
1.47 ± 0.20 |
4.22 ± 0.95 |
83.37 ± 2.36 |
|
Badin |
88.24 ± 1.28 |
44.34 ± 0.19 |
0.50 ± 0.25 |
1.29 ± 0.22 |
6.10 ± 0.12 |
84.56 ± 0.29 |
|
Shaheed benazirabad |
89.77 ± 1.94 |
44.19 ± 0.61 |
1.30 ± 0.41 |
1.50 ± 0.51 |
4.26 ± 1.01 |
75.28 ± 4.07 |
|
Sanghar |
88.85 ± 1.63 |
44.30 ± 0.77 |
1.36 ± 1.03 |
0.86 ± 0.12 |
4.31 ± 0.93 |
81.72 ± 0.08 |
|
Mirpurkhas |
89.59 ± 0.31 |
44.83 ± 0.16 |
2.52 ± 0.08 |
0.92 ± 0.30 |
4.60 ± 1.63 |
85.97 ± 1.27 |
|
Thatta |
85.68 ± 0.22 |
44.62 ± 0.62 |
0.73 ± 0.02 |
1.35 ± 0.58 |
5.53 ± 0.98 |
80.42 ± 2.97 |
|
Larkana |
87.36 ± 0.74 |
44.51 ± 0.08 |
1.18 ± 0.61 |
1.83 ± 0.17 |
5.32 ± 0.63 |
84.38 ± 0.45 |
|
Overall Mean |
87.81 ± 1.66 |
44.68 ± 0.63 |
1.31 ± 0.74 |
1.42 ± 0.49 |
4.87 ± 0.95 |
82.09 ± 3.31 |
|
p-value |
0.037* |
0.743 |
0.005* |
0.192 |
0.122 |
0.012* |
P< 0.05 indicates a statistically significant difference between districts
difference in solubility between the very soluble protein present in Mirpurkhas and the poor profile present in Shaheed Benazirabad highlights a very important origin-related effect over soybean local meal. The protein concentration is high in Hyderabads meal but the medium solubility indicates that it might be heated which will also be in line with the results that the actual availability of proteins will depend on the processing . On the other hand, the nutrient density of high fiber in the food production of Matiari and Shaheed Benazirabad is watered down which is a limitation of poultry diets
Table 2: District ranking based on a composite nutritional quality score for poultry feed
|
Rank |
District |
Crude protein rank (Higher is better) |
KOH Solubility rank (Higher is better) |
Crude fiber rank (Lower is better) |
Total score (Lower is better) |
|
1 |
Mirpurkhas |
3 |
1 |
2 |
6 |
|
2 |
Badin |
8 |
2 |
4 |
14 |
|
3 |
Sanghar |
9 |
7 |
1 |
17 |
|
4 |
Hyderabad |
1 |
5 |
7 |
13 |
|
5 |
Larkana |
6 |
3 |
9 |
18 |
|
6 |
Jamshoro |
2 |
4 |
10 |
16 |
|
7 |
Tando allahyar |
4 |
9 |
6 |
19 |
|
8 |
Thatta |
5 |
10 |
5 |
20 |
|
9 |
Matiari |
7 |
8 |
10 |
25 |
|
10 |
Shaheed benazirabad |
10 |
10 |
6 |
26 |
. Thus, feed mills such as Thatta and Tando Allahyar have to focus on protein quality rather than on the content of crude protein. Finally, this geographical grid determines that sourcing out of Mirpurkhas has a unique nutritional benefit over the low-ranking districts.
An extensive multivariate analysis of soil biomass (SBM) nutritional parameters among the districts was studied by hierarchical clustering, heatmap visualization, and principal component analysis (PCA) illustrated in Figure 1. The dendrogram (a) reveals clear grouping patterns among districts, indicating similarities in their nutritional profiles, with some districts forming closely related clusters while others remain distinct. The heatmap (b) further highlights the variation in key parameters (CP, KOH, and CF), showing contrasting concentration levels across districts through a gradient of color intensities. The PCA score plot (c) explains a substantial
Table 3: Average mineral content (± Standard Deviation) of soybean meal from ten different districts of sindh province
|
District |
Calcium (Ca) (mg/kg) |
Phosphorus (P) (mg/kg) |
Magnesium (Mg) (mg/kg) |
Zinc (Zn) (mg/kg) |
Copper (Cu) (mg/kg) |
|
Hyderabad |
4125 ± 673 |
4945 ± 285 |
2055 ± 544 |
44.82 ± 3.68 |
18.57 ± 8.61 |
|
Tando Allahyar |
4278 ± 2445 |
5275 ± 1493 |
2620 ± 533 |
46.56 ± 1.67 |
17.23 ± 6.26 |
|
Matiari |
1840 ± 382 |
4125 ± 1338 |
1500 ± 270 |
44.26 ± 4.27 |
20.99 ± 1.18 |
|
Jamshoro |
3710 ± 1953 |
4105 ± 571 |
2500 ± 1107 |
46.03 ± 8.91 |
20.55 ± 3.44 |
|
Badin |
2900 ± 1075 |
5505 ± 1235 |
2405 ± 99 |
43.25 ± 7.00 |
18.46 ± 0.54 |
|
Shaheed Benazirabad |
2850 ± 570 |
4940 ± 2122 |
2900 ± 367 |
47.71 ± 4.35 |
16.81 ± 6.77 |
|
Sanghar |
2825 ± 71 |
7095 ± 1455 |
2385 ± 1485 |
46.27 ± 9.19 |
21.56 ± 1.56 |
|
Mirpurkhas |
3070 ± 1403 |
5545 ± 2215 |
2345 ± 544 |
45.03 ± 8.94 |
19.17 ± 2.10 |
|
Thatta |
2785 ± 1568 |
4925 ± 374 |
2515 ± 566 |
46.48 ± 7.35 |
21.98 ± 4.37 |
|
Larkana |
4275 ± 433 |
5655 ± 3135 |
2545 ± 311 |
50.01 ± 2.12 |
16.69 ± 4.42 |
|
Overall Mean |
3360 ± 1344 |
5375 ± 1697 |
2415 ± 684 |
47.22 ± 4.60 |
19.13 ± 4.00 |
|
p-value |
0.690 |
0.729 |
0.663 |
0.951 |
0.816 |
P< 0.05 indicates a statistically significant difference between districts
Table 4: Critical macro-mineral ratios in soybean meal and their assessed suitability for poultry
|
District |
Ca:P ratio |
Ca:P classification |
Mg:P ratio |
Mg:P classification |
Overall mineral balance interpretation |
|
Hyderabad |
0.83:1 |
Slightly below recommended range |
0.42:1 |
Within recommended range |
May require moderate calcium supplementation to achieve optimal balance |
|
Tando Allahyar |
0.81:1 |
Slightly below recommended range |
0.50:1 |
Within recommended range |
Comparable to Hyderabad; additional calcium recommended |
|
Matiari |
0.45:1 |
Severely below recommended range |
0.36:1 |
Below recommended range |
Poor mineral balance; significant supplementation required |
|
Jamshoro |
0.90:1 |
Within acceptable range |
0.61:1 |
Within recommended range |
Relatively balanced mineral profile compared to other districts |
|
Badin |
0.53:1 |
Below recommended range |
0.44:1 |
Within recommended range |
Calcium supplementation required to correct imbalance |
|
Shaheed Benazirabad |
0.58:1 |
Below recommended range |
0.59:1 |
Within recommended range |
Requires calcium adjustment for improved balance |
|
Sanghar |
0.40:1 |
Severely below recommended range |
0.34:1 |
Below recommended range |
Markedly imbalanced; supplementation strongly recommended |
|
Mirpurkhas |
0.55:1 |
Below recommended range |
0.42:1 |
Within recommended range |
Adequate phosphorus but insufficient calcium |
|
Thatta |
0.57:1 |
Below recommended range |
0.51:1 |
Within recommended range |
Requires calcium supplementation |
|
Larkana |
0.76:1 |
Slightly below recommended range |
0.45:1 |
Within recommended range |
Closer to optimal ratio but still requires calcium adjustment |
proportion of the total variance (PC1: 46.2% and PC2: 36.4%), effectively separating districts based on their nutritional characteristics. Districts located near each other have similar parameter compositions while more distant districts show greater dissimilarity. The aggregate analyses overall reveal a high degree of spatial variation in the nutritional properties of the SBM and a robust basis for district-level classification.
Mineral composition and critical balance assessment
Table 3 indicates the mineral content. There was no meaningful geographic difference among any mineral (p>0.05), indicating that the composition of minerals is less affected by local market factors and more by the characteristics of soybean and processing. The most common mineral was phosphorus which validated the importance of SBM as a principal source of phosphorus.
Table 4 shows the critical ratios of minerals. The most noteworthy results were the poor Ca:P ratio across all districts with the range of 00.40:1 (Sanghar) to 0.90:1 (Jamshoro). This is a common feature of SBM which highlights the opportunity cost of the non-negotiable nature of the usage of limestone or similar sources of calcium in SBM-based poultry feeds . The neglect of this imbalance may result in rickets and poor bone mineralization.
Ca:P ratios were assessed based on nutritional ranges (1:1 to 2:1) as defined by NRC (2001). Ratios were classified as: within acceptable range (1.0–2.0), slightly below recommended range (0.7–0.9), below recommended range (0.5–0.7), and severely below recommended range (<0.5). Mg:P ratios were interpreted as within recommended range (>0.4) or below recommended range (<0.4), based on FAO guidelines.
Geo-Specific consistency index for supply chain security
The Coefficient of Variation (CV%) is the measure of consistency of SBM that determines the reliability of feed formulation (Table 5). Eight out of the ten districts exhibited “Excellent” consistency (Avg. CV% < 15%), but Hyderabad, Thatta and Jamshoro showed astonishing batch-to-batch uniformity (Avg. CV% < 5%). This is an invaluable data to procurement managers because sourcing such districts reduces the chances of food deviations. Conversely, SBM from Larkana and Shaheed Benazirabad were varied especially in phosphorus content (CV %> 55% and 43% respectively) which requires more frequent quality control.
Conclusions and Recommendations
The present study has effectively shown that a multivariate cluster analysis method offers a better and more practical categorization of soybean meal than the more traditional univariate or geographic comparisons. We determined three functional profiles namely Premium, Standard, and Utility profiles which directly correspond to ideal application in poultry feed formulation. The results verify that the crude protein level is uniform but such vital quality indicators as KOH solubility, crude fat, and mineral balance have considerably different values. The “Geo-Specific Consistency Index” is a practical and scalable way to de-risking feed supply chains. Its implementation within the poultry industry could support data-drivendecision-making and advance precision nutrition,
Table 5: Nutrient consistency assessment by district (Based on coefficient of variation %)
|
District |
CV% Crude protein (Lower is better) |
CV% KOH Solubility (Lower is better) |
CV% Phosphorus (Lower is better) |
Average CV% (Lower is better) |
Consistency rating |
|
Tando Allahyar |
0.0% |
0.0% |
28.3% |
9.4% |
Excellent |
|
Mirpurkhas |
0.4% |
1.5% |
39.9% |
13.9% |
Excellent |
|
Badin |
0.4% |
0.3% |
22.4% |
7.7% |
Excellent |
|
Jamshoro |
0.1% |
2.8% |
13.9% |
5.6% |
Excellent |
|
Larkana |
0.2% |
0.5% |
55.4% |
18.7% |
Good |
|
Thatta |
1.4% |
3.7% |
7.6% |
4.2% |
Excellent |
|
Hyderabad |
1.5% |
2.4% |
5.8% |
3.2% |
Excellent |
|
Sanghar |
1.7% |
0.1% |
20.5% |
7.4% |
Excellent |
|
Matiari |
1.0% |
2.5% |
32.4% |
12.0% |
Excellent |
|
Shaheed benazirabad |
2.8% |
5.4% |
43.0% |
17.1% |
Good |
ultimately improving ingredient utilization, feed efficiency, and economic sustainability.
Although this study offered a strong multivariate basis for functional classification of SBM certain limitations should be addressed. The relatively limited sample size and the district-specific nature of the study may constrain the representativeness of the results to other geographical areas and agricultural practices. Variability due to seasonal, processing, and storage conditions was also not well explored and could also impact SBM quality. Future research should focus on expanding the sample size and incorporating a wider geographical distribution to validate and refine the proposed clustering model. The incorporation of other parameters including amino acid digestibility, anti-nutritional factors, processing factors would further improve the functional classification system. Furthermore, these clusters could be correlated with in-vivo tests in poultry which would directly validate their applicability. Despite the shortcomings, this study proposes a novel and data-driven method for SBM evaluation beyond simple compositional analysis with great potential for precision feed formulation and ensuring nutritional uniformity in poultry production.
Novelty Statement
This study provides a novel data-driven framework for functionally classifying soybean meal by integrating its nutritional, physicochemical, mineral, and geographical variability. The method enables quality-based ingredient selection and precise targeted feed formulation.
Authors’ Contributions
Abdul Waheed Ghanghro and Bheem Raj Serani: Performed formal analysis, conceptualized and supervised the study.
Mahrukh Zakir: Assisted in writing - review & editing and manuscript submission.
All authors have read and agreed to the published version of the manuscript.
Author declaration
[Instructions: Please check all applicable boxes and provide additional information as requested.]
Conflict of Interest
Potential conflict of interest exists:
We wish to draw the attention of the Editor to the following facts, which may be considered as potential conflicts of interest, and to significant financial contributions to this work:
The nature of potential conflict of interest is described below:
No conflict of interest exists.
We wish to confirm that there are no known conflicts of interest associated with this publication and there has been no significant financial support for this work that could have influenced its outcome.
Funding
No Funding
Intellectual property
We confirm that we have given due consideration to the protection of intellectual property associated with this work and that there are no impediments to publication, including the timing of publication, with respect to intellectual property. In so doing we confirm that we have followed the regulations of our institutions concerning intellectual property.
Research ethics
We further confirm that any aspect of the work covered in this manuscript has not involved human patients and thus requires no ethical approval of any relevant body.
Authorship
All listed authors meet the Journal criteria. We attest that all authors contributed significantly to the creation of this manuscript, each having fulfilled criteria as established by the Journal.
We confirm that the manuscript has been read and approved by all named authors.
We confirm that the order of authors listed in the manuscript has been approved by all named authors.
Contact with the editorial office
The Corresponding Author declared on the title page of the manuscript is:
Abdul Waheed Ghanghro: abdulwaheed@usindh.edu.pk.
This author submitted this manuscript using his/her account.
Someone other than the Corresponding Author declared above submitted this manuscript from his/her account:
Bheem Raj Serani: bheemrajserani@gmail.com
We the undersigned agree with all of the above.
Author’s name (First, Last)
Abdul Waheed Ghanghro
Bheem Raj Serani
Mahrukh Zakir
Generative AI and AI-assisted technology statement
The authors declare that no generative AI and AI assisted technology was used in the creation of this manuscript.
Conflicts of interest
The authors declare no conflict of interest.
Figures
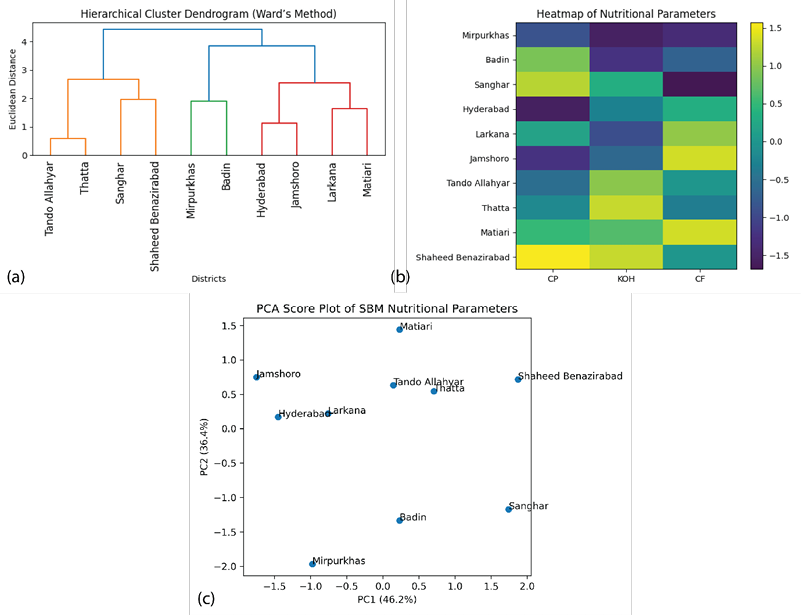
Multivariate analysis of soybean meal (SBM) nutritional features across districts. (a) Hierarchical cluster analysis (HCA) dendrogram generated using Ward’s method and Euclidean distance illustrate the grouping of districts based on crude protein (CP), potassium hydroxide (KOH) solubility, and crude fibre (CF) content. Three distinct clusters are observed that indicate variability in nutritional quality among regions. (b) Heatmap of standardized nutritional parameters (CP, KOH, and CF) show relative variation across districts and supporting the clustering patterns identified in the dendrogram. (c) Principal component analysis (PCA) score plot shows two principal components (PC1: 46.2%, PC2: 36.4%) that explains the majority of the variance. The spatial distribution of districts exhibits clear separation consistent with HCA results validating the robustness of the clustering approach.
References
- Aguirre, L., L. Cámara, A. Smith, J. Arroyo, A. de Juan, G. Fondevila, & G.J.O.F. Mateos. 2023. Chemical composition, protein quality indicators and in vitro protein digestibility of commercial soya bean meals from different origins for use in poultry feeding. 9(3): 33–35.
- Akintan, O., K.G. Gebremedhin, and D.D. Uyeh. 2024. Animal feed formulation—Connecting technologies to build a resilient and sustainable system. Anim., 14(10): 1497. https://doi.org/10.3390/ani14101497[CrossRef]
- Araba, M. and N.J.P.S. Dale. 1990. Evaluation of protein solubility as an indicator of overprocessing soybean meal. 69(1): 76–83. https://doi.org/10.3382/ps.0690076[CrossRef]
- Dozier, W., J. Hess, and H. El-Shemy. 2011. Soybean meal quality and analytical techniques. Soyb. Nutrit., 111–124.
- García-Rebollar, P., L. Cámara, R. Lázaro, C. Dapoza, R. Pérez-Maldonado, G.J.A.F.S. Mateos, and Technology. 2016. Influence of the origin of the beans on the chemical composition and nutritive value of commercial soybean meals. 221: 245–261. https://doi.org/10.1016/j.anifeedsci.2016.07.007[CrossRef]
- Grieshop, C.M., C.T. Kadzere, G.M. Clapper, E.A. Flickinger, L.L. Bauer, R.L. Frazier, G.C.J.J.O.A. Fahey, and F. Chemistry. 2003. Chemical and nutritional characteristics of United States soybeans and soybean meals. 51(26): 7684–7691. https://doi.org/10.1021/jf034690c[CrossRef]
- Hilton, K., A.L.P. de Souza, M. Zarate, & J.C. Remus. 2022. PSVIII-9 Survey us Soybean Meal: Does Region Influence Quality and Antinutritional Factors? J. Anim. Sci., 100(Supplement_2): 182–183. https://doi.org/10.1093/jas/skac064.310[CrossRef]
- Mateos, G., E. Jiménez-Moreno, M. Serrano, & R.J.J.O.A.P.R. Lázaro. 2012. Poultry response to high levels of dietary fiber sources varying in physical and chemical characteristics. 21(1): 156–174. https://doi.org/10.3382/japr.2011-00477[CrossRef]
- Ravindran, V., M. Abdollahi, and S.J.P.S. Bootwalla. 2014. Nutrient analysis, metabolizable energy, and digestible amino acids of soybean meals of different origins for broilers. 93(10): 2567–2577. https://doi.org/10.3382/ps.2014-04068[CrossRef]
- Shastak, Y. and M. Rodehutscord. 2015. A review of the role of magnesium in poultry nutrition. World’s Poult. Sci. J., 71(1): 125–138 https://doi.org/10.1017/S0043933915000112.[CrossRef]
- Thakur, M. & C.R.J.J.O.T.A.O.C.S. Hurburgh. 2007. Quality of US soybean meal compared to the quality of soybean meal from other origins. 84(9): 835–843. https://doi.org/10.1007/s11746-007-1107-8[CrossRef]
- Thiex, N. and C.J.J.O.A.S. Richardson. 2003. Challenges in measuring moisture content of feeds. 81(12): 3255–3266. https://doi.org/10.2527/2003.81123255x[CrossRef]
- Toomer, O.T., E.O. Oviedo-Rondón, M. Ali, M. Joseph, T. Vu, B. Fallen, and R. Mian. 2024. Full-Fat Soybean Meals as an Alternative Poultry Feed Ingredient—Feed Processing Methods and Utilization—Review and Perspective. Anim., 14(16): 2366. https://doi.org/10.3390/ani14162366[CrossRef]
- Williams, S. 1984. Official methods of analysis of the Association of Official Analytical Chemists.
- Yin, Y., A.A. Fatufe, F. Blachier, and F. Blachier. 2011. Soya bean meal and its extensive use in livestock feeding and nutrition. Soybean and nutrition. InTech Europe., 369–384. https://doi.org/10.5772/18823[CrossRef]
Services
Article usage statistics
Loading…