
The chronic hepatitis C (CHC) virus plays a vital role around the globe in hepatic persistent disease. It is undoubtedly a major health and financial burden in Pakistan, affecting about 6 to 10 percent of the overall population. The purpose of this research is to identify the baseline clinical and virological variables to predict the therapy outcomes. In this study, a total of 118 confirmed CHC-positive patients were selected based on the inclusion criteria. The HCV genotype and virus titer of the selected patients were measured. All patients received pegylated interferon with the addition of ribavirin. Analysis of variance (ANOVA) has been used for comparing variations in clinical data between patient groups. The clinical and virological data have been analyzed using correlation analysis. For the assessment of therapy response in patients, a binary logistic regression model has been used. ANOVA showed that differences in albumin %, AST/ALT ratio, and monocyte % between responders and non-responders have been statistically significant (P < 0.05). In the predictive analysis, three variables γ-GT, globulin, and albumin were predictors of treatment. Our study showed that clinical and virological parameters can be used as a useful tool for predicting treatment outcomes. These parameters can be used to accurate predictions of the Pakistani population in patients with newly diagnosed HCV-3a.
Short Communication · Volume 56, 23 March 2025 · Open Access
A Comparative Analysis of Baseline Variables in Responder and Non-Responder Groups of Chronic Hepatitis C patients
· · · · · · ·
Affiliations & Notes ⌄
- 1Division of Molecular Virology, CEMB, University of the Punjab, Lahore, Pakistan 2Department of Biological Sciences, Superior College University, Lahore, Pakistan 3Department of Statistics, Lahore College for Women University, Lahore, Pakistan 4Institute of Molecular Biology and Biotechnology, The University of Lahore, Lahore * Corresponding author: iram.amin@cemb.edu.pk
Article Info ⌄
- Journal:
- Pakistan Journal of Zoology
- Published:
- 23 March 2025

From the article
- The PEG-INF / RBV treatment period was observed in all CHC patients to find the patient’s treatment outcome.
- Of the 118 CHC patients, 73 (62%) achieved SVR, 27 (23%) failed to clear the virus called NR, and 18 (15%) patients responded at the start of treatment but were found the detectable amount of HCV after completion of the treatment, called R.
- Direct acting- antiviral (DAA) drugs are a new standard of care that has an SVR rate of > 90% in CHC-infected patients.
- However, when this study was conducted the standard treatment for HCV-infected patients was pegylated interferon plus ribavirin therapy.
Selected from the article's own text.
Abstract
Materials and methods
Patients infected with CHC were selected at the Lahore General Hospital. Exclusion criteria were: Patients who had previously received treatment, HIV, HGV, HBV co-infection, and liver genetic disease or alcohol history. All 118 patients received pegylated-interferon (180 mg/week) with ribavirin additive of 1000 to 1200 mg/day for 24 to 48 weeks.
Patients demographics (gender, age), virological (viral load, genotype), and clinical (liver function test, lipid profile and CBC) were collected before starting the treatment. After completion of 24 weeks of treatment, patients were classified as responders (SVR), non-responders (NR), and relapses (R). Responders were defined as no HCV viral load in serum detected after 24 weeks of treatment. Non-responders were defined as the persistence of HCV viral load during treatment. Relapse is defined as HCV viral load reappears after the treatment has been vanished.
Measurements of HCV viral concentration in patient’s serum was performed using a real-time PCR (Cepheid, Smart Cycler II) as described in the manufacturer’s manual. In this system, the viral concentration of patients less than 250 IU/ml was considered undetected for viruses. The HCV genotype was performed as described earlier .
Comparison of patient clinical and virological data between responder, non-responder and relapsed groups was achieved using one-way analysis of variance (ANOVA). The data were expressed as mean ± standard deviation. The relationship between clinical and virological variables was determined by applying correlation analysis. Logistic regression analysis was used to predict variables related to treatment response. All analysis was performed at Statistical Package for Social Sciences (SPSS) version; IBM-SPSS-22.0. Graphical analysis was carried out using Graph Pad Prism 7. A P-value (< 0.05) was considered significant.
Result
Table I shows baseline characteristics of 118 treatment-naïve patients with newly diagnosed CHC participated in the study. The PEG-INF / RBV treatment period was observed in all CHC patients to find the patient’s treatment outcome. Of the 118 CHC patients, 73 (62%) achieved SVR, 27 (23%) failed to clear the virus called NR, and 18 (15%) patients responded at the start of treatment but were found the detectable amount of HCV after completion of the treatment, called R.
Table I. Baseline characteristics of patients in responder, relapse and non-responder groups (Mean±SD).
| Variables | Responder | Relapse | Non responder |
| Gender (M/F) | 34/39 | 13/5 | 13/14 |
| Viral titer (IU/mL) | 1000297.32 ± 1554700.57 | 397161.89 ± 337948.41 | 1158644.48 ± 1880284.82 |
| γ-GT(IU/L) | |||
| ALT (IU/L) | 60.92±30.27 | 58.08±33.27 | 54.00±28.16 |
| AST (IU/L) | 46.68±25.92 | 43.85±23.28 | 48.79±24.09 |
| AST/ALT | 0.80±0.24 | 0.82± 0.30 | 0.94±0.17 |
| ALP(IU/L) | 202.47±65.42 | 187.72±43.39 | 217.90±60.87 |
| Total bilirubin (mg/dg) | 0.77±0.22 | 0.74±0.14 | 0.71±0.16 |
| Serum albumin (g/dg) | 4.42±0.52 | 4.41±0.63 | 4.76±0.61 |
| Globulin (g/dl) | 2.62±0.51 | 2.48±0.28 | 2.46±0.27 |
| Total proteins (g/dl) | 7.15±0.47 | 7.15±0.40 | 7.22±0.45 |
| Platelets (x109/L) | 229.45±80.74 | 224.11±69.82 | 234.55±78.45 |
| Neutrophils (%) | 54.65±9.61 | 58.94±8.49 | 55.79±11.06 |
| Lymphocytes (%) | 41.23±9.71 | 37.11±8.79 | 40.00±11.43 |
| Monocytes (%) | 1.88±0.73 | 1.83±0.85 | 2.34±0.61 |
| Total cholesterol (mg/dl) | 179.61±17.68 | 160.00±28.04 | 181.33±29.50 |
| Triglyceride (mg/dl) | 130.25±36.82 | 113.18±19.29 | 148.44±51.67 |
| HDL (mg/dl) | 37.74±6.10 | 41.75±7.53 | 38.61±6.00 |
| LDL (mg/dl) | 111.21±27.79 | 122.38±39.73 | 113.43±30.11 |
| VLDL (mg/dl) | 29.18±5.95 | 25.32±4.30 | 28.60±6.78 |
Data were expressed as mean±SD. M, male; F, female; ALT, alanine aminotransferase; AST, aspartate aminotransferase; ALP, alkaline phosphatase; albumin; Glb, globulin; γ-GT, gamma-glutamyl transferase; TC, total cholesterol; TG, triglycerides; HDL-c, high-density lipoprotein cholesterol; LDL-c, low-density lipoprotein cholesterol; VLDL-c, very low-density lipoprotein cholesterol.
To test the main difference between SVR, NR, and R groups, ANOVA was performed. Statistical differences (p<0.05) in serum albumin, AST/ALT ratio, and monocyte percentages between the SVR group and the NR group was observed from the results (Fig. 1).
The relationship between clinical data was calculated by correlation analysis. Viral titer is significant positive correlated with globulin (p= 0.025). ALT significant positive correlated with AST (p= 0.000), and γGT (p= 0.003) and negative correlated serum albumin (p= 0.014). AST/ALT ratio and serum albumin showed a positive correlation (p= 0.000). AST and γGT showed positive correlation (p= 0.004) (Table II). The pearson’s correlation was used to calculate the association between continuous versus continuous variables, and the Spearman correlation was used to calculate ordinal versus continuous.
To determine the variables related to the treatment response in patients with CHC, we applied logistic regression analysis. Predictive analysis in Table III showed γ–GT (p = 0.002), globulin (p= 0.001) and albumin (p= 0.000) were significantly associated with treatment response. Viral load, ALT, ALP, platelets, and cholesterol level showed no significant association with treatment response.
Table II. Correlation analysis of clinical and virological features of CHC patients.
| Variables | Correlation coefficient value | Significance (P-value) |
| Viral Titre and Globulin | 0.281* | 0.025 |
| ALT and γ –GT | 0.367** | 0.003 |
| ALT and AST | 0.839** | 0.000 |
| ALT and Serum Albumin | -0.224* | 0.014 |
| AST and γ –GT | 0.367** | 0.004 |
| AST/ALT ratio and serum albumin | 0.374** | 0.000 |
Discussion
In the last decade, excellent advancement has been made in CHC disease treatments. The ultimate goal of HCV treatment is to attain SVR, which results in improved quality of life and a decrease in risk factors such as liver fibrosis, cirrhosis, and HCC. Direct acting- antiviral (DAA) drugs are a new standard of care that has an SVR rate of > 90% in CHC-infected patients. However, when this study was conducted the standard treatment for HCV-infected patients was pegylated interferon plus ribavirin therapy.
Table III. Logistic regression analysis of predictors of treatment response to PEG-INF/RBV treatment in CHC patients.
| Variables | B | S.E | P value | OR | C.I for OR (95%) | |
| Lower | Upper | |||||
| γ-GT | -.094 | .040 | .020 | .911 | .842 | .985 |
| Globulin | 3.248 | 1.328 | .014 | 25.747 | 1.906 | 347.751 |
| ALT | -.071 | .081 | .385 | .932 | .795 | 1.093 |
| AST | .092 | .093 | .321 | 1.096 | .914 | 1.314 |
| AST/ALT ratio | -3.566 | 4.048 | .378 | .028 | .000 | 78.954 |
| Serum albumin | 3.594 | 1.189 | .003 | 36.368 | 3.539 | 373.754 |
| Total bilirubin | 1.909 | 1.835 | .298 | 6.743 | .185 | 246.073 |
| Platelets | -.010 | .006 | .081 | .990 | .979 | 1.001 |
Significance level: P < 0.05; S.E, standard error; CI, confidence interval; OR, odds ratio.
Earlier data in literature have shown that 40-45% of HCV genotype 1 and 80% of genotype 2a/3a patients achieved SVR on receiving pegylated interferon plus ribavirin . Even in the presence of newly developed DAA therapy, pegylated interferon plus ribavirin is still very successful in the treatment of HCV according to the patient guidelines of EASL and AASLD . Although the cause of treatment failure is unknown, various host and viral variables have been identified as predictors of therapy response. The major goal of this study was to look at the host and viral variables that influence SVR and NR responses throughout treatment. Several findings came out of our research. The current study finding showed that 73 (62%) patients achieved the SVR and 45(38%) failed with pegylated interferon plus ribavirin therapy from 118 HCV genotype-3a patients. The treatment outcome is consistent with other clinical studies, in which the SVR rate is estimated to be 60-80% ; .
The current study’s other finding is that the AST/ALT ratio differs markedly between SVR and NR. During the infection liver enzymes are changed . The AST/ALT ratio has been considered a reliable marker of hepatic fibrosis and cirrhosis caused by viral infection . In our study, the AST/ALT ratio clearly shows the statistically significant differences between SVR and NR. In comparison to SVR, NR patients exhibited a greater AST/ALT ratio . There is no data available, especially on the role of the ratio (AST/ALT) in predicting the response to treatment in CHC patients having genotype 3a.
Our finding indicated the significant role of γ-GT levels in treatment responses. These findings are consistent with reported data which showed that γ-GT levels are changes in viral infection . To the best of our latest understanding, this is the first of its kind to use the logistic regression model to describe γ-GT levels in the prediction of response to treatment in HCV genotype 3a. In our study, γ-GT showed a significant correlation with ALT, HCV viral load, and AST. These findings show serum γ-GT levels changes in CHC infection.
The finding of this study showed the role of serum albumin in therapy. The relevance of serum albumin in CHC patients with genotype 3a after treatment is poorly understood, according to the literature. ALB has recently gained popularity as a biomarker for predicting survival in a variety of cancers . Protein albumin is made from the liver and it prevents the discharge of fluid from blood vessels. All-time low levels of albumin in CHC patients are an indicator of a lack of human defense mechanisms and advanced liver disease. Research data indicate that serum albumin is a predictor of HCC and is associated with treatment response . In our study, serum albumin was significantly associated with therapeutic effects. Our study found differences in serum albumin between responders and non-responders.
Our findings indicate that globulin, a serum protein, could be utilized as a suitable biomarker in the context of therapeutic response. Globulin is a vital protein in our blood that is produced by the liver. Globulins are involved in liver function, and infection resistance . From our results, an association of serum globulin with treatment response in HCV infection was observed. So, serum globulin level can serve as a biomarker of therapy response.
In conclusion, our findings showed that pre-treatment γ-GT levels, monocytes %, and albumin levels are predictors of response to pegylated-interferon/ ribavirin therapy. These non-invasive clinical markers can replace the need for liver biopsy because liver biopsy procedures are known to have limitations and complications in patients with cirrhosis.
Acknowledgment
All authors acknowledge the Doctors and para-scienrtific staff of Lahore General Hospital, Lahore for their cooperation in sample collection.
Ethics statement
The Research Ethics Committee of the Centre of Excellence in Molecular Biology (CEMB), University of Punjab, has approved this study. This study complies with the Helsinki Declaration of 1975. Written informed consent has been obtained to collect research samples.
Statement of conflict of interest
The authors have declared no conflict of interest.
Figures
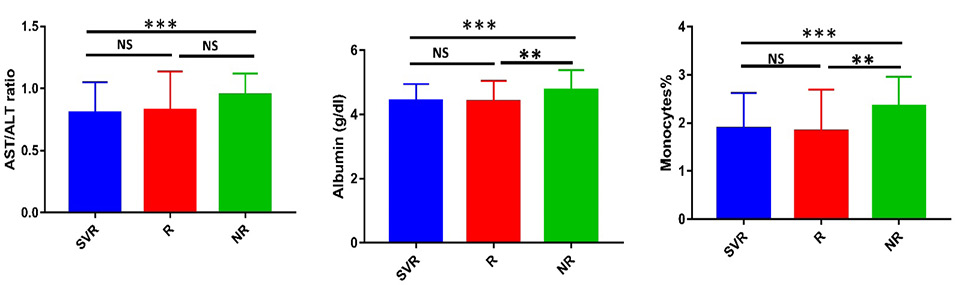
Variation in baseline variables in responder (SVR), relapse (R) and non-responder (NR) patients.
References
- Akhtar, S. and Moatter, T., 2007. Am. J. trop. Med.Hyg., 76:446-449.
- Arshad, A. and Ashfaq, U.A., 2017. Crit. Rev. Eukaryot. Gene Expr., 27: 63-77. https://doi.org/10.1615/CritRevEukaryotGeneExpr.2017018953[CrossRef]
- Åberg, F., Danford, C.J., Thiele, M., Talbäck, M., Rasmussen, D.N., Jiang, Z.G., Hammar, N., Nasr, P., Ekstedt, M. and But, A., 2021. Hepatol. Commun., 5: 1021-1035.
- Everhart, J.E. and Wright, E.C., 2013. Hepatology, 57: 1725-1733.
- Fried, M.W., Shiffman, M.L., Reddy, K.R., Smith, C., Marinos, G., Gonçales, Jr. F.L., Häussinger, D., Diago, M., Carosi, G. and Dhumeaux, D., 2002. N. Engl. J. Med., 347: 975-982.
- Ghany, M.G., Strader, D.B., Thomas, D.L. and Seeff, L.B., 2009. Hepatology, 49:1335.
- Hu, S.X., Kyulo, N.L., Xia, V.W., Hillebrand, D.J. and Hu, K-Q., 2009. J. clin. Gastroenterol., 43:758-764.
- Idrees, M., 2008. J. Virol. Methods, 150: 50-56. https://doi.org/10.1016/j.jviromet.2008.03.001[CrossRef]
- Li, Q., Lyu, Z., Wang, L., Li, F., Yang, Z. and Ren, W., 2020. OncoTargets Therap., 13: 2377.
- Mangia, A., Santoro, R., Minerva, N., Ricci, G.L., Carretta, V., Persico, M., Vinelli, F., Scotto, G., Bacca, D. and Annese, M., 2005. N. Engl. J. Med., 352: 2609-2617.
- Meringer, H., Shibolet, O. and Deutsch, L., 2019. World J. Gastroenterol., 25: 3929.
- Martinez, M.A. and Franco, S., 2020. Viruses, 13: 41. https://doi.org/10.3390/v13010041[CrossRef]
- Muhammad, N. and Jan, M.A., 2005. J. Coll. Physic.Surg. Pakistan (JCPSP), 15:11-14.
- Nagao, Y. and Sata, M., 2010. Virol. J., 7:1-5.
- Niederau, C., Mauss, S., Schober, A., Stoehr, A., Zimmermann, T., Waizmann, M., Moog, G., Pape, S., Weber, B. and Isernhagen, K., 2014. PloS one, 9:e107592.
- Puoti, M., Rossotti, R., Baiguera, C. and Orso, M., 2016. Liver Int. Offi.J. Int. Assoc. Stud. Liver, 36: 181-184.
- Quaranta, M.G., Ferrigno, L., Tata, X., D’Angelo, F., Coppola, C., Ciancio, A., Bruno, S.R., Loi, M., Giorgini, A. and Margotti, M., 2021. BMC Infect. Dis., 21:1-9.
- Schmilovitz-Weiss, H., Cohen, M., Pappo, O., Sulkes, J., Braun, M., Tur-Kaspa, R. and Ben-Ari, Z., 2007. Clin.l Transplant., 21:391-397.
- Sheth, S.G., Flamm, S.L., Gordon, F.D. and Chopra, S., 1998. Am. J. Gastroenterol., 93: 44-48.
- Torge, D., Bernardi, S., Arcangeli, M. and Bianchi, S., 2022. Pathogens, 11: 867. https://doi.org/10.3390/pathogens11080867[CrossRef]
Services
Article usage statistics
Loading…