Journal of Animal Health and Production
Research Article
The Metabolic Impact and Beneficial Effects of Different Energy Restriction Protocols in Rats: An Alternative Health Plan
Khalifa El-Dawy1, Amany I. Ahmed1, Samar I. Sharsher2, Mohamed Metwally3, Ahmed Hamed Arisha4,5*
1Department of Biochemistry, Faculty of Veterinary Medicine, Zagazig University, 44519 Zagazig, Egypt. 2Zagazig University Student’s Hospital, Zagazig University, 44519 Zagazig, Egypt. 3Department of Pathology, Faculty of Veterinary Medicine, Zagazig University, 44519 Zagazig, Egypt. 4Department of Animal Physiology and Biochemistry, Faculty of Veterinary Medicine, Badr University in Cairo (BUC), Badr City, Cairo, Egypt. 5Department of Physiology, Faculty of Veterinary Medicine, Zagazig University, 44519 Zagazig, Egypt.
Abstract | Intermittent fasting (IF) is a preventative tool that influence the metabolic activity in different animal models. Short term fasting is a common laboratory procedure performed during various types of experiments to facilitate surgical procedures or to decrease variability in investigatory parameters; however, the long-term impacts of intermittent energy restriction on body metabolism remains poorly studied. Forty-five male adult Sprague Dawley rats weighing 200 ±20g, were divided into three groups, each of 15 rats; CON: control group (rats fed typical rat chow, ad libitum), ADF: the alternate day fasting group, and TRF: time-restricted feeding group (rats fasting for two days a week plus the three middle lunar days in the month) for a period of three months. The results showed that the reduction in body weight in ADF group was more than TRF group. Total cholesterol (TC), triglycerides (TAG), low density lipoprotein cholesterol (LDL-c) and very low density lipoprotein cholesterol (VLDL-c) were decreased, whereas adiponectin was increased in both ADF and TRF groups in a time-dependent manner, especially in ADF group. Marked downregulation in the mRNA expression of key enzymes (glucose 6-phosphate dehydrogenase (G6PD) and transketolase (TKT)) of pentose phosphate pathway was noticed in both ADF and TRF groups as compared to CON group. A significant improvement in oxidant/antioxidant status was noticed in ADF and TRF compared to CON group. The metabolic benefits of TRF appeared quite less effective on most parameters as compared to ADF, however, further research is warranted using modified diet restriction protocols in healthy as well as disease models.
Keywords | ADF, TRF, G6PD, TKT, Fasting
Received | July 21, 2021; Accepted | August 08, 2021; Published | August 25, 2021
*Correspondence | Ahmed Hamed Arisha, Department of Physiology, Faculty of Veterinary Medicine, Zagazig University, 44519 Zagazig, Egypt; Email: vetahmedhamed@zu.edu.eg
Citation | El-Dawy K, Ahmed AI, Sharsher SI, Metwally M, Arisha AH (2021). The metabolic impact and beneficial effects of different energy restriction protocols in rats: an alternative health plan. J. Anim. Health Prod. 9(s1): 87-94.
DOI | http://dx.doi.org/10.17582/journal.jahp/2021/9.s1.87.94
ISSN | 2308-2801
Copyright © 2021 Khalifa et al. This is an open access article distributed under the Creative Commons Attribution License, which permits unrestricted use, distribution, and reproduction in any medium, provided the original work is properly cited.
INTRODUCTION
Maintaining energy balance in a state of equilibrium is significant for all living organisms; the body struggles to supply a stable balance between energy consumed and expended. Many abnormalities including insulin resistance, dyslipidemia, and chronic inflammation are associated with obesity, and elevated risk for type 2 diabetes. Moreover, obesity reported for an elevated risk for multiple cancer types involving cancers of the colon and rectum, liver, esophagus, and endometrium (Lauby-Secretan et al., 2016). In obesity, there is a chronic, low-grade inflammation in adipose tissue; this will directly develop oxidative stress (Marseglia et al., 2015). Different approaches of dietary caloric restriction/fasting are practiced to overcome obesity associated complications. Caloric restriction is the only behavioral intervention can extend lifespan in model organisms – especially mammals – while concurrently protecting against the decrease of biological function and decline several age-related diseases risk (Minor et al., 2010).
Health advantages of intermittent fasting are shown in several experimental studies and randomized controlled trials (Jane et al., 2015). Caloric restriction (CR) has been known to impede the development of some chronic degenerative and inflammatory disorders. Calorie restriction outcome on longevity has been associated with fasting-induced changes of neuroendocrine systems, elevated systemic production of neurotrophic factors, hermetic stress responses, decreased oxidative stress, reduced production of pro-inflammatory cytokines and insulin resistance. Also, reduced aging-associated signals and promotion of autophagy (Desgorces et al., 2016).
Prolonged fasting has several positive effects on mood owing to physiological alterations at a cellular level via improving the production and availability of central endogenous neurotransmitters, opioids and endocannabinoids (Michalsen, 2010). On the opposite hand, harmful effects of fasting are shown on alterations to cognitive function, and sleep patterns (BaHammam et al., 2010) as well as fluctuations in weight, and mood (Parnell and Reimer, 2009).
Beside glycolysis and the tricarboxylic acid cycle, the pentose phosphate pathway (PPP) was of the first metabolic pathways to be identified. Coenzyme NADP+ is mandatory for the oxidation of glucose 6-phosphate to 6-phosphogluconate, by an enzyme called glucose 6-phosphate dehydrogenase (G6PD). The PPP is a central link between cellular biosynthetic metabolism and in maintaining and controlling the redox homeostasis of cells. Also, some human diseases including neurodegenerative disorders, metabolic syndrome, and cancer are related to pentose shunt (Riganti et al., 2012).
In this study, two protocols of fasting are investigated, namely, the alternate day fasting (ADF) and time-restricted feeding (TRF). (ADF) is a type of intermittent fasting (IF) where persons alternate between no calories consumed for one day and feeding with no restriction during the next (Riganti et al., 2012). The term TRF is a subcategory of IF describing the eating pattern where food intake is restricted to only 8 hrs or less most days. The classification of TRF as a kind of IF is tricky because TRF is profoundly distinct from fasting for an entire day. TRF is basically a proper eating pattern where individual eats only during the day but not at night. Limiting the eating time may be useful to decrease the overall caloric intake; though, TRF does not essentially mean caloric restriction. Hence, TRF is considered distinct from IF as it entails the component of timing optimally aligned to the biological day (Mattson et al., 2017). Overall, this work was designed to investigate the effect of two protocols of chronic fasting (for a period of three months) with a religious background including ADF (alternate day fasting) and TRF (time restricted feeding) mainly on bodily metabolic state with reference to the hepatic expression of pentose phosphate pathway key enzymes, namely, Glucose 6-Phosphate. Dehydrogenase (G6PD) and Transketolase (TKT).
MATERIALS AND METHODS
Laboratory animals and experimental Design
Forty-five male adult Sprague Dawley rats weighing 200 ±20g from the Faculty of Veterinary Medicine central animal house, Zagazig University, Egypt were used. They were acclimatized for two weeks under standard laboratory circumstances. The animals were housed under conventional laboratory circumstances through the period of experiment in 22±2oC temperature, with a light/dark cycles of 12 hrs and free access to food and water. This animal experiment was performed in accordance with the procedures with approval number (ZU-IACUC/2/F/195/2019). The study lasted for three months. The initial body weight at 1st day of experiment, as well as every week were recorded. After adaptation for two weeks, rats were subdivided into three groups:
-The first one is a normal control group (G1, CON, n=15 rats), the rats were supplied with the typical rat chow and water.
- The second group (G2, ADF, n=15) rats day on day off fasting.
-The third group (G3, TRF, n=15) rats fasting for two days a week plus the three middle lunar days in the month.
Sample collection
Blood and tissues samples were collected at the end of 1st, 2nd, 3rd months. Blood sample were collected, serum was separated and used for the assessment of serum insulin, adiponectin levels, and lipid profile. After scarifying, the liver was excised, wrapped in aluminum foil and soon snap-frozen until stored at -80oC for gene expression analysis. One gm of liver tissue was stored at – 20oC for malondialdehyde (MDA) and total antioxidant capacity (TAC) determination.
Table 1: Specific real time PCR primers for examined genes.
| Accession number | Product length | Primers | Gene |
| NM_017006.2 | 74 | GCCTTCTACCCGAAGACACCTT | G6PD |
| CTGTTTGCGGATGTCATCCA | |||
| NM_022592.1 | 216 | TACCACAAGCCTGACCAGCAGA | TKT |
| CTTGGAGAGCACAAAGCGGTCA | |||
| NM_017008.4 | 143 | GGCACAGTCAAGGCTGAGAATG | GAPDH |
| ATGGTGGTGAAGACGCCAGTA |
Determination of body mass index (BMI) and abdominal circumference
Both rat weight and nose-anus length (NAL) for all experimental groups were measured at the end of 1st, 2nd, 3rd months. BMI was calculated by dividing rat weight (g) and the square of the nose-anus length (cm).
Biochemical measurements
Serum insulin and adiponectin concentrations were estimated using rat ELISA kit (Cusabio, San Diego, CA, USA) according to the manufacturer’s protocol. Lipid profile (total cholesterol (TC), triglycerides (TAG), low density lipoprotein cholesterol (LDL-c) and very low density lipoprotein cholesterol (VLDL-c)) was performed using commercially available kits obtained from Spectrum kits (Egyptian Company for Biotechnology, Cairo, Egypt). The TAC as well as MDA were measured by available kits from MyBioSource (USA) according to manufacturer’s instruction.
Histopathological examination
Liver and subcutaneous (S/C) white adipose tissue (WAT) specimens were properly embedded in paraffin, sectioned into 5 µm then stained with hematoxylin and eosin according to Layton and Suvarna, (2013) and analyzed using a light microscope.
Real time RT-PCR
Total RNA extraction as well as reverse-transcription has been previously reported in details (Arisha et al., 2019; Arisha and Moustafa, 2019) and were performed according to the manufacturer’s instructions. The real-time RT-PCR was performed in a Mx3005P Real-Time PCR System (Agilent Stratagene, USA) using Maxima SYBR Green/Rox qPCR Master Mix (2X) (ThermoFisher Scientific, Waltham, MA, USA) following the manufacturer’s instructions using primers as shown (Table 1). The relative expression of the different genes of interest normalized to the internal control GAPDH was reported as a fold change (Livak and Schmittgen, 2001).
Data analysis and statistics
All data were analyzed by Graph Pad prism 8.0.2 (GraphPad Software, Inc). The results were reported as Mean ± SEM. Data were screened and Shapiro-Wilk test was applied to test normality assumption, Levene’s test also was run to evaluate homogeneity of variance. The assumption achievement was checked at P value <0.05. Two-way ANOVA was run for assumption met data to test differences among groups for certain parameters with different treatments at different times of experiment. Significant results followed by Bonferroni test.
RESULTS
Effect of fasting protocols (ADF or TRF) on body weight change and anthropometric measurements
A significant (P < 0.05) reduction in body weight was noticed in ADF group from starting at the 5th till the 12th weeks compared to the control group. A significant (P < 0.05) reduction in body weight was noticed only in 7th, 8th and 9th weeks in TRF group compared to the control group. The reduction in the body weight was more pronounced in ADF than TRF groups (Fig 1 A). No significant (P < 0.05) alterations in length were noticed in the two fasting protocols followed compared to the control group (Fig 1 B). Significant (P < 0.05) reduction in both abdominal circumference and BMI were noticed in ADF rats compared to the control group (Fig 1 C). The reduction in BMI in ADF group was noticed starting from the first month which became statistically significant (P < 0.05) than both control group and TRF group in the second month. A significant (P < 0.05) reduction in BMI of TRF group was noticed only after three months compared to the control group (Fig 1 D).
Effect of fasting protocols (ADF or TRF) on serum insulin (ng/ml) level
A significant (P < 0.05) reduction in serum insulin level was noticed in both ADF and TRF groups compared to the control rats only after three months of fasting. ADF protocol of fasting produced more pronounced reduction than TRF protocol (Fig 2).
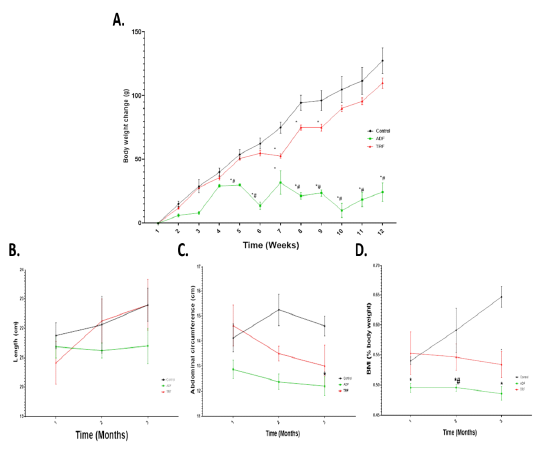
Figure 1: Body weight change and anthropometric measurements in different fasting protocols (ADF or TRF) for 3 months. Values are mean ± SEM. * P < 0.05 vs control. # P < 0.05 vs TRF.
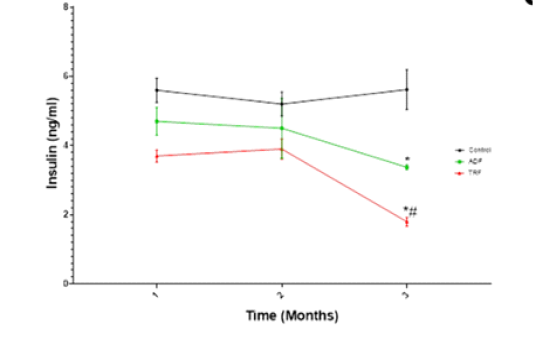
Figure 2: Serum insulin (ng/ml) level in different fasting protocols (ADF or TRF) for 3 months. Values are mean ± SEM. * P < 0.05 vs control. # P < 0.05 vs TRF.
Effect of fasting protocols (ADF or TRF) on lipid profile
As illustrated in Figure 3, a significant (P < 0.05) decrease in TC was noticed after 2 or 3 months of TRF protocol as well as after 3 months of ADF protocol compared to the control group (Fig 3 A). A significant (P < 0.05) decrease in TAG was noticed after 2 or 3 months of ADF protocol as well as after 3 months of TRF protocol compared to group 1 (Fig 3 B). A significant (P < 0.05) increase in HDL-c was only noticed after 3 months of ADF protocol compared to the control group (Fig 3 C). A significant (P < 0.05) reduction in LDL-c was noticed after 2 or 3 months of TRF protocol as well as after 3 months of ADF protocol compared to the control group (Fig 3 D). A significant decrease in (P < 0.05) VLDL-c was noticed after 2 or 3 months of ADF protocol as well as after 3 months of TRF protocol compared to the control group (Fig 3 E).
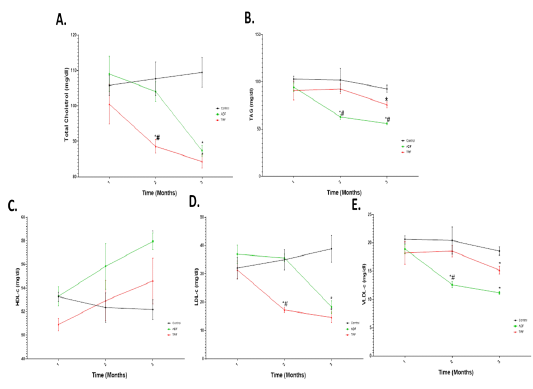
Figure 3: Total cholesterol (TC), Triacylglycerol (TAG), HDL-c, LDL-c and VLDL-c (mg ̸ dl) in different fasting protocols (ADF or TRF) for 3 months. Values are mean ± SEM. * P < 0.05 vs control. # P < 0.05 vs ADF.
Effect of fasting protocols (ADF or TRF) on serum adiponectin levels and hepatic TAC and MDA levels
A significant (P < 0.05) increase in serum levels of adiponectin in ADF or TRF was noticed compared to group 1. More significant (P < 0.05) increase was noticed in ADF group compared with TRF group, a marked (P < 0.05) increase was noticed in the 3rd month of ADF group as illustrated in (Fig 4 A). A significant (P < 0.05) increase in hepatic levels of TAC in ADF or TRF was noticed compared to the group 1. More significant (P < 0.01) increase in hepatic TAC was noticed in ADF group in comparison with TRF group 1 as illustrated in (Fig 4 B). A significant (P < 0.05) decrease in hepatic levels of MDA in ADF or TRF was noticed compared to group 1. More significant (P < 0.01) decrease was noticed in ADF group compared to TRF group as illustrated in Fig 4 C.
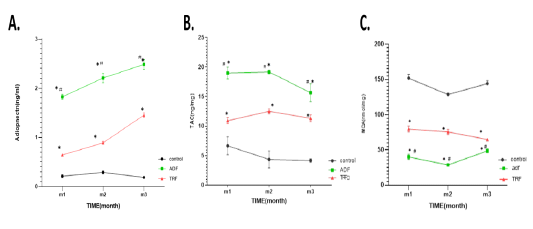
Figure 4: Serum adiponectin levels and hepatic TAC and MDA levels in different fasting protocols (ADF or TRF) for 3 months. Values are mean ± SEM. * P < 0.05 vs control, # P < 0.05 vs TRF, ***P<0.0001vs TRF.
Effect of fasting protocols (ADF or TRF) on hepatic mRNA expression levels of G6PD and TKT
A significant (P < 0.05) downregulation in the mRNA expression of G6PD in the main effect of groups following either ADF or TRF protocols was observed compared to the control group (Fig 5 A). A significant (P < 0.05) downregulation in the mRNA expression of TKT was recorded in the main effect of groups following only ADF protocol compared to the control or TRF group as illustrated in (Fig 5 B).
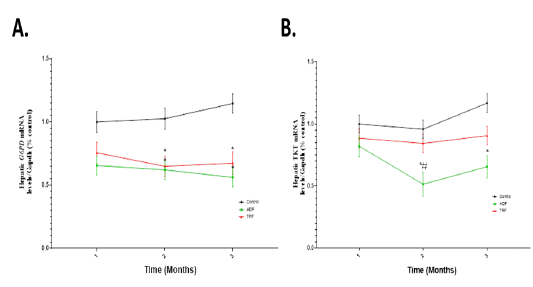
Figure 5: Hepatic mRNA expression levels of G6PD and TKT in different fasting protocols (ADF or TRF) for 3 months. Values are mean ± SEM. * P < 0.05 vs control. # P < 0.05 vs ADF.
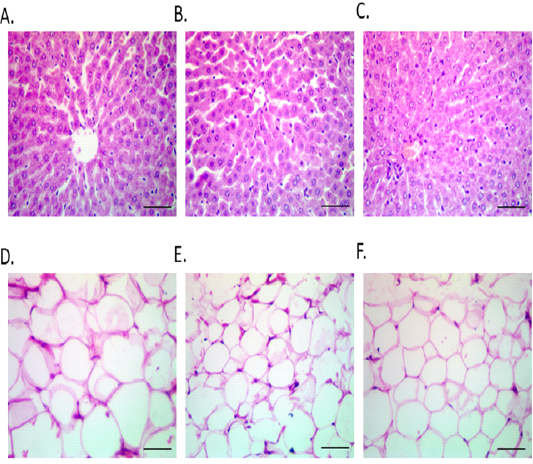
Figure 6: Hepatic and S/C WAT photomicrographs in different fasting protocols (ADF or TRF) for 3 months. Hepatic histological architecture of CON (Fig. 6 A), ADF (Fig. 6 B) and TRF (Fig. 6 C) groups. Subcutaneous white adipose tissue had largest diameter in CON (mean diameter=81.31mm) (Fig. 6 D), than ADF (mean diameter=30.6mm) (Fig. 6 E) and TRF groups (mean diameter=51.85mm) (Fig. 6 F).
Effect of fasting protocols (ADF or TRF) on hepatic and S/C WAT histopathology
Normal hepatic histological architecture was noticed in all experimental groups; either the control or the two fasting protocols groups as shown in Figure 6 (A-C). A significant reduction in the size of adipocytes was noticed in both ADF and TRF protocols after three months as shown in Figure 6 (D-F). Control group had the largest diameter (mean diameter=81.31mm) (Fig 6 D), ADF group had the most reduction in the diameter (mean diameter=30.6mm) (Fig 6 E) and TRF group had medium diameter (mean diameter=51.85mm) (Fig 6 F).
DISCUSSION
Caloric restriction is the only behavioral intervention that can extend lifespan in model organisms – especially mammals – while concurrently protecting against the decrease of biological function and decline several age-related diseases. Following proper intermittent energy restriction (IER) strategies for instance IF, for 2–3 days per week or on alternate days, and TRF has been reported to employ positive consequences on the body composition and energy expenditure (Minor et al., 2010). In this study, two protocols were researched; the alternate day fasting (ADF) that includes a 24-hour fasting period followed by a 24-hour feeding period as well as the time restricted feeding (TRF) which included fasting for limited time (about 12 hours) in specific days per week and month i.e., repeated 2 days per week (Monday and Thursday) plus the three lunar days in the middle of the month. The study was conducted for three months.
An expected advantage of fasting in both groups is the significant impact on fat mass and insulin resistance in the fasting period. Our study showed that the weight of rats decreased by fasting in both groups of fasting; A decrease in weight in ADF group was noticed after 1st month and a marked reduction in BMI was noticed starting from the 1st month till the 3rd month of fasting in comparison with the non-fasting group but TRF group showed a significant decrease in BMI in the 3rd month compared with control. Also, in agreement with our results, the good effects of fasting including effects on metabolism are often attributed to the decrease in body weight and/or fat (Anton et al., 2018). Other studies that approved ADF using a relatively high degree of CR in their dietary intervention resulted in profound decline in body weight (Catenacci et al., 2016; Eshghinia and Mohammadzadeh, 2013). Whereas, a relatively minor weight reduction was accomplished in studies using TRF regime with a lesser degree of CR (Moro et al., 2016; Tinsley et al., 2017).
On the other hand, in anthropometric results, no significant weight loss was noticed in studies that modified the time of the fasting but keeping the total calorie intake (Sutton et al., 2018). Regarding the effect of intermittent fasting on insulin level; this study showed that there was a reduction in insulin level in both groups of fasting in the 3rd month. A marked reduction in insulin level was that of TRF (which had significant difference than that of ADF and control).
Findings of our research indicated a marked decrease in total cholesterol level at 2nd and 3rd month of TRF group and 3rd month of ADF group than that of control group. In addition, TAG and VLDL-c were time dependent; they decreased by time of fasting in both groups, but more reduction was noticed in ADF group than TRF group. As marked reduction in TAG, VLDL-c level was noticed starting from 2nd month of ADF group but the decrease in TRF group started at the 3rd month of fasting.
A marked reduction in LDL-c level was shown at 2nd and 3rd month of TRF that weren’t showed a significant difference than the values in 3rd month of ADF group. Regarding HDL-c, no change was noticed in TRF group, but there is slight increase in the 3rd month of ADF group which had significant difference than that of control and TRF group. Dietary intake restriction may also enhance lipoprotein lipase (LPL) activity so boosting triglyceride clearance in the blood vessels. Such rises in LPL add to the catabolism of lipoproteins rich in triglycerides (Eshghinia and Mohammadzadeh, 2013). In agreement with our results, both TC and LDL-c levels reduce during fasting (Sarri et al., 2009). On the other hand, one study reported a decline in HDL-c levels, whereas other studies stated no change (Papadaki et al., 2008).
As for adiponectin, this study recorded an increase in its level in both groups of fasting than control group this elevation was time related. More noticed increase was in ADF group which is statistically significant than TRF group. The highest Adiponectin level was detected at 3rd month of ADF group. In agreement with this record, adiponectin levels are negatively linked with insulin resistance and fat mass (Goldstein and Scalia, 2004). We suggest that fasting has improved the accumulation and size of central fat. After 12 hours of fasting, lipolysis begins in adipose tissue and then changes the metabolic activity toward fat mobilization as a form of fatty acid-derived ketones.
Regarding to MDA, more food intake increases food peroxidation of free fatty acids which lead to an elevation in the level of free radicals (increased MDA, food peroxidation markers). In both fasting groups there was a marked decrease in MDA level (time dependent). A marked reduction was noticed in ADF group. An increase in total antioxidant capacity was noticed by fasting in both groups (ADF, TRF). More increasing in TAC level was noticed in ADF group. Lipid peroxidation is a cellular injury mechanism indicating the level of oxidative stress in cells and tissues (Chausse et al., 2015). CR has been suggested to prevent and manage oxidative stress, therefore, the lowering the concentrations of MDA formed me.
Regarding to hepatic G6PD, a significant downregulation in the mRNA expression of G6PD in the main effect of groups following either ADF or TRF protocols compared to the control group. A significant downregulation in the mRNA expression of TKT in the main effect of groups following only ADF protocol compared to the control or TRF group. In agreement with our results, in mouse, G6PD increased transcription upon oxidative stress (Kletzien et al., 1994). As in fasting there is lipolysis and decreasing in oxidative stress. So, the enzyme decreases in such cases. During stressful conditions, the PPP has been linked to the induction of stress-responsive gene expression (Krüger et al., 2011).
Histopathology results showed that the health state of the liver of rats in the three groups (Control, ADF, TRF). But there was difference in adipose tissue size in the three groups the highest diameter of fat cells was noticed in the Control group in the third month. A marked reduction in the size of fat cell was noticed in the third month of ADF than TRF group. The reduction in the fat cell size was time dependent in both ADF group and TRF group as third month of each group has more reduction than second month which has more reduction than first month of the same group. This reduction by fasting is due to decrease food intake by time which leads to increase lipolysis in adipose tissue in control group gradual increase in the size of the fat cell by time was noticed (Second month fat cells size greater than first month, in third month fat cell size greater than second month fat cell size). This is due to increasing food intake by time leads to increasing fat synthesis inside adipose tissue.
CONCLUSIONS
This study ensures that fasting significantly decreased the BMI, and increased adiponectin concentration in normal individuals without any chronic metabolic disease. Also, fasting may reduce oxidative stress as shown by increasing total antioxidant capacity. Moreover, fasting cause slight decrease in G6PD and TKT mRNA expression due to lipolysis and decreasing oxidative stress. Evidently, following proper fasting regimes has several health benefits, deserving more research in participants with Type 2 diabetes mellitus and cardiovascular diseases, including healthy-weight individuals. While the metabolic gains of TRF seem quite less effective on most parameters, there is some suggestion that the metabolic alterations produced by the two fasting protocols should be further harvested in disease models.
Conflict of Interest
The authors declare no conflicts of interest, financial or otherwise.
AUTHOR CONTRIBUTIONS
All authors performed the experiments, analyzed the data, interpreted the results of the experiments, and drafted the manuscript.
ETHICAL STATEMENT
All animal experiments were approved by the Faculty of Veterinary Medicine, Zagazig University Animal Research Ethics and were done in accordance with their guidelines for Animal Care (ZU-IACUC/2/F/190/2019).
References


