
Advances in Animal and Veterinary Sciences


Research Article

Impact of Heating Systems on Air and Litter Quality in Broiler Houses, Performance, Behavior, and Immunity in Broiler Chickens
Essam S. Soliman1*, Ahmed A. Ali2, Rehab E.M. Gafaar3
*1Animal, Poultry and Environmental Hygiene Division, Department of Animal Hygiene, Zoonosis, and Animal Behavior, Faculty of Veterinary Medicine, Suez Canal University, Ismailia 41522, Egypt. ORCID: 0000-0001-5824-5957; 2Animal Behavior and Management Division, Department of Animal Hygiene, Zoonosis, and Animal Behavior, Faculty of Veterinary Medicine, Suez Canal University, Ismailia 41522, Egypt. ORCID: 0000-0001-6532-6990; 3Food Hygiene Department, Animal Health Research Institute, Ismailia, Egypt, 41513.
Abstract | Achieving optimum thermoneutral zone in broiler houses provokes enhanced performance, productivity, and welfare. The influence of different heating systems on microclimatic air quality, litter abiotic, performance, behavior, some carcass characteristics, intestinal microbiota, E. coli & Salmonella isolation, immunoglobulin concentrations, and cortisol levels in broilers was studied. Two hundred one-day-old female Ross® 308 broilers were divided into four groups (50 each) in four independent rooms (G1, G2, G3, and G4) supplied with gas-operated, halogen, oil, and portable air conditioner heaters, respectively. A total of 1520 samples including 200 litter, 200 air, 160 sera, 160 intestinal swabs, 160 breast muscles, and 640 organ samples including liver, spleen, heart, and bursa of Fabricius were collected. The results revealed highly significant declines (P < 0.01) of carbon dioxide and ammonia concentrations, litter pH and moisture percentages, feed conversions, water intakes, locomotion & panting behaviors, alanine aminotransferase, aspartate aminotransferase, urea, creatinine, total bacterial and Enterobacteriaceae counts, E. coli and Salmonella isolation and counts, and cortisol levels, as well as, highly significant increases (P < 0.01) of weight gains, performance indices, live weights, feeding & resting behaviors, carcass and organs weights, total protein, albumin, and immunoglobulin concentrations in broilers raised with oil and portable air conditioner heaters rather than those reared with a gas-operated torch and halogen heaters. The study concluded that using an advanced and clean source of heat as oil or air conditioner heaters can meet the broiler’s microclimatic requirements without representing a source of stress on birds.
Keywords | Air quality, Behavior, Broilers, Heating systems, Litter abiotic, Immunoglobulin.
Received | September 14, 2020; Accepted | October 18, 2020; Published | January 01, 2021
*Correspondence | Essam S Soliman, Animal, Poultry and Environmental Hygiene Division, Department of Animal Hygiene, Zoonosis, and Animal Behavior, Faculty of Veterinary Medicine, Suez Canal University, Ismailia 41522, Egypt. ORCID: 0000-0001-5824-5957; Email: soliman.essam@vet.suez.edu.eg
Citation | Soliman ES, Ali AA, Gafaar REM (2021). Impact of heating systems on air and litter quality in broiler houses, performance, behavior, and immunity in broiler chickens. Adv. Anim. Vet. Sci. 9(2): 301-314.
DOI | http://dx.doi.org/10.17582/journal.aavs/2021/9.2.301.314
ISSN (Online) | 2307-8316; ISSN (Print) | 2309-3331
Copyright © 2021 Soliman et al. This is an open access article distributed under the Creative Commons Attribution License, which permits unrestricted use, distribution, and reproduction in any medium, provided the original work is properly cited.
INTRODUCTION
The creation of special microclimatic conditions inside broiler farms represents a dynamic continuous process depending on the macroclimatic conditions including air maximum and minimum temperatures and relative humidity. Broilers demand special microclimatic requirements include physical determinants as thermal zone, relative humidity, lighting regimen, and bedding (Nawalany, 2012), chemical determinants as indoor gases like ammonia, sewer gases, and carbon dioxide levels (Vale et al., 2010), and broiler’s stocking density (Bodo and Gálik, 2018) during overwhelming seasons (winter and summer) to overcome the harsh macroclimatic conditions and to achieve the required poultry hygiene standards (Radon et al., 2004).
Achieving optimum thermal zone requirements in broiler houses contribute to the broiler’s welfare, optimum productivity and performance, and good health (Nawalany et al., 2006). Broilers have to be brooded by their arrival to the farms at 33-35°C with latter gradual decrease until achieving a comfortable thermal zone of 18-21°C, a temperature that has to be achieved by the 3rd week and persisted at these levels until the marketing time (Nawalany et al., 2010). A good control has to be achieved over heat transfer between broiler’s body, air, and bedding material, as well as, heat transmission through the house building material to maintain the optimum microclimatic temperature required.
The broiler’s industry in developing countries and for many years was depending on a direct heating system using gas-operated torch and gas burners that directed heat onto broilers to maintain thermal requirements, especially in the first two to three weeks of age. These gas burners contributed to an increase in carbon dioxide concentrations, high moisture percentage of litter, and indirect elevations of ammonia gas concentration inside broiler’s houses (Smith et al., 2016). Meanwhile, heating systems in broilers’ houses of developed countries have been expanded severely in the past twenty years. Nowadays, heating on some farms depends on natural gas pumped into a pipe network. The most prominent disadvantages facing these types of heating systems were the cost and greenhouse gas emission (Ball et al., 2016).
The study aimed to investigate and compare the influence of different heating methods (gas, halogen, oil, and air conditioning heaters) on microclimatic air quality (levels of carbon dioxide and ammonia), litter abiotic conditions (pH and moisture percent), behaviors frequencies and duration, performance indices, intestinal microbiota, isolation and count of some enteric pathogens as E. coli and Salmonella, immunoglobulin concentrations, and level of cortisol in broilers raised on deep litter system.
MATERIAL AND METHODS
Ethical approval
The handling and experimental techniques used in the current study were confirmed by the Scientific Research Ethics Committee, Faculty of Veterinary Medicine, Suez Canal University, Egypt with approval number (2020011).
Experimental birds and housing microclimate
A total of 200 one-day-old female Ross® 308 broilers were purchased from Ismailia-Egypt Company – Sarabium – Ismailia (Figure 1). Broilers were divided into four groups, each group consisted of 50 broiler chicks (five replicates of ten birds), and housed on a hay litter system according to Soliman and Hassan (2020) into four independent rooms (Figure 1). The rooms were bio-secured using several measures as recommended by Soliman and Abdallah, (2020) like strict access, foot dip, controlled entrance to serve feeding and watering, rodent and flies proof nets, strict dry and wet cleaning using clean water followed by water and quaternary ammonium compound then clean water again, and disinfection program using sodium hydroxide 4% followed by formaldehyde spray with 24 hours interval before application of hay on the floors. The floor (Figure 1) of the four rooms was ameliorated using a mix of superphosphate and metabisulfite by a rate of 0.5 and 0.05g/m2, respectively as recommended by Soliman et al. (2018) to maintain high-quality abiotic litter conditions (moisture percent, pH, and microbial growth). Broiler’s rooms were ventilated with V-shaped windows on each side of the wall-ceiling junction to stimulate natural air convection (Stack act) and permit cross-sectional negative ventilation (Figure 1). Walls and floors were insulated to legalize lower heat transmission (U-value) and heat conduction (K-value). Blue LED lights (Figure 1) were provided in each room and set for 18 hours of light and 6 hours of darkness to serve in a continuous lighting regimen as recommended by Soliman and Hassan, (2019). The experiment was designed to last for 38 days. Unspecific and specific mortalities, minimum and maximum indoor and outdoor temperature, and humidity rates were monitored daily for any deviations.
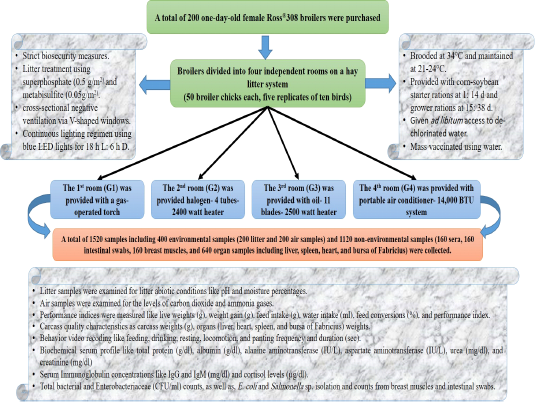
Figure 1: Representative experimental design with broilers receiving, housing system, management, grouping according to treatments, sampling, and measurements.
Broiler’s management
Broilers were received and brooded at 34°C, latter the temperature was adjusted to decline by 3°C weekly until achieving a thermoneutral zone of 21-24°C by the 3rd week (Figure 1). Broilers were provided with corn-soybean ration constituted 23% protein, 3000 Kcal energy/kg ration, 3.7% crude fiber, and 5.20% fat in the starter rations that were provided to the broiler chickens during the first 13-14 days and about 21.5% protein, 3100 Kcal energy/kg ration, 3.50% crude fiber, and 3.92% fat in the grower rations that were provided to the broiler chickens starting from 15 days and ongoing (38 days) to meet the nutritive requirements as recommended by National Research Council; NRC, (1994) and by Applegate and Angel, (2014) modifications (Figure 1). As well as, birds were given ad libitum access to dechlorinated water of high quality without any supplemental treatment to prevent any interference with the outcome of the measured influences. Broiler chickens were deprived of water for 4 hours before mass vaccination takes place using dechlorinated water, the vaccination act was carried out using the live attenuated virus of IB-H120 ≥ 103.5 against infectious bronchitis on the 6th day, live attenuated virus of VMG91 ≥ 103.0 against infectious bursal disease at 14th and 21st days, and live lentogenic ND virus of Lasota ≥ 106.0 against Newcastle disease virus at 18th and 28th days (Figure 1).
Heating systems
Broiler’s rooms were supplied with different heating methods as follow: the 1st room (G1) was provided with a gas-operated torch, the 2nd room (G2) was provided halogen- 4 tubes- 2400 watt heater, the 3rd room (G3) was provided with oil- 11 blades- 2500 watt heater, and the 4th room (G4) was provided with portable air conditioner- 14,000 BTU cooling & heating system (Figure 1).
Performance indices
The live weights (LBW/g) were measured by weighing approximately 44 birds per group weekly. The number of weighed birds was calculated using simple random sampling procedures with an expected error of 5% (Thrusfield, 2005) using the following formula:
n =1.962 Pexp (1 - Pexp) / d2
Where n = required sample size, Pexp = expected prevalence, d = desired absolute precision. Feed intake (FI/g) was calculated concerning the total amount of rations consumed per group to the number of surviving birds in this group. Performance indices were calculated as recommended by Soliman and Hassan, (2017) like weight gains (WG/g) concerning the live weights per group at the beginning and the end of a week, feed conversion ratios (FCR) concerning the feed intakes to weight gain per group, and performance indices (PI) concerning the live weights per kilograms to conversion ratios.
Behaviors video recording and analysis
Broiler’s behavior was video recorded for 12 randomly selected birds from each group in a week after week design for five weeks. A total of 3 hours per day of video recordings were performed in three fixed times (9:00 am, 2:00 pm, and 9:00 pm) by using a high-quality video camera (Panasonic WV Ns202ae) connected to a computer through a digital video recorder (DVR) card (Bergmann et al., 2017). For analyzing the broiler’s behaviors, these videos were replayed in the laboratory for checking the duration (seconds) and the frequency of each behavior. They were classified into feeding, drinking, resting, locomotion, and panting by using a focal sampling technique every five min/hour (12 observations per hour) according to Martin and Bateson, (2007).
Sampling
A total of 1520 samples including 400 environmental samples (200 litter and 200 air samples) and 1120 non-environmental samples (160 sera, 160 intestinal swabs, 160 breast muscles, and 640 organ samples including liver, spleen, heart, and bursa of Fabricius) were collected by the end of the study period.
Litter and air samples were collected weekly (10 samples/room, 10 samples × 4 rooms × 5 weeks), litter samples were collected by receiving a representative handful amount from the depth of the hay litters in different spots that were chosen randomly, while air samples were collected using air canister for passive sampling of air samples that were later passed on 9 ml buffered peptone water (Thermo Scientific™ Oxoid™ Buffered Peptone Water, 500g) in the laboratory for further analysis.
Blood samples (160 sera samples were collected by sacrificing 40 birds per group) were collected via slaughtering, held in a water bath at 37°C for 2 hours, and centrifuged at 3000 rpm for 20 minutes. Clear sera were displaced using automatic pipetting into Eppendorf tubes and stored at -20°C for the biochemical, hormonal, and immunological analysis (Soliman et al., 2017).
Sacrificed birds (160 birds by a rate of 40 birds per each group) were de-feathered, eviscerated, and weighed (CW/g); liver, spleen, heart, and bursa of Fabricius were removed; weighed, and expressed as (g / kg carcass weight) and their ratios to the carcass weight were calculated, as well as, breast muscles (160 samples) were sampled and kept frozen. Swab samples (160 samples) were collected from birds’ intestine (duodenum), added to 9 ml buffered peptone water (Thermo Scientific™ Oxoid™ Buffered Peptone Water, 500g), and stored for bacteriological evaluation. Sacrificed birds were disposed of properly and hygienically after sampling via the burial method using lime.
Litter examination
Litter abiotic conditions were evaluated in a total of 200 samples (10 samples/room, 10 samples × 4 rooms × 5 weeks). pH was measured weekly using Jenway 370 pH meter. Moisture percent was measured by weighing a handful litter samples (W1) using an electronic analytical balance (JJ223BC 0.001 g 220 g), dried in a digital hot air oven (Daihan® LabTech® Hot air Oven, LDO-080N) at 100°C for 36-48 hours, and the dry final weight (W2, two equal successive weights) was subtracted from the initial weight (W1) to detect litter’s moisture.
Air quality examination
Air samples (200 samples were collected by a rate of 10 samples/room, 10 samples × 4 rooms × 5 weeks) were examined for levels of carbon dioxide using barium hydroxide (HiMedia® Barium Hydroxide Octahydrate, Purified, GRM279, 500g) and potentiometric titration against oxalic acid (Eisen-Golden Laboratories® Oxalic Acid, C2H2O4 99.8% ACS Grade Powder, 144-62-7, 1 Lb) in presence of phenolphthalein (ACS® Phenolphthalein pH indicator, 8.5-10, 100g), and levels of ammonia using 0.05M sulfuric acid solution (ReAgent® Sulphuric Acid, H2SO4, 2.5 L) and potentiometric titration against ammonium hydroxide (ReAgent® Ammonium Hydroxide, NH4OH, 2.5 L) in presence of methyl orange (ORANŽ® Methyl Orange Indicator, 100 g) as recommended by American Public Health Association (APHA), (2017). The calculated results were compared to the readings obtained from digital carbon dioxide meter (e Top 77535 Digital 3-in-1 CO2 0- 9999 ppm, Temperature DP WB RH Humidity IAQ Air Quality Meter Tester Monitor Carbon) and ammonia meter (Digital Portable NH3 Meter Ammonia Gas Detector 0: 100 ppm).
Biochemical and hormonal profile
Sera samples (A total of 160 samples collected by a rate of 40 samples per each group of sacrificed birds) were examined for total protein (g/dl), albumin (g/dl), alanine aminotransferase (IU/L), aspartate aminotransferase (IU/L), urea (mg/dl), and creatinine (mg/dl) calorimetrically using Roche Integra 400 Plus chemical analyzer. Immunoglobulin concentrations like IgG and IgM (mg/dl) and cortisol levels (µg/dl) were measured using ROCHE ELECSYS 1010 Immunoassay Analyzer (Wu et al., 2017).
Bacteriological examination
Breast muscle samples (160 samples collected by a rate of 40 samples per each group of sacrificed birds) were thawed and homogenized in a stomacher (Seward™ Stomacher™ Model 400C Circulator Lab Blender), then added into tubes containing 9 ml buffered peptone water (Thermo Scientific™ Oxoid™ Buffered Peptone Water, 500g). Intestinal swabs (160 samples) and breast muscles (160 samples) samples were prepared by running tenfold serial dilutions up to 10-8 (American Public Health Association; APHA, 2012).
Total bacterial count (TBC) onto standard plate count agar (HiMedia® Plate Count HiVeg Agar, MV091A, 500g) and total Enterobacteriaceae count (TEC) onto eosin methylene blue agar (HiMedia® Levine Eosin Methylene Blue Agar, M022, 500g) at 37°C for 24 - 48 hours were performed using drop plate technique (Kim and Lee, 2016). Plates were counted as recommended by Murray et al., (2015) using the Dark-field colony counter (R164109 Reichert-Jung Quebec Darkfield 3325 Colony Counter).
E. coli and Salmonella spp were isolated as recommended by Soliman et al. (2016) via pre-enrichment on buffered peptone water (Thermo Scientific™ Oxoid™ Buffered Peptone Water, 500g) at 37ºC for 8±2 hours, enrichment into MacConkey broth (Thermo Scientific™ Oxoid™ MacConkey Broth, CM0505, 500G) and tetrathionate broth (Tetra Thionate Broth Base, HiMedia® Fluid Tetrathionate Medium w/o Iodine & BG, 500g) at 42ºC for 24±3 hours respectively, and inoculation onto MacConkey agar (Thermo Scientific™ Oxoid™ MacConkey Agar No.3., CM0115, 500g) and CHROMagar plates (CHROMagarTM Salmonella Chromogenic Media Plate) at 37ºC for 24 hours respectively. The counting of the typical pink E. coli and pink Salmonella colonies was conducted using the Dark-field colony counter (R164109 Reichert-Jung Quebec Darkfield 3325 Colony Counter).
Statistical analysis
Statistical analysis was carried out using statistical package for social sciences – SPSS version 24 (Green and Salkind, 2016 and IBM, 2016). The obtained data were analyzed statistically using multifactorial Analysis of Variance (two-tailed ANOVA) to measure the effect of different heating systems (Gas-operated, halogen, oil, and portable air conditioner heaters) concerning broiler’s age and their interactions. The overall means along with the interactions of the heating systems and age were appointed in the tables. The statistical model was summarized as follow:
Yijk=µ + αi + βj + (αβ)ij + Ɛijk
Where Yijk was the measurement of the dependent variables; µ was the overall mean; αi was the fixed effect of the heating systems; βj was the fixed effect of the age; (αβ)ij was the interaction effect of the heating system by age; Ɛijk was the random error. Carcass and sera measurements were analyzed using a one-tailed ANOVA to investigate the influence of the heating systems on these measurements. The overall means were displayed in the tables. The statistical model empathized as follow:
Yij = µ + αj + Ɛij
Where Yij was the measurement of dependent variables; µ was overall mean; αj was the fixed effect of the heating systems, and Ɛij was the random error. The bacterial counts were transferred into a logarithmic number (Log10) using Microsoft Excel 2016. Results were expressed for high significance at (P < 0.01), significant at (P ≤ 0.05), and non-significant at (P > 0.05).
Table 1: Indoor air gases concentration and litter abiotic conditions (mean ± SE) in broilers’ rooms supported with different heating systems.
| Heating system |
Age /weeks |
Indoor air gases | Litter abiotic | |||
|
CO2 ppm |
NH3 ppm |
pH | Moisture % | |||
| The overall means among different heating systems | ||||||
| G1 |
21450a±119.0 |
17.7a±0.37 |
6.83a±0.01 |
37.16a±0.10 |
||
| G2 |
8130b±118.3 |
8.9b±0.29 |
6.21b±0.01 |
32.12b±0.12 |
||
| G3 |
3670c±115.8 |
6.7c±0.43 |
5.82c±0.02 |
29.92c±0.11 |
||
| G4 |
2080d±119.1 |
6.4c±0.35 |
5.74d±0.01 |
28.48d±0.09 |
||
| P-value | 0.001 | 0.000 | 0.000 | 0.000 | ||
| The overall means among different ages per weeks | ||||||
|
1st week |
6237.5e±56.12 |
6.1e±0.04 |
5.62e±0.01 |
29.17e±0.12 |
||
|
2nd week |
7825.0d±78.14 |
7.5d±0.02 |
5.87d±0.02 |
30.72d±0.23 |
||
|
3rd week |
8862.5c±88.24 |
9.5c±0.01 |
6.14c±0.02 |
31.95c±0.09 |
||
|
4th week |
10212.5b±66.95 |
12.3b±0.02 |
6.40b±0.01 |
33.15b±0.11 |
||
|
5th week |
11025.2a±76.13 |
14.4a±0.01 |
6.72a±0.01 |
34.60a±0.13 |
||
| P-value | 0.000 | 0.001 | 0.000 | 0.000 | ||
| Heating systems * age interactions | ||||||
| G1 |
1st wk |
12550e±397.5 |
7.6e±0.71 |
5.74e±0.02 |
31.6e±0.31 |
|
|
2nd wk |
18100d±355.9 |
11.2d±0.53 |
6.14d±0.03 |
35.4d±0.22 |
||
|
3rd wk |
21500c±447.2 |
17.2c±1.46 |
6.79c±0.01 |
38.1c±0.17 |
||
|
4th wk |
26500b±268.7 |
24.0b±0.84 |
7.36b±0.03 |
39.3b±0.39 |
||
|
5th wk |
28600a±286.7 |
28.8a±1.30 |
8.12a±0.04 |
41.4a±0.26 |
||
| G2 |
1st wk |
7100e±385.8 |
6.4e±0.65 |
5.65e±0.02 |
28.7d±0.15 |
|
|
2nd wk |
7650d±516.6 |
7.2d±0.80 |
5.96d±0.03 |
29.8c±0.20 |
||
|
3rd wk |
8100c±145.2 |
8.0c±0.56 |
6.20c±0.02 |
31.8b±0.48 |
||
|
4th wk |
8400b±221.1 |
11.2b±0.80 |
6.44b±0.03 |
34.9a±0.31 |
||
|
5th wk |
9400a±124.7 |
12.0a±0.84 |
6.83a±0.02 |
35.4a±0.16 |
||
| G3 |
1st wk |
3350e±279.3 |
5.2d±0.61 |
5.56d±0.01 |
28.5c±0.16 |
|
|
2nd wk |
3500d±149.0 |
6.0c±0.66 |
5.74c±0.02 |
29.3b±0.15 |
||
|
3rd wk |
3750c±134.3 |
6.4c±0.65 |
5.86b±0.02 |
29.5b±0.16 |
||
|
4th wk |
3850b±150.0 |
7.2b±0.80 |
5.98a±0.02 |
29.8b±0.24 |
||
|
5th wk |
3900a±145.2 |
8.8a±0.80 |
6.00a±0.02 |
32.5a±0.22 |
||
| G4 |
1st wk |
1950d±203.4 |
5.2c±0.61 |
5.56e±0.02 |
27.9a±0.17 |
|
|
2nd wk |
2050c±157.2 |
5.6c±0.65 |
5.66d±0.03 |
28.4a±0.16 |
||
|
3rd wk |
2100b±124.7 |
6.4b±0.88 |
5.74c±0.02 |
28.4a±0.15 |
||
|
4th wk |
2100b±100.0 |
6.8b±0.85 |
5.84b±0.02 |
28.6a±0.22 |
||
|
5th wk |
2150a±133.3 |
8.0a±0.84 |
5.94a±0.02 |
29.1a±0.18 |
||
| P-value | 0.001 | 0.000 | 0.000 | 0.001 | ||
Means carrying different superscripts in the same column are significantly different at (P ≤ 0.05) or highly significantly different at (P < 0.01). Means carrying the same superscripts in the same column are non-significantly different at (P < 0.05).
G1=Broilers reared in the room supported with a gas-operated torch, G2=Broilers reared in the room supported with a halogen heater, G3=Broilers reared in the room supported with an oil heater, G4= Broilers reared in the room supported with a portable air conditioner heater.
CO2=Carbon dioxide, NH3=Ammonia, SE=Standard error.
Table 2: Performance indices (mean ± SE) in broilers reared with different heating systems.
| Heating system | Age/weeks | WG g | FI g | FCR % | PI | WI ml | WI/FI % | |
| The overall means among different heating systems | ||||||||
| G1 |
344.7c±7.51 |
621.0a±2.0 |
1.9a±0.02 |
4.9c±0.1 |
1423.8a±3.2 |
2.30a±0.01 |
||
| G2 |
365.8b±6.23 |
520.7b±1.3 |
1.5b±0.01 |
6.8b±0.3 |
645.6b±2.6 |
1.24b±0.01 |
||
| G3 |
369.1b±2.51 |
509.4c±2.1 |
1.4b±0.03 |
7.1b±0.2 |
621.4bc±1.4 |
1.22bc±0.01 |
||
| G4 |
408.4a±4.22 |
502.3d±0.9 |
1.3b±0.01 |
8.6a±0.1 |
602.7c±1.3 |
1.20c±0.01 |
||
| P-value | 0.000 | 0.001 | 0.000 | 0.000 | 0.001 | 0.000 | ||
| The overall means among different ages per weeks | ||||||||
|
1st week |
68.0±a0.39 |
135.7e±2.2 |
2.0a±0.06 |
0.6d±0.01 |
162.8e±0.36 |
1.2e±0.01 |
||
|
2nd week |
356.0d±0.71 |
309.4d±1.3 |
0.8c±0.03 |
5.6c±0.02 |
464.1d±0.71 |
1.5e±0.00 |
||
|
3rd week |
484.1b±0.99 |
694.6c±2.4 |
1.4b±0.06 |
6.7b±0.00 |
1250.2c±0.14 |
1.8c±0.01 |
||
|
4th week |
541.8a±0.33 |
761.8b±1.9 |
1.4b±0.05 |
10.8a±0.00 |
1675.9b±0.62 |
2.2b±0.00 |
||
|
5th week |
410.0c±1.22 |
790.2a±3.1 |
2.1a±0.01 |
10.4a±0.01 |
1975.5a±0.66 |
2.5a±0.01 |
||
| P-value | 0.000 | 0.001 | 0.014 | 0.000 | 0.000 | 0.000 | ||
| Heating systems * age interactions | ||||||||
| G1 |
1st wk |
58.0e±1.3 |
148.4e±2.1 |
2.5b±0.06 |
0.4e±0.01 |
49.7e±5.2 |
0.33b±0.03 |
|
|
2nd wk |
271.1d±9.4 |
322.8d±5.8 |
1.2c±0.04 |
3.2d±0.21 |
90.7d±5.8 |
0.28c±0.01 |
||
|
3rd wk |
498.0b±24.7 |
753.8c±8.4 |
1.5c±0.07 |
5.8c±0.44 |
164.3c±15.1 |
0.21d±0.02 |
||
|
4th wk |
552.6a±24.3 |
891.5b±2.4 |
1.6c±0.08 |
8.9a±0.42 |
239.7b±7.9 |
0.27c±0.00 |
||
|
5th wk |
344.1c±15.3 |
988.8a±5.3 |
2.9a±0.14 |
6.2b±0.29 |
393.5a±16.4 |
0.39a±0.01 |
||
| G2 |
1st wk |
69.9d±2.41 |
131.6e±1.7 |
1.9a±0.07 |
0.6c±0.04 |
42.8e±5.4 |
0.32a±0.04 |
|
|
2nd wk |
382.1c±6.4 |
306.3d±5.7 |
0.8c±0.01 |
6.3b±0.21 |
55.3d±4.1 |
0.18b±0.01 |
||
|
3rd wk |
469.7b±10.2 |
679.0c±4.6 |
1.4b±0.03 |
6.7b±0.19 |
92.9c±2.7 |
0.13c±0.01 |
||
|
4th wk |
519.9a±13.7 |
757.2a±4.6 |
1.4b±0.04 |
10.3a±0.34 |
164.8b±2.8 |
0.21b±0.00 |
||
|
5th wk |
387.5c±19.0 |
729.4b±6.5 |
1.9a±0.07 |
10.0a±0.54 |
249.9a±9.4 |
0.34a±0.01 |
||
| G3 |
1st wk |
69.5e±1.85 |
134.5e±0.9 |
1.9a±0.05 |
0.6c±0.02 |
36.1d±5.3 |
0.26b±0.04 |
|
|
2nd wk |
381.0d±6.2 |
307.9d±6.1 |
0.8c±0.1 |
6.2b±0.14 |
47.3d±4.1 |
0.15d±0.01 |
||
|
3rd wk |
477.9b±11.5 |
675.5c±4.3 |
1.4b±0.03 |
6.9b±0.22 |
84.2c±2.5 |
0.12d±0.00 |
||
|
4th wk |
510.3a±8.7 |
703.3b±4.3 |
1.3b±0.02 |
10.8a±0.23 |
156.8b±2.9 |
0.22c±0.00 |
||
|
5th wk |
406.7c±13.5 |
726.1a±2.1 |
1.8a±0.05 |
10.6a±0.39 |
241.8a±9.2 |
0.33a±0.01 |
||
| G4 |
1st wk |
74.7d±1.35 |
128.3e±0.9 |
1.7a±0.03 |
0.7d±0.02 |
30.3d±5.5 |
0.24b±0.04 |
|
|
2nd wk |
390.1c±4.9 |
300.9d±6.0 |
0.7c±0.01 |
6.7c±0.13 |
41.1d±4.1 |
0.13c±0.01 |
||
|
3rd wk |
491.1b±6.0 |
670.1c±4.4 |
1.3b±0.01 |
7.4c±0.12 |
78.0c±2.6 |
0.11c±0.01 |
||
|
4th wk |
584.6a±14.8 |
695.5b±4.1 |
1.1b±0.03 |
13.4b±0.46 |
149.0b±3.1 |
0.21b±0.01 |
||
|
5th wk |
501.9b±51.8 |
716.8a±2.0 |
1.8a±0.5 |
15.0a±1.70 |
237.1a±9.5 |
0.33a±0.01 |
||
| P-value | 0.002 | 0.001 | 0.014 | 0.001 | 0.000 | 0.517 | ||
Means carrying different superscripts in the same column are significantly different at (P ≤ 0.05) or highly significantly different at (P < 0.01). Means carrying the same superscripts in the same column are non-significantly different at (P < 0.05).
G1=Broilers reared in the room supported with a gas-operated torch, G2=Broilers reared in the room supported with a halogen heater, G3=Broilers reared in the room supported with an oil heater, G4= Broilers reared in the room supported with a portable air conditioner heater.
WG=Weight Gain, FI=Feed Intake, FCR=Feed Conversion Ratio, and PI=Performance Index, WI=Water intake, WI/FI=Water to feed intake ratio, SE=Standard error.
RESULTS
Microclimatic air quality
Carbon dioxide concentration overall means, as shown in Table 1, revealed highly significant declines (P < 0.01) in the portable air conditioner, oil, halogen, and gas-operated system, respectively. Ammonia concentration overall means revealed highly significant declines (P < 0.01) in the portable air conditioner, oil, and halogen compared to the gas-operated heating system with no significant differences between the portable air conditioner and oil systems. The overall means among broilers age revealed highly significant increases (P < 0.01) of carbon dioxide and ammonia gases as birds precede in age.
Litter abiotic conditions
pH and moisture percentages overall means in Table 1 revealed highly significant declines (P < 0.01) in the portable air conditioner, oil, halogen, and gas-operated heating system, respectively, and synchronized highly significant increases (P < 0.01) as broiler’s age precede. pH interactions between different heating systems and broilers age revealed highly significant increases (P < 0.01) as age precedes in all groups with no significant differences of pH values in the 4th and 5th weeks in the oil heating system.
Performance indices
The heating systems’ overall means (Table 2) revealed highly significant increases (P < 0.01) of weight gains and performance indices in the portable air conditioner, oil, halogen, and gas-operated systems, respectively with no significant differences between the halogen and oil heating systems. Feed intakes in Table 2 revealed highly significant increases (P < 0.01) in the gas-operated, halogen, oil, and portable air conditioner systems, respectively. Feed conversion ratios (Table 2) revealed highly significant increases (P < 0.01) in the gas-operated compared to other heating systems with no significant differences between the halogen, oil, and portable air conditioner system. Water intakes in Table 2 revealed highly significant increases (P < 0.01) in the gas-operated, halogen, oil, and portable air conditioner systems, respectively with no significant differences between the halogen and oil systems and between the oil and portable air conditioner systems.
The broiler’s age overall means in Table 2 revealed highly significant increases (P < 0.01) in weight gain at the 4th, 3rd, 5th, 2nd, and 1st weeks, respectively. Feed and water intake revealed highly significant increases (P < 0.01) at the 5th, 4th, 3rd, 2nd, and 1st weeks, respectively. Feed conversion ratios revealed highly significant increases (P < 0.01) at the 5th, 1st, 3rd, 4th, and 2nd weeks, respectively with no significant differences between the 3rd and 4th weeks (Table 2). Performance indices revealed highly significant increases (P < 0.01) at the 4th, 5th, 3rd, 2nd, and 1st weeks with no significant differences between the 4th and 5th weeks (Table 2).
Behavioral observations
Broiler’s behavior overall means were presented in Table 3. Data showed that there were highly significant differences (P < 0.01) in broiler behavior among different heating systems. As, the highest duration and frequency of feeding, drinking, and resting were recorded among birds kept raised in rooms with the oil heater followed by portable air conditioner with no significant differences between both systems except for feeding duration and frequency. While the lowest duration and frequency were recorded among birds raised in rooms with a gas-operated system followed by halogen with no significant differences between both systems. There were highly significant increases (P < 0.01) in the duration and frequency of ingestive and resting behaviors as birds grow in age from the 1st to 5th week, respectively. As, feeding, drinking and resting behaviors interactions between different heating systems and broilers age showed highly significant increases (P < 0.01) as age precedes in all groups with no significant differences at the 4th and 5th weeks in the portable air conditioner and gas-operated systems feeding behavior, and in oil and potable air conditioner drinking behavior.
There were symmetrical highly significant decreases (P < 0.01) in locomotion and panting behaviors among bird groups raised under the influence of the different heating systems. As, the highest duration and frequency of locomotion and panting was recorded in broilers raised in the room supplied with the gas-operated system compared to the portable air conditioner, oil, and halogen with no significant difference between the halogen and oil heating systems except for panting frequency. There were highly significant gradual increases (P < 0.01) in locomotion and panting behaviors among bird groups of older ages.
Live body and carcass weights and organs ratios
Live body (Figure 2A) and carcass weight (Figure 2B) overall means revealed highly significant increases (P < 0.01) in the portable air conditioner (2157 and 2003g), oil (1960 and 1710g), halogen (1897 and 1647g), and gas-operated systems (1711 and 1415g), respectively. The liver ratios (Figure 2C) revealed highly significant increases (P < 0.01) in the portable air conditioner (3.3%), oil (3.2%), halogen (2.3%), and gas-operated systems (2.2%), respectively with no significant differences between the portable air conditioner and oil systems and between halogen and gas-operated systems. The heart ratios (Figure 2C) revealed highly significant increases (P < 0.01) in the portable air conditioner (1.46%), oil (1.28%), halogen (0.95%), and gas-operated systems (0.74%), respectively.
Spleen weight ratios (Figure 2D) revealed highly significant increases (P < 0.01) in the portable air conditioner (0.09%), oil (0.09%), halogen (0.08%), and gas-operated systems (0.06%), respectively with no significant differences between the portable air conditioner and oil systems. Bursa of Fabricius weight ratios (Figure 2D) overall means showed highly significant increases (P < 0.01) in the oil (0.067%), portable air conditioner (0.063%), halogen (0.063%), and gas-operated systems (0.061%), respectively
Table 3: Behavioral patterns durations and frequency (mean ± SE) in broilers reared with different heating systems.
| Heating systems | Age/weeks | Feeding | Drinking | Resting | Locomotion | Panting | |||||
| D | F | D | F | D | F | D | F | D | F | ||
| The overall means among different heating systems | |||||||||||
| G1 |
50c ±3.2 |
1.7c±0.1 |
14.8b±1.1 |
1.5b±0.1 |
125b±7.0 |
2.5b±0.1 |
35.3a±3.6 |
1.8a±0.2 |
16.4a±2.9 |
1.1a ±0.2 |
|
| G2 |
49c ±3.6 |
1.6c±0.1 |
15.7b±1.0 |
1.6b±0.1 |
141.7b±6.7 |
2.8b±0.1 |
23.7b±2.7 |
1.2b±0.1 |
9.8b±2.0 |
0.7b ±0.1 |
|
| G3 |
81a ±3.7 |
2.7a±0.1 |
21.3a±1.8 |
2.1a±0.2 |
187.5a±7.5 |
3.8a±0.1 |
8.3c±1.5 |
0.4c±0.1 |
1.8c±0.6 |
0.2d ±0.1 |
|
| G4 |
63b ±3.4 |
2.1b±0.1 |
21.0a±1.7 |
2.1a±0.2 |
179.2a±7.2 |
3.6a±0.1 |
10.3c±1.9 |
0.5c±0.1 |
4.0c±0.9 |
0.4c ±0.1 |
|
| P value | 0.000 | 0.000 | 0.000 | 0.000 | 0.000 | 0.000 | 0.000 | 0.000 | 0.000 | 0.000 | |
| The overall means among different ages per weeks | |||||||||||
|
1st week |
49c ±5.1 |
1.7c±0.2 |
10d±1.1 |
1d±0.1 |
146.9bc±8.1 |
2.9bc±0.2 |
4.2c±1.5 |
0.2c±0.1 |
0.0d±0.0 |
0.0c ±0.0 |
|
|
2nd week |
53c ±3.7 |
1.8c±0.1 |
14.6c±1.2 |
1.5c±0.1 |
176.0a±7.1 |
3.5a±0.1 |
11.3b±2.5 |
0.6b±0.1 |
1.0d±0.5 |
0.1c ±0.1 |
|
|
3rd week |
60bc ±3.7 |
2bc±0.1 |
19.4b±1.7 |
1.9b±0.2 |
159.4ab±9.1 |
3.2ab±0.2 |
24.6a±3.7 |
1.2a±0.2 |
4.8c±1.0 |
0.5b ±0.1 |
|
|
4th week |
65ab ±4.2 |
2.2ab±0.1 |
23.1ab±1.3 |
2.3ab±0.1 |
136.5c±6.8 |
2.7c±0.1 |
29.6a±3.5 |
1.5a±0.2 |
8.3b±1.5 |
0.7b ±0.1 |
|
|
5th week |
75a ±3.9 |
2.5a±0.1 |
23.9a±2.0 |
2.4a±0.2 |
172.9a±8.8 |
3.5a±0.2 |
27.5a±3.1 |
1.4a±0.2 |
25.9a±3.4 |
1.7a ±0.2 |
|
| P value | 0.000 | 0.000 | 0.000 | 0.000 | 0.000 | 0.000 | 0.000 | 0.000 | 0.000 | 0.000 | |
|
Heating systems * age interactions |
|||||||||||
| G1 |
1st wk |
22.5d ±6.5 |
0.8d±0.2 |
9.2c±2.3 |
0.9c±0.2 |
133.3c±20.7 |
2.7b±0.4 |
5.0e±2.6 |
0.3d±0.1 |
0.0e±0.0 |
0.0e ±0.0 |
|
2nd wk |
45.0c ±4.5 |
1.5c±0.2 |
15.0b±2.3 |
1.5b±0.2 |
166.7a±9.4 |
3.3a±0.2 |
16.7d±5.4 |
0.8d±0.3 |
3.3d±1.9 |
0.3d ±0.2 |
|
|
3rd wk |
52.5b ±3.9 |
1.8b±0.1 |
15.8b±2.9 |
1.6b±0.3 |
91.7d±10.4 |
1.8c±0.2 |
45.0c±7.0 |
2.3c±0.4 |
6.7c±2.2 |
0.7c ±0.2 |
|
|
4th wk |
62.5a ±8.6 |
2.1a±0.3 |
15.8b±1.9 |
1.6b±0.2 |
83.3d±11.2 |
1.7c±0.2 |
58.3a±6.3 |
2.9a±0.3 |
17.5b±4.5 |
1.3b ±0.2 |
|
|
5th wk |
65.0a ±3.4 |
2.2a±0.1 |
18.3a±2.4 |
1.8a±0.2 |
150.0b±8.7 |
3.0a±0.2 |
51.7b±5.8 |
2.6b±0.3 |
54.3a±4.8 |
3.1a ±0.3 |
|
| G2 |
1st wk |
35.0d ±6.2 |
1.2d±0.2 |
10.0d±2.1 |
1.0c±0.2 |
145.8b±19.7 |
2.9b±0.4 |
3.3d±2.2 |
0.2c±0.1 |
0.0c±0.0 |
0.0d ±0.0 |
|
2nd wk |
42.5c ±9.4 |
1.4c±0.3 |
13.3c±2.2 |
1.3c±0.2 |
175.0a±13.1 |
3.5a±0.3 |
11.7c±5.2 |
0.6c±0.3 |
0.8c±0.8 |
0.1d ±0.1 |
|
|
3rd wk |
45.0c ±7.8 |
1.5c±0.3 |
19.2a±2.6 |
1.9a±0.3 |
116.7d±12.8 |
2.3d±0.3 |
38.3a±6.3 |
1.9a±0.3 |
7.5b±2.8 |
0.8b ±0.2 |
|
|
4th wk |
52.5b ±6.5 |
1.8b±0.2 |
17.5b±1.3 |
1.8b±0.1 |
129.2c±7.4 |
2.6c±0.1 |
33.3b±4.5 |
1.7b±0.2 |
6.7b±1.9 |
0.6c ±0.2 |
|
|
5th wk |
70.0a ±7.7 |
2.3a±0.3 |
18.3a±2.4 |
1.8b±0.2 |
141.7b±16.1 |
2.8b±0.3 |
31.7b±3.9 |
1.6b±0.2 |
34.2a±5.0 |
2.2a ±0.2 |
|
| G3 |
1st wk |
70.0e ±5.6 |
2.3e±0.2 |
10.8d±2.3 |
1.1c±0.2 |
150.0e±10.7 |
3.0c±0.2 |
1.7d±1.7 |
0.1c±0.1 |
0.0d±0.0 |
0.0d ±0.0 |
|
2nd wk |
77.5d ±7.8 |
2.6d±0.3 |
14.2c±2.6 |
1.4c±0.3 |
204.2b±16.8 |
4.1a±0.3 |
5.0c±3.6 |
0.3b±0.2 |
0.0d±0.0 |
0.0d ±0.0 |
|
|
3rd wk |
80.0c ±11.3 |
2.7c±0.4 |
21.6b±4.2 |
2.2b±0.4 |
220.8a±18.9 |
4.4a±0.4 |
8.3b±4.6 |
0.4b±0.2 |
1.6c±1.1 |
0.2c ±0.1 |
|
|
4th wk |
85.0b ±9.7 |
2.8b±0.3 |
30.8a±2.3 |
3.1a±0.2 |
170.8d±9.6 |
3.4b±0.2 |
13.3a±2.8 |
0.7a±0. |
4.2a±1.9 |
0.4a ±0.2 |
|
|
5th wk |
92.5a ±5.8 |
3.1a±0.2 |
29.2a±4.7 |
2.9a±0.5 |
191.7c±19.3 |
3.8b±0.4 |
13.3a±2.8 |
0.7a±0.1 |
3.3b±1.4 |
0.3b ±0.1 |
|
| G4 |
1st wk |
45.0d ±7.8 |
1.5d±0.2 |
10.0e±2.1 |
1.0d±0.2 |
158.3c±12.0 |
3.2b±0.2 |
6.7c±4.5 |
0.3c±0.2 |
0.0d±0.0 |
0.0d ±0.0 |
|
2nd wk |
55.0c ±5.0 |
1.8c±0.3 |
15.8d±2.6 |
1.6c±0.3 |
158.3c±14.9 |
3.2b±0.3 |
11.7b±5.8 |
0.6b±0.3 |
0.0d±0.0 |
0.0d ±0.0 |
|
|
3rd wk |
62.5b ±7.8 |
2.1b±0.3 |
20.8c±3.6 |
2.1b±0.4 |
208.3a±18.3 |
4.2a±0.4 |
6.7c±3.8 |
0.3c±0.2 |
3.3c±1.4 |
0.3c ±0.1 |
|
|
4th wk |
75.0a ±7.8 |
2.5a±0.2 |
28.3b±2.1 |
2.8a±0.2 |
162.5b±9.0 |
3.3b±0.2 |
13.3a±3.8 |
0.7a±0.2 |
5.0b±1.5 |
0.6b ±0.2 |
|
|
5th wk |
75.0a ±6.9 |
2.5a±0.3 |
30.0a±4.8 |
3.0a±0.5 |
208.3a±183 |
4.2a±0.4 |
13.3a±3.8 |
0.7a±0.2 |
11.7a±2.7 |
1.2a ±0.3 |
|
| P-value | 0.037 | 0.037 | 0.019 | 0.019 | 0.000 | 0.000 | 0.000 | 0.000 | 0.000 | 0.000 | |
Means carrying different superscripts in the same column are significantly different at (P ≤ 0.05) or highly significantly different at (P < 0.01). Means carrying the same superscripts in the same column are non-significantly different at (P < 0.05).
G1=Broilers reared in the room supported with a gas-operated torch, G2=Broilers reared in the room supported with a halogen heater, G3=Broilers reared in the room supported with an oil heater, G4= Broilers reared in the room supported with a portable air conditioner heater.
D=Duration (sec.), F=Frequency, SE=Standard error.
with no significant differences between the oil, portable air conditioner, and halogen systems and between portable air conditioner, halogen, and the gas-operated heating systems.
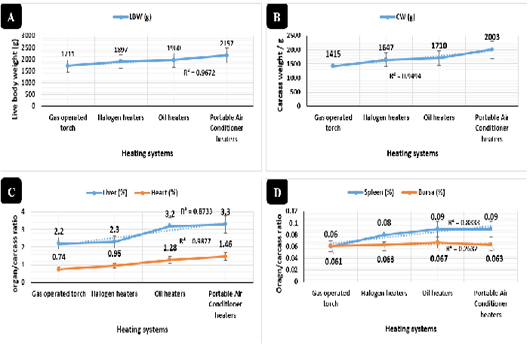
Figure 2: Live and carcass weights and immune organs’ ratio in broilers reared in different heating systems. Live marketing body weight (g) in broilers reared in different heating systems. Carcass weight (g) in broilers reared in different heating systems. Liver and heart to carcass ratio (%) in broilers reared in different heating systems. D) Bursa and Spleen to carcass ratio (%) in broilers reared in different heating systems.
Biochemical parameters
Broilers reared in the room supported with a portable air conditioner system revealed (Figure 3A) highly significant increases (P < 0.01) of total protein (9.1 g/dl) and albumin (5.9 g/dl) compared to other heating systems. Alanine aminotransferase (Figure 3B), aspartate aminotransferase (Figure 3B), urea (Figure 3C), and creatinine (Figure 3D) revealed highly significant declines (P < 0.01) in the portable air conditioner (3.1 IU/L, 8.8 IU/L, 10.5 mg/dl, 0.21 mg/dl), oil (3.6 IU/L, 9.8 IU/L, 12.2 mg/dl, 0.32 mg/dl), halogen (5.1 IU/L, 11.8 IU/L, 13.3 mg/dl, 0.64 mg/dl), and gas-operated heating systems (10.1 IU/L, 19.7 IU/L, 43.8 mg/dl, 1.49 mg/dl), respectively.
Stress marker and Immunoglobulin concentrations
Cortisol levels indicated in Figure 4A, highly significant declines (P < 0.01) in sera samples collected from broilers raised in the portable air conditioner (3.36 ug/dl), oil (3.43 ug/dl), and halogen (3.53 ug/dl) systems respectively with no significant differences between the three systems compared to the gas-operated system (13.86 ug/dl).
Immunoglobulin IgG and IgM concentrations in Figure 4B revealed synchronized highly significant increases (P < 0.01) in the portable air conditioner (1981 and 500 mg/dl), oil (1915 and 475 mg/dl), halogen (1666 and 363 mg/dl), and gas-operated (1333 and 286 mg/dl) heating systems respectively.
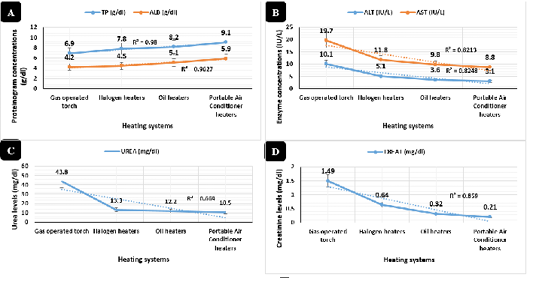
Figure 3: Biochemical profile in broilers reared in different heating systems. Proteinogram serum concentrations (g/dl) in broilers reared in different heating systems. Liver and muscle enzymes concentrations (IU/L) in broilers reared in different heating systems. Urea serum concentrations (mg/dl). Creatinine serum concentrations (mg/dl)
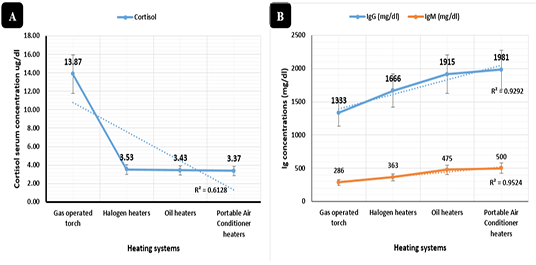
Figure 4: Sera stress marker (µg/dl) and immunoglobulin concentrations (mg/dl). Cortisol serum concentrations (µg/dl) in broilers reared in different heating systems. B) Immunoglobulin (IgG and IgM) serum concentrations (mg/dl) in broilers reared in different heating systems.
Bacterial counts and isolation
The total bacterial counts of intestinal swabs (Figure 5A) and breast muscles (Figure 5B) and total Enterobacteriaceae counts of intestinal swabs (Figure 5A) revealed synchronized highly significant declines (P < 0.01) in the portable air conditioner (3.71, 1.86, and 2.39 CFU/ml), oil (3.87, 2.10, and 2.353 CFU/ml), halogen (4.06, 2.92, and 2.75 CFU/ml), and gas-operated (4.91, 3.54, and 3.13 CFU/ml) heating systems respectively. While, total Enterobacteriaceae counts of breast muscles (Figure 5B) revealed highly significant declines (P < 0.01) in the oil (0.72 CFU/ml), portable air conditioner (0.92 CFU/ml), halogen (1.41 CFU/ml), and gas-operated (2.31 CFU/ml) heating systems respectively with no significant differences between the oil and portable air conditioner heating systems.
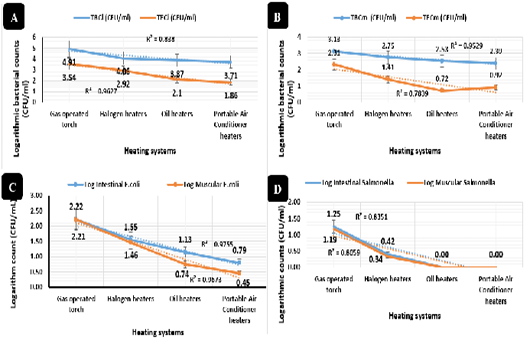
Figure 5: Bacterial counts and isolation (CFU/mL). Total bacterial counts of intestinal swabs (TBCi) expressed by CFU/ml, Total Enterobacteriaceae counts of intestinal swabs (TECi) expressed by CFU/ml.Total bacterial count of breast muscles (TBCm) expressed by CFU/ml and Total Enterobacteriaceae counts of breast muscles (TECm) expressed by CFU/ml. E. coli isolation and counts (CFU/ml) from intestinal swabs and breast muscles of broilers reared in different heating systems. Salmonella isolation and counts (CFU/ml) from intestinal swabs and breast muscles of broilers reared in different heating systems.
E. coli isolation and counts revealed, as shown in Figure 5C, the lowest prevalence (P < 0.01) in from intestinal swabs (0.79 and 1.13 CFU/ml) and breast muscles (0.44 and 0.74 CFU/ml) of broilers reared with the portable air conditioner and oil systems respectively, and the highest prevalence (P < 0.01) was recorded in intestinal swabs (2.22 and 1.55 CFU/ml) and breast muscles (2.21 and 1.45 CFU/ml) of broilers reared with the gas-operated and halogen system respectively with no significant differences between the two groups. Salmonella isolation and counts revealed in Figure 5D, the lowest prevalence (P < 0.01) in intestinal swabs (0.01 and 0.00 CFU/ml) and breast muscles (0.00 and 0.00 CFU/ml) collected from the portable air conditioner and oil heating systems with no significant differences between the two groups, while the highest prevalence was recorded (P < 0.01) in intestinal swabs (1.25 and 0.41 CFU/ml) and breast muscles (1.19 and 0.33 CFU/ml) of broilers raised in the gas-operated and halogen heating systems.
DISCUSSION
Maintaining thermal balance is a must in broiler farms via controlling heat sources and ventilation rates. Biosecurity measures in broiler farm are concerned with the building location, direction, design (Gussem et al., 2013), interior arrangement (Biosecurity Act, 2015), and proper insulation to maintain minimum K (thermal conduction) and U (thermal transmission) values, thus heat flow to the surrounding was brought to a minimum level contributing an optimum microclimatic temperature and encourage a higher rate of the stack effect (Aengwanich et al., 2014; Soliman and Abdallah, 2020).
The current study compared the influence of different heating systems like direct means as a gas-operated torch and indirect means as halogen, oil, and air conditioner heaters. Applying a gas-operated torch in the current study revealed significant increases in the microclimatic carbon dioxide concentrations that adversely affect performance, behavior, carcass yield, immunoglobulin concentration, and bacterial counts and prevalence. The results were consistent with those reported by Weis and Leip, (2012) and Cândido et al. (2018) who found that using direct heating methods contributed to a significant increase in carbon dioxide concentration and moisture percentages that negatively influence the performance and behavior of broilers. Also, Rajaniemi and Ahokas, (2015) estimated approximately 0: 631 kg CO2.1000-1 of carcass weight emitted in broiler farms from direct heating using fossil fuel.
Gas-operated torch contributed an alteration in the microclimatic conditions, especially moisture percentages that react with the broiler’s excreta resulting in extreme elevations of ammonia gas concentrations in the house microclimate, which adversely influences the broiler’s performance and behavior. These results were correspondent with those of David et al. (2015) who stated that ammonia is a pungent gas, and the behavioral studies indicated chickens are averse to the gas. Besides, Xing et al. (2016) and Soliman et al. (2017) recorded an elevation in microclimatic levels of ammonia upon alteration in environmental conditions including seasonal variation and heating methods, and this rise in ammonia levels impacted negatively on broiler’s performance, bacterial loads, antioxidant activity, and immunoglobulin concentrations. Li et al. (2014) recorded a negative influence from higher microclimatic ammonia on performance and immunity in harmony with the current recorded results. Liu et al. (2015) demonstrated poor production potentials in broilers exposed to high ammonia concentration as a result of poor housing practice.
The recorded alterations in microclimatic conditions (carbon dioxide, ammonia, and litter abiotic) from using a gas-operated torch during the current experiment in broiler’s rooms presented a stress factor and resulted in higher levels of cortisol, thus lowers broiler’s resistance and subsequently immunoglobulin concentrations. The lower resistance levels contributed to higher bacterial counts and prevalence of E. coli and Salmonella in this group. These results were supported by those recorded by Alpigiani et al. (2017) who stated that poor microclimatic conditions in broiler’s houses contributed a higher litter humidity that acts as good media for enhancing the growth and multiplication of many pathogenic microorganisms as Salmonella and Campylobacter. Oakley et al. (2018) also reported that alternations in macro and microclimatic conditions contributed to a stress factor and enhance pathogenic intestinal microorganisms and negatively influence performance.
Achieving optimal thermal conditions in broilers’ houses is a determinant for obtaining good health and welfare. Heat requirements during the initial four weeks of life enforce the use of external heat sources (Lynch et al., 2013). Cordeiro et al. (2011) demonstrated the necessity of using external heat sources during the initial stage of the broiler’s life for the presence of ill-developed thermoregulatory capabilities.
Indirect heating methods used in the current experiment with especial reference to oil and air conditioner heaters were able to maintain good air quality, higher broiler’s performance, better behavioral activities, improve carcass yield, increase immunoglobulin concentrations, and minimize bacterial counts and prevalence of E. coli and Salmonella. These clean sources of heat and energy despite their high cost were able to maintain good air quality and reduce the mortalities during the early stage of the broiler’s life. The results were synchronized with those of Jones et al. (2005) and Han et al. (2016) who recorded a higher broiler’s performance associated with good welfare conditions, optimum thermal requirements, and proportional low intestinal microbial communities. Mancabelli et al. (2016) reported in agreement with the current results, the role of negative microclimatic conditions on the evolution of pathogenic microorganisms from the intestinal microbiome.
Indirect heating methods in the current study were able to maintain optimum litter abiotic and consequently improved the broiler’s welfare and performance. A sharp control of microclimatic conditions including temperature and relative humidity was suggested by BenSassi et al. (2016) to prevent any deviations in welfare circumstances in broiler’s farms. Also, BenSassi et al. (2019) quantified litter abiotic and farm microclimate potential impact on broiler’s welfare. They found consistent with the current results that early adjustment of welfare conditions for broilers improved broiler’s performance and carcass qualities. De Jong et al. (2014) evaluated and scored litter abiotic during the early stage of life (three weeks) to give an indication of heating procedures in the farm, welfare level, performance, and carcass quality. De Jong et al. (2015) were able to use the welfare quality (WQ) poultry assessment protocol to observe the initial welfare issues in poultry farms.
The new directions in the poultry industry are to conserve heat and use clean energy sources as reported by Kivinen et al. (2013) who stated that energy could be saved in broiler’s farms through higher levels of control on ventilation. Since the basic management key in poultry production is to maintain litter quality, which in turn provides dry good bedding with lowered problems, thus dryer environment is required to achieve lower litter, humidity, and ammonia problems inside the poultry farm, as well as, conserving energy sources.
CONCLUSION
Maintaining a thermoneutral zone inside the broiler chicken farms is a must for obtaining proper performance and productivity. Indirect heating methodology in broilers’ farms is preferred even though of their high cost over the direct methods. Application of indirect heating methods contributed to dry litter (moisture and pH) in a dry environment with optimum thermal conditions (good levels of carbon dioxide and ammonia), thus maintain welfare levels demanded by broilers. Indirect heating methods were able to improve the broiler’s performance, behavior, carcass yield, immunoglobulin concentration, biochemical profile, and reduce bacterial count and prevalence.
ACKNOWLEDGMENTS
Sincere thanking should be provided to Prof. M.A.A. Sobieh for his tremendous directions during the experiment. Also, we would like to express our sincere thanking to the community services and environmental development sector staff, Faculty of Veterinary Medicine, Suez Canal University, Ismailia, Egypt for their help.
COnflict of interest
The authors declare that they have no competing interests.
AUTHORS’ CONTRIBUTION
ESS designed the experimental design, participated in the execution of the experiment, and writing of the manuscript. AAA participated in the execution of the experiment, and writing of the manuscript. REMG participated in the execution of the experiment, and writing of the manuscript.
REFERENCES
the evaluation of thermal conditions in the broiler living zone.
Archiv fur Geflugelkunde. 76(1): 49- 54.

