
Advances in Animal and Veterinary Sciences


Research Article

The Effect of Ivermectin Injection on Some Clinicopathological Parameters in Camels Naturally Infested with Scabies
Asmaa Abdallah Darwish1, Mohamed Fahmy Eldakroury2*
1Department of Animal and Poultry Health, Desert Research Center, Cairo, Egypt; 2Department of Pharmacology, Faculty of Veterinary Medicine, Matrouh University, Egypt.
Abstract | Camel mange is a real threat on camel breeding development. This paper aimed to investigate the hematological and biochemical changes in she-camels naturally infested with sarcoptic mange before and after treatment with ivermectin during 28 days and suggest new markers for its diagnosis and treatment monitoring. A total 20 she-camels were used for this purpose; 10 she-camels were apparently-healthy (control group (CG)) and the others (N=10) were naturally infested with sarcoptic mange, confirmed by the mange symptoms and skin scraping microscopic examination (diseased group (DG)). DG was treated with ivermectin 1% S/C (1ml/50 kg) + permethrine 5% topically (treated group (TG)). Blood samples were collected from CG, DG (before treatment) and from TG at 7th, 14th, 21st, 28th days post-treatment. Hematological and biochemical parameters were estimated and statistically analyzed. Ivermectin administration succeeded in restoring normal hemogram, leukogram, glucose levels and lipid profile at 14th day and total globulin, matrix metalloproteinases (MMPs), iron profile at 21st post-treatment. On the other hand, it resulted in a significant elevation (P˂ 0.05) in liver and kidney function tests and a significant (P˂ 0.05) decline in total antioxidant capacity (TAC) in TG at 7th day, but at 28th day AST, direct bilirubin and creatinine returned to normality and a slight increase in ALT, total and indirect bilirubin and urea concentrations was expressed till the study end. Serum iron (SI), ferritin, TAC, MMP-2 and MMP-9 achieved moderate to high values of area under the curve, cut off points, sensitivity%, specificity%, likelihood ratio, PPV%, NPV% and accuracy rate% in DG and TG. Conclusion: ivermectin administration in camel with scabies, has several adverse effects on liver and kidney functions tests due to oxidative stress. SI, ferritin, TAC, MMP-2 and MMP-9 may be useful indicator for camel mange and for tracking the infested animal response to the treatment proposal.
Keywords | Camel mange, Clincopathological parameters, Ivermectin, Iron profile, Matrix metalloproteinases
Received | July 18, 2020; Accepted | September 08, 2020; Published | September 20, 2020
*Correspondence | Mohamed Fahmy Eldakroury, Department of Pharmacology, Faculty of Veterinary Medicine, Matrouh University, Egypt; Email: Mohamed_542000@yahoo.com
Citation | Darwish AA, Eldakroury MF (2020). The effect of ivermectin injection on some clinicopathological parameters in camels naturally infested with scabies. Adv. Anim. Vet. Sci. 8(s2): 34-40.
DOI | http://dx.doi.org/10.17582/journal.aavs/2020/8.s2.34.40
ISSN (Online) | 2307-8316; ISSN (Print) | 2309-3331
Copyright © 2020 Darwish and Eldakroury. This is an open access article distributed under the Creative Commons Attribution License, which permits unrestricted use, distribution, and reproduction in any medium, provided the original work is properly cited.
INTRODUCTION
Mange is a serious problem, negatively affects the economic yield of all animal breeding sections including camel breeding. Although, it is not lethal but the lowered body weights, damaged skin, decreased fertility rates and milk production usually detected in infested camels are economic losses can`t be ignored. In addition, the high morbidity and re-infestation rates and subsequent expensive exhausted protocols used for the disease treatment and control. Furthermore, camel mange has a zoonotic importance (Zahid, 2015; Jarso et al., 2018; Abdel-Saeed, 2020).
Mange is one of the most important parasitic diseases of camels, characterized by scab formation, pruritic dermatitis, thickening and corrugation of skin and hair loss. It caused due to infestation with sarcoptic or chorioptic mange mites, but sarcoptic mange is the most common one in camel. Ivermectin is macrocyclic lactone which is used against many endo and ectoparasits. Injectable, Pour-on and oral formulations of ivermectin are available. For years ivermectin was used for mange treatment and control in camels as well as other animals without sufficient information about its effect on the clinicopathological parameters in the infested camels (Riviere et al., 2009; Awol et al., 2014; Feyera et al., 2015; Abdel-Saeed, 2020).
Hence, this work aimed to study the most important cliniopathological changes associated with camel mange as well as ivermectin administration in infested camels with especial reference to the serum iron (SI), ferritin, total antioxidants capacity (TAC) and matrix metalloproteinases (MMP-2, MMP-9) importance as markers for the disease and treatment monitoring.
MATERIALS AND METHODS
Animals
After the ethical approval of Animal and Poultry Health Department, Desert Research Center (DRC), Cairo, Egypt, 20 non-pregnant she-camels (Camelus dromedarius, aged 3-4 years), weight 380-400 kg were divided into 2 groups:
Control group (CG): 10 she-camels apparently-healthy (normal skin, no itching or purities).
Diseased group (DG): 10 she-camels suffered from clinical signs of mange (emaciation, poor appetite, pale mucous membrane, alopecia, itching, keratinized skin, annoyed and restless). Skin scraping and microscopical examination confirmed the diagnosis (Sarcoptic mites) (Ulutas et al., 2005). A single dose of ivermectin 1% (Promectine®, Invesa) was subcutaneously injected in the diseased group at dose (1ml/50 kg) + permethrine 5% (Ectomethrin®5, Misr Co. For Pharm. Ind.) was applied on the skin lesion daily till the complete cure (treated group (TG)).
Sample collection and analysis
Statistical analysis
All estimated parameters were expressed as mean ± standard deviation (SD). SPSS program version 20 was used for comparing between the means of the studied groups by one-way ANOVA test and detection of the post hoc differences between means by a multiple comparison Tukey`s HSD test. Differences were considered significant when P˂ 0.05.
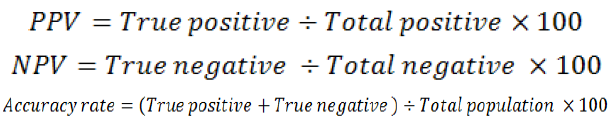
The positive predictive value (PPV), negative predictive value (NPV) and accuracy rate for them were calculated according the next equations:
RESULTS AND DISCUSSION
The treated she-camels showed a marked improvement of the clinical signs and they gradually obtained normal appetite, mucous membrane color and body weight and become rest. A prominent enhancement of the skin lesion and the skin re-appeared smooth and weber grew again at 21st day. Microscopically, the skin scraping by 21st day showed no living mites, just few debris completely withdrew at 28th day.
Hematological parameters and iron profile
Table 1 illustrated a significant (P˂ 0.05) reduction in all red blood cell parameters and indices (red blood cell count (RBCs), hemoglobin concentration (Hb), packed cell volume (PCV), mean corpuscular hemoglobin (MCH), mean corpuscular hemoglobin concentration (MCHC),
Table 1: Comparison between the hematological parameters and iron profile in CG, DG and TG (N=10). Values are means ± SD.
| Parameters | CG | DG |
TG |
|||
|
7th day |
14th day |
21st day |
28th day |
|||
|
RBCs(×106/μl) |
10.79±0.34d |
9.06±0.41c |
10.01±0.09c |
10.66±0.21 | 10.79±0.34 | 10.79±0.34 |
| Hb (g/dl) |
12.16±0.35d |
8.76±0.11c |
11.48±0.37c |
12.15±0.35 | 12.16±0.35 | 12.23.0.37 |
| PCV (%) |
36.40±0.52d |
27.80±0.46c |
30.13±0.30c |
36.40±0.52 | 36.40±0.52 | 36.40±0.52 |
| MCV (fl) |
33.80±0.75d |
30.73±1.57c |
30.13±0.30c |
34.15±0.53 | 33.76±0.94 | 33.76±0.94 |
| MCH (pg) |
11.28±0.38d |
9.68±0.46c |
11.48±0.40 | 11.40±0.42 | 11.28±0.38 | 11.34±0.47 |
| MCHC (%) |
33.42±1.19d |
31.52±0.52c |
38.10±1.25c |
33.39±1.20 | 33.42±1.19 | 33.60±1.31 |
|
TLC(×103/μl) |
8.43±0.30d |
10.37±0.23c |
9.38±0.12c |
8.19±0.44 | 8.40±0.28 | 8.40±0.28 |
|
N(×103/μl) |
5.08±0.23d |
7.09±0.19c |
6.01±0.05c |
4.81±0.42 | 5.05±0.23 | 5.05±0.23 |
|
L(×103/μl) |
2.56±0.16d |
1.97±0.05c |
2.31±0.10c |
2.53±0.87 | 2.56±0.16 | 2.56±0.16 |
|
E(×103/μl) |
0.36±0.04d |
0.89±0.01c |
0.63±0.02c |
0.40±0.01 | 0.36±0.04 | 0.36±0.04 |
|
M(×103/μl) |
0.41±0.04 | 0.50±0.04 | 0.50±0.04 | 0.50±0.04 | 0.41±0.04 | 0.41±0.04 |
|
B(×103/μl) |
0.39±0.05 | 0.38±0.04 | 0.39±0.06 | 0.39±0.06 | 0.39±0.06 | 0.39±0.06 |
| SI (μg/dl) |
164.11±6.30d |
123.61±2.45c |
135.61±3.81c |
150.81±0.98c |
160.42±4.02 | 162.58±6.51 |
| TIBC (μg/dl) |
475.54±11.58d |
634.40±39.67c |
587.01±8.39c |
499.20±6.12c |
489.70±3.54 | 478.49±11.06 |
| UIBC (μg/dl) |
311.43±12.77d |
510.78±38.71c |
451.39±9.41c |
348.39±6.39c |
329.28±5.21 | 315.92±8.19 |
| Tf sat. % |
34.53±1.52d |
19.55±1.13c |
23.11±0.74c |
30.21±0.45c |
32.76±0.85c |
33.97±0.99 |
| Ferritin (ng/ml) |
124.50±4.82d |
167.14±6.29c |
156.18±2.63c |
133.68±1.96c |
128.33±3.71 | 124.90±5.40 |
| Tf (mg/dl) |
15.62±0.69d |
24.28±2.02c |
20.81±0.11c |
18.40±0.12c |
16.01±0.99 | 15.86±0.79 |
d (significant between the studied groups); c (significant with CG); considered statistically significant at P<0.05. CG: Control group; DG: Diseased group before treatment; TG: Diseased group after treatement; RBCs: Red blood cell count; Hb: Hemoglobin concentration; PCV: Packed cell volume; MCV: Mean corpuscular volume; MCH: Mean corpuscular hemoglobin; MCHC: Mean corpuscular hemoglobin concentration; TLC: Total leukocytic count; N: Neutrophils; L: Lymphocytes; E; Eosinophils; M: Monocytes; B: Basophils; SI: Serum iron; TIBC: Total iron binding capacity; UIBC: Unsaturated iron binding capacity; Tf sat.%: Transferrin saturation percentage; Tf: Transferrin.
lymphocytes, SI, Tf sat. % in DG compared to CG. On the contrary, a significant (P˂ 0.05) increment in total leukocytic counts (TLC), neutrophils, eosinophils, TIBC, UIBC, ferritin and Tf in DG in relation to CG.
Biochemical parameters
Table 2 exhibited a significant (P˂ 0.05) elevation in serum concentration of total protein (TP), total globulin (Glob), liver function tests (aspartate aminotransferase (AST), Alanine aminotransferase (ALT), total bilirubin (T-bilirubin), direct bilirubin (D-bilirubin), indirect bilirubin (I-bilirubin)), kidney function tests (urea, creatinine (Cr)), total lipids, triglycerides, cholesterol, LDL/HDL-cholesterol, MMP-2, MMP-9 in DG compared to CG. On the contrary, the serum levels of albumin (Alb), albumin/globulin ratio (A/G), glucose and TAC significantly (P˂ 0.05) declined in DG in relation to CG.
After treatment
Most of the previous parameters levels significantly (P˂ 0.05) increased or decreased in TG (in relation to DG) towards CG levels. CG levels were achieved in TG (non-significantly (P> 0.05) changed with CG) at 7th day for MCH, at 14th for RBCs, Hb, PCV, MCV, MCHC, TLC, neutrophils, lymphocytes, eosinophils, glucose, total lipids, triglycerides, cholesterol, LDL/HDL-cholesterol, at 21st days for SI, ferritin, TIBC, UIBC, Tf,, Glob, MMP-2, MMP-9 and at 28th day for Tf sat. %, A/G, AST, D-bilirubin, Cr, TAC. While, till the end of the experiment TG (compared to CG) showed a significant (P˂ 0.05) decrease in TP, Alb as well as a significant (P˂ 0.05) increase in ALT, T/I-bilirubin and urea. Interestingly, TG compared to DG revealed a significant (P˂ 0.05) increment in MCHC, AST, ALT, T/D-bilirubin and a significant (P< 0.05) decline in Alb, TAC at 7th day (Tables 1, 2).
Regarding the value of SI, ferritin, TAC, MMP-2 and MMP-9 importance as diagnostic and prognostic markers for the disease and its treatment evaluation, Table 3 demonstrated that all of them yielded excellent numbers of AUC, sensitivity%, specificity%, LR, PPV%, NPV%, accuracy rate% in both DG and TG except TAC displayed moderate values of AUC and LR in TG.
Sarcoptic mange is still an obstacle facing camel breeding expansion. Clinically, the diseased animals appear weak,
Table 2: Comparison between the biochemical parameters in CG, DG and TG (N=10). Values are means ± SD.
| Parameters | CG | DG |
TG |
|||
|
7th day |
14th day |
21st day |
28th day |
|||
| TP (g/dl) |
5.82±0.40d |
7.77±0.26c |
4.58±0.08 c |
5.02±0.05 c |
4.99±0.05 c |
5.39±0.11 c |
| Alb (g/dl) |
3.83±0.41 d |
2.37±0.30 c |
1.43±0.12 c |
2.25±0.08 c |
2.93±0.04 c |
3.41±0.14 c |
| Glob (g/dl) |
1.99±0.63 d |
5.40±5.40 c |
3.16±0.11 c |
2.77±0.09 c |
2.06±0.06 | 1.98±0.15 |
| A\G |
2.18±1.01 d |
0.45±0.11 c |
0.46±0.06 c |
0.82±0.05 c |
1.42±0.06 c |
1.73±0.19 |
| MMP-2 (ng/ml) |
16.48±1.15 d |
25.64±0.64 c |
20.74±0.15 c |
18.42±0.22 c |
17.07±0.84 | 16.80±0.89 |
| MMP-9 (ng/ml) |
24.43±2.87 d |
39.28±0.98 c |
31.18±0.75 c |
28.35±0.31 c |
26.75±2.27 | 25.55±1.97 |
| Glucose (mg/dl) |
100.62±4.36 d |
81.84±6.12 c |
90.94±0.04 c |
97.50±2.26 | 101.14±1.63 | 101.14±1.63 |
| Total lipids (mg/dl) |
424.73±7.45 d |
490.81±20.17 c |
442.90±6.49 c |
430.57±7.40 | 431.39±11.02 | 433.52±9.39 |
| Triglycerides (mg/dl) |
75.03±3.45 d |
90.79±1.74 c |
80.68±0.33 c |
77.14±3.10 | 76.75±5.81 | 78.16±5.59 |
| Phospholipids (mg/dl) |
159.54±5.19 |
160.82±5.87 | 161.74±6.58 | 162.14±7.11 | 164.89±8.27 | 164.89±8.27 |
| Cholesterol(mg/dl) |
190.16±2.83 d |
239.20±17.41 c |
200.48±0.31 c |
191.29±4.20 | 189.74±2.80 | 190.47±3.84 |
| LDL-c (mg/dl) |
93.83±1.85 d |
118.20±5.03 c |
98.69±0.32 c |
95.38±1.99 | 94.43±2.54 | 94.80±2.78 |
| HDL-c (mg/dl) |
96.34±2.70 d |
121.01±19.65 c |
101.80±0.54 c |
95.92±4.46 | 95.31±3.01 | 95.67±4.12 |
| TAC (Mm/L) |
1.49±0.14 d |
0.55±0.04 c |
0.47±0.01 c |
0.81±0.06 c |
1.05±0.12 c |
1.48±0.13 |
| AST (U/L) |
20.16±0.50 d |
33.18±1.93 c |
38.61±0.27 c |
34.88±0.04 c |
25.51±2.47 c |
20.29±0.28 |
| ALT (U/L) |
26.83±2.62 d |
42.57±1.36 c |
46.61±0.30 c |
40.86±0.09 c |
30.58±0.16 c |
29.04±0.10 c |
| T-bilirubin (mg/dl) |
0.42±0.03 d |
0.94±0.03 c |
1.02±0.02 c |
0.88±0.04 c |
0.76±0.03 c |
0.53±0.03 c |
| D-bilirubin (mg/dl) |
0.23±0.02 d |
0.39±0.03 c |
0.49±0.03 c |
0.35±0.02 c |
0.27±0.02 c |
0.25±0.02 |
| I-bilirubin (mg/dl) |
0.20±0.03 d |
0.54±0.05 c |
0.52±0.04 c |
0.53±0.04 c |
0.49±0.04 c |
0.28±0.04 c |
| Urea (mg/dl) |
24.90±1.56 d |
38.55±0.70 c |
42.59±0.38 c |
36.55±0.36 c |
28.71±0.27 c |
26.28±0.12 c |
| Cr (mg/dl) |
1.37±0.30 d |
2.01±0.05 c |
2.36±0.12 c |
2.08±0.05 c |
1.81±0.06 c |
1.45±0.18 |
d (significant between the studied groups); c (significant with CG), considered statistically significant at P<0.05. CG: Control group; DG: Diseased group before treatment; TG: Diseased group after treatement; TP: Total protein; Alb: Albumin; Glob: Total globulin; A/G: Albumin/Globulin ratio; TAC: Total antioxidant capacity; AST: Aspartate aminotransferase; ALT: Alanine aminotransferase; T-bilirubin: total bilirubin; D-bilirubin: Direct bilirubin; I-bilirubin: Indirect bilirubin; Cr: Creatinine; HDL-c: HDL-cholesterol; LDL-c: LDL-cholesterol; MMP-2: Matrix metalloproteinase-2; MMP-9: Matrix metalloproteinase-9.
Table 3: Area under the curve (AUC), cut off points, sensitivity%, specificity%, Likelihood Ratios (LR), PPV%, NPV%, accuracy rate% of the suggested markers in DG and TG.
| Parameters | group | AUC | Cut off points | Sensitivity | Specificity | LR | PPV | NPV | Accuracy rate |
| SI (μg/dl) | DG | 1 | 155.30 | 100% | 90% | 10 | 90.91% | 100% | 95% |
| TG | 1 | 125.50 | 100% | 80% | 5 | 95.24% | 100% | 96% | |
| Ferritin (ng/ml) | DG | 1 | 130.20 | 100% | 90% | 10 | 90.91% | 100% | 95% |
| TG | 1 | 159.60 | 100% | 80% | 5 | 95.24% | 100% | 96% | |
| MMP-2 (ng/ml) | DG | 1 | 18.37 | 100% | 90% | 10 | 90.91% | 100% | 95% |
| TG | 1 | 24.90 | 100% | 90% | 10 | 97.56% | 100% | 98% | |
| MMP-9 (ng/ml) | DG | 1 | 27.33 | 100% | 80% | 5 | 83.33% | 100% | 90% |
| TG | 1 | 38.24 | 100% | 90% | 10 | 97.56% | 100% | 98% | |
| TAC (Mm/L) | DG | 1 | 1.30 | 100% | 90% | 10 | 90.91% | 100% | 95% |
| TG | 0.75 | 0.61 | 75% | 90% | 7.50 | 96.77% | 47.37% | 78% |
DG: Diseased group before treatment; TG: Diseased group after treatement; AUC= 0.5–0.65 (useless marker); AUC= 0.7–0.85 (good marker); AUC = 0.86–1 (with satisfactory sensitivity and specificity: excellent marker). LR= 0.5-5: low; LR=5-10: moderate; LR>10: high.
emaciated with pale mucous membranes (Abdally, 2010; Awol et al., 2014; Feyera et al., 2015). Whereas, the irritation and anorexia related to the disease reduce intestinal iron absorption and subsequently decrease iron availability to bone marrow and inhibit erythropoiesis process. Therefore, the blood picture of the infested camels usually clarified a hypochromic microcytic anemia. This anemia was indicated by the obtained decline in the red blood cell parameters and indices values in DG in this research as well as previous researches (Saleh et al., 2011; Momenah, 2014; Zahid, 2015; Abdel-Saeed, 2020). In accordance to this anemia, the iron profile of the infested animals in the current work showed a marked hypoferremia and a consequent raised TIBC, UIBC and decreased Tf sat. % (Abdel-Saeed, 2020). Rationally, the transferrin (major iron transport protein) activates in order to correct this hypoferremia (Gomme et al., 2005). Thus, a prominent hypertansferrinemia was observed in DG. Meanwhile, the spotted hyperferritinemia here, was mainly attributed to the host immune response. Whereas the activated pro-inflammatory cytokines due to presence of the mite and its antigenic products enhance free radicals production which destruct RBCs and hepatic cells leading to a massive iron release (Abd El-Aal et al., 2016; Bhat et al., 2017). This free iron is very harmful to the host body, so these cytokines respond by increasing iron storage as ferritin to protect the host body cells from its oxidative damage. Additionally, this mechanism prevents iron delivery to the parasites, thus it hinders the parasite iron-dependent biological process to destroy it (Kernan and Carcillo, 2017). Unfortunately, this mechanism makes the iron less accessible to the bone marrow and may duplicate the above-mentioned hypoferremia and related anemia.
Another outcome for the host immune system activation in this study, is the observed neutrophilic eosinophilic leukocytosis in DG. Whereas, the invigorated pro-inflammatory cytokines maximize circulating the neutrophils (1st line of defense) and eosinophils (specific immune cells for parasitic infestation) numbers (Zahid, 2015; El-Aal et al., 2016; Bhat et al., 2017; Abdel-Saeed, 2020). This is commonly acted through two mechanisms: first, encourage their production, proliferation, maturation in bone marrow and release in circulation. Second, rearrangement of the circulatory leukocytes and shifting more neutrophils from marginated pool to circulating pool on expanse of lymphocytes (this caused the noted lymphocytopenia in DG) (Momenah, 2014; Zahid, 2015; Abdel-Saeed, 2020). The stress and hypercortisoliemia, frequently reported with the disease, may also involve in the depicted eosinophilia in DG (Hallal-Calleros et al., 2013).
Likewise, the obtained hyperglobulinemia in DG, reflected immune proteins formation either α, β globulins (acute phase proteins, ferritin, Tf, MMPs), to limit the parasites infestation, growth and multiplication or γ globulins (immunoglobulins) to shatter and remove it (Rahman et al., 2010; Momenah, 2014; El-Aal et al., 2016; Bhat et al., 2017). In turn, a marked hyperproteinemia and decreased A/G ratio were noted in DG (Zahid, 2015). Parallel to this hyperglobulinemia, MMP-2 and MMP-9 displayed a moderate increase in their activity in DG in the present work. Whereas, the activated pro-inflammatory cytokines due to the infestation stimulate MMPs secretion from different immune cells to intensify the immune response (El-Aal et al., 2016; Bhat et al., 2017). MMPs enhance body defense mechanisms via increasing cellular proliferation, migration, angiogenesis and apoptosis (Tallant et al., 2010).
Contrariwise, the corresponding hypoalbuminemia and hypoglycemia detected in DG in this study, were assigned to amino acids and carbohydrates shortage in infested camels because of the anorexia related to the disease (Momenah, 2014; Zahid, 2015; Abdel-Saeed, 2020). Subsequently, the adipose tissue lysis increases to get energy necessary for host vital processes and a remarkable hypertriglyceridemia and subordinate hyperlipidemia were obtained in DG (Momenah, 2014; Zahid, 2015). While, the hypercholesterolemia (HDL/LDL-hypercholesterolemia) noticed in the infested camels here, referred to an augmented lipid peroxidation due to the oxidative stress recorded in the current data (the decreased TAC in DG) (Saleh et al., 2011; Zahid, 2015).
The oxidative stress is a disproportion between the free radicals generation and their scavengers activity. Free radicals are a basic part of the host innate immunity, but if they accumulate and overcome their scavengers activity they react with body tissue and cause sever organ damages (Saleh et al., 2011; Zahid, 2015). Thus, the oxidative stress had a great contribution to the elevated liver function tests (AST, ALT, T/D/I-bilirubin) and kidney function tests (urea, Cr) in DG (Momenah, 2014; Zahid, 2015). Logically, liver cell destruction hinders I-bilirubin hepatic uptake and decrease its conjugation and prevent D-bilirubin excretion. The oxidative stress may also participate in the described hyperbilirubinemia in DG by another way, as it attacks RBCs and enhances their destruction resulting more I-bilirubin production and dependent hyperbilirubinemia either indirect or total (Momenah, 2014; Zahid, 2015).
The ivermectin efficiently controlled the mange infestation and the skin lesions completely recovered at 21st day and no living mites were found in the skin scraping. This result is compatible with the previous reports about ivermectin curative action against different types of mites. As, it easily causes parasite death and paralysis through increasing membrane permeability to chloride ions thus inhibiting the electrical activity of nerve cells in nematodes and muscle cells in arthropods. Ivermectin also stimulates the inhibitory neurotransmitter production, GABA at pre-synaptic neurons. Furthermore, it widely distributes in different tissues and lasts in adipose tissue and skin in huge amounts for long periods. So, it acts against different ectoparasites types and stages (Santoro et al., 2003; Henno et al., 2005; Abdally, 2010; Chhaiya et al., 2012).
Sequentially, ivermectin administration worked on restoring the normal levels of the estimated hematological and biochemical parameters in DG. The fastest parameters returned to their physiological values were, these ones connected with anorexia (anemia, hypoglycemia and hyperlipidemia) (Habeeb, 2014; Falohun and Sadiq, 2015; Zahid, 2015). Whereas, the general clinical signs vanished after ivermectin injection and the infested camels became quiet and started to eat normally and gain weight.
Although the normal leukogram reappeared at 14th day due to the death of parasites and absence of its antigenic stimuli as well as the inhibitory effect of ivermectin on the pro-inflammatory cytokines (Zhang et al., 2008), but the immune parameters ranked second. Whereas, the achievement of total globulin, MMP-2 and MMP-9 normal levels delayed to 21st day. Logically, they took more time to clean the body from the infestation consequences (remove the parasites debris, eggs and toxic products) (Zahid, 2015). Similarly, hypoferremia and hyperferritinemia (and subsequent other iron profile changes) in DG were corrected at 21st day (Tf sat. % at 28th day), as they have an immune origin as mentioned before in the present work.
Oxidative stress and related alterations (liver and kidney function tests) were the last parameters approached CG levels. Whereas, ivermectin administration usually induces a degree of oxidative stress and subsequent hepatic and renal damages, indicated in this work by the noted decrease in TAC and the prominent increase in liver and kidney function tests in TG compared to DG at 7th day (Behera et al., 2011). Therefore, TAC, AST, D-bilirubin and Cr were corrected at 28th while, ALT, T/I-bilirubin, urea presented a mild increment till the end of the research (Zahid, 2015). Reasonably, the slight hypoalbuminemia (consequent hypoproteinemia and decreased A/G) noticed in TG at the study end was due to the hepatic damage as liver is the concerned organ with albumin synthesis (Stockham and Scott, 2008). It worth to mention that, the high values of MCHC observed in TG in relation DG at the 7th day were also assigned to the oxidative stress associated with ivermectin administration and subordinate hemolytic anemia (Stockham and Scott, 2008).
Concerning the diagnostic and prognostic value of SI, ferritin, TAC, MMP-2 and MMP-9 for the camel mange, Table 3 data suggested them as useful indicators for the disease and confirmed their importance in the disease treatment follow-up and evaluation.
Finally, the study cleared that camel mange treatment with ivermectin has several adverse effects on liver and kidney functions tests (due to oxidative stress) may extend for a while. The study strongly recommended antioxidant administration with ivermectin to reduce its side effects. SI, ferritin, TAC, MMP-2 and MMP-9 may be good markers for camel mange diagnosis and prognosis and for its treatment monitoring.
ACKNOWLEDGMENTS
Camel Research Centre (Matrouh), Animal Production Research Institute, ARC, Ministry of Agriculture, Dokki, Giza, Egypt.
Author’s Contribution
All authors contributed equally.
Conflict of interest
The authors have declared no conflict of interest.
References

