
Advances in Animal and Veterinary Sciences


Research Article

Two-Dimensional Speckle Tracking for Quantitative Right Ventricular Wall Motion Analysis in Horses Affected by Equine Asthma
Heidrun Gehlen1, Tibor Schuster2, Tarek Shety3*, Heba El-Zahar3, Anna Stahl4
1Equine Clinic, Veterinary Faculty, Freie Universität Berlin, Berlin, Germany; 2Institute of Medical Statistics and Epidemiology, Klinikum Rechts der Isar, Technischen Universität München, Munich, Germany; 3Animal Medicine Department, Faculty of Veterinary Medicine, Zagazig University, Egypt; 4Equine Clinic, Faculty of Veterinary Medicine, Ludwig-Maximilians Universität München, Munich, Germany.
Abstract | The aim of the present study was to evaluate the right ventricular (RV) wall motion by two-dimensional speckle tracking (2DST) in healthy horses and in severe asthmatic horses. Twelve warmblood horses were examined, of which six horses were clinically healthy and six horses suffered from severe equine asthma. 2DST echocardiographic examination was performed on the right ventricular myocardium in a standardised right-long-axis-view. The right ventricular free wall and the interventricular septum were divided into 3 myocardial segments each. Myocardial velocities, strain, strain rate and displacement parameters were measured in all 6 right ventricular myocardial segments. The early diastolic filling velocity at the transverse plane of the basal right ventricular (basRV) segment was significantly (P = 0.041) decreased in asthmatic horses compared to healthy horses. In the longitudinal plane of mid right ventricular (midRV) segment, the early diastolic filling (E) and late diastolic filling (A) velocities were significantly higher in asthmatic horses compared to healthy horses. Strain at the longitudinal plane of the basRV segment was significantly (P = 0.045) increased in asthmatic horses. Strain rate at the transverse apical right ventricular (apRV) segment during late diastolic filling stage was significantly (P = 0.041) lower in severe asthmatic horses. In general the differences happen at the level of the right ventricular free wall and not at the level of the IVS and there is an impact on the early and or late diastolic and not on the systolic function. In conclusion, 2DST is able to quantify right ventricular myocardial function in healthy horses and may be helpful in detection of myocardial alterations due to equine asthma.
Keywords | 2DST, Asthma, Right ventricle, Diastole, Systole
Editor | Kuldeep Dhama, Indian Veterinary Research Institute, Uttar Pradesh, India.
Received | September 28, 2018; Accepted | November 01, 2018; Published | January 30, 2019
*Correspondence | Tarek Shety, Animal Medicine Department, Faculty of Veterinary Medicine, Zagazig University, Egypt; Email: tarekshety@gmail.com
Citation | Gehlen H, Schuster T, Shety T, El-Zahar H, Stahl A (2019). Two-dimensional speckle tracking for quantitative right ventricular wall motion analysis in horses affected by equine asthma. Adv. Anim. Vet. Sci. 7(4): 280-288.
DOI | http://dx.doi.org/10.17582/journal.aavs/2019/7.4.280.288
ISSN (Online) | 2307-8316; ISSN (Print) | 2309-3331
Copyright © 2019 Gehlen et al. This is an open access article distributed under the Creative Commons Attribution License, which permits unrestricted use, distribution, and reproduction in any medium, provided the original work is properly cited.
Introduction
Echocardiography is considered the gold standard in the evaluation of equine cardiac function (Koenig et al., 2017) and diagnosis of cardiac disorders (Decloedt et al., 2013). Different modalities are used for routine echocardiography including M-mode, pulsed wave, two-dimensional echocardiography, Doppler and Tissue Doppler Imaging (TDI) (Koenig et al., 2017) and two-dimensional speckle tracking (2DST) (Matias et al., 2009). 2DST is a new non-invasive imaging modality that permits offline calculation and quantification of myocardial velocities and deformation parameters such as strain and strain rate (Blessberger and Binder, 2010). 2DST imaging traces myocardial segments acoustically by its gray-scale-pattern, which is referred to as speckle tracking (D’Hooge, 2008). Anatomic and geometric limitations of echocardiography of the right ventricle are overcome by using this technique, as it is angle-independent (Longobardo et al., 2017). In human medicine, this technique has already shown its advantages as a non-invasive screening tool in diagnostics of chronic obstructive pulmonary disease (COPD), secondary pulmonary hypertension and heart failure (Dambrauskaite et al., 2007; Kalogeropoulos et al., 2008; Lopez-Candales et al., 2007; Pirat et al., 2006; Vitarelli et al., 2006). It is also valuable in cardiac resynchronization therapy (D’Andrea et al., 2007; Shi et al., 2009), diagnosis of arrhythmogenic right ventricular cardiomyopathy (Teske et al., 2009) and other systemic diseases secondarily affecting right heart function (Kosmala et al., 2007; Lindqvist et al., 2006; Matias et al., 2009). In veterinary medicine, speckle tracking has been used so far to evaluate left ventricular function in dogs (Chetboul et al., 2007b), horses (Schwarzwald et al., 2009a) and goats (Berli et al., 2015). In dogs, it was shown that the left ventricular contractility is impaired and the speckle tracking parameters were changed in dogs with cardiomyopathy (Chetboul et al., 2007a). In horses with lower airway obstruction, there were significant increase in the pulmonary artery pressure and diameter and abnormal interventricular septal motion (Johansson et al., 2007; Pirie, 2014). In the same context, in human medicine, due to increased pulmonary hypertension in pulmonary embolism or strenuous exercise, there was right ventricular (RV) adaptations include RV dilatation (Watts et al., 2010). Right heart size and function has been evaluated recently by tissue Doppler and speckle tracking echocardiography in horses with severe asthma (Decloedt et al., 2017a; Decloedt et al., 2017b). To our knowledge, 2DST of the equine right ventricular function has been scarcely investigated in relation to pulmonary dysfunction. Only in severe cases of equine asthma, the right ventricular dimensional, pressure changes or valve insufficiencies could be detected by conventional echocardiography (Gehlen et al., 2008; Johansson et al., 2007; Sage et al., 2006), invasive right heart catheterization or post-mortem studies (Dixon, 1978; Dixon et al., 1982). The aim of the present study was to quantify the right ventricular myocardial function by 2DST in healthy horses and to compare it with those affected by severe equine asthma. We hypothesised that equine asthma has an impact on right ventricular myocardial function that may be early detectable by 2DST imaging.
Materials and methods
Study Population
Twelve warmblood horses admitted to the Equine Clinic of Ludwig-Maximilians University Munich, Germany were used in the present study, with a mean age of 10 ± 2 years. Both groups included 1 stallion, 3 geldings and 2 mares. All horses were not received any medication two months prior to echocardiographic examination and not suffered from valve insufficiencies or cardiac dimensional changes. Six horses had a history of severe equine asthma and an arterio-alveolar oxygen difference (AaDo2) >15 mmHg in arterial blood gas analysis (Group 2), with a mean height of 170 ± 6.1 cm and a mean weight of 559 ± 51.1 kg. The diagnosis of equine asthma was based on clinical signs continued for at least 3 months including coughing, nasal discharge and dyspnoea at rest. The results of clinical scoring system included the clinical signs score, excessive mucous production and thickened tracheal bifurcation in the endoscopic examination, increased cellular density and neutrophils percentage in the cytological evaluation of the tracheal aspirates and an arterio-alveolar oxygen difference (AaDo2) >15 mmHg in arterial blood gas analysis were previously described (Barton et al., 2015; Calzetta et al., 2018; Couetil et al., 2016). The results of echocardiographic measurements in severely asthmatic horses were compared with those in control group of 6 healthy horses (Group 1). The control horses had a mean height of 169 ± 3.9 cm and a mean weight of 574 ± 32.6 kg, and were considered healthy without a history of respiratory disease based on their history, physical examination, results of arterial blood gas analysis, cardiac and lung auscultation, endoscopy and routine echocardiographic examination.Both groups included 1 stallion, 3 geldings and 2 mares. The owners of diseased horses gave permission to involve their horses in the present study and to perform additional 2DST image. In addition, the Animal Care Committee of the Ludwig-Maximilians University Munich approved sampling and echocardiographic examinations of healthy horses (approval no. L0162/10).
Echocardiography (2DST)
All horses included in the present study underwent an echocardiography examination, for which the horses remained unsedated in their stalls restrained by experienced grooms. Cardiac windows were shaved and prepared with alcohol and ultrasonic coupling gel. Echocardiography was performed using a portable ultrasound unit (GE Vivid i, GE Medical Systems, Horten, Norway) equipped with a phased array transducer (3S-RS phased array transducer, GE Medical Systems, Horten, Norway) at a frequency of 1.5/3.5 MHz. An electrocardiogram (ECG) was obtained simultaneously and stored for offline analysis. Echocardiography as well as offline analyses were performed by a single, well-trained observer. The right ventricle was imaged from standard right parasternal long-axis four-chamber view. Depth was fixed at 15 cm and the angle at 90° to image the right ventricle and interventricular septum at the most optimal achievable frame rate of 47.9 fps.
Offline Analysis
Offline analysis was performed using EchoPAC Clinical Workstation Software (EchoPAC Software, version 7.0.0, GE Vingmed Ultrasound A/S, Horten, Norway). Two-chamber setting for offline data analysis was applied. Early and late diastolic filling velocity quotient (E/A) was calculated for every defined myocardial segment. Additionally electro-mechanical coupling-periods, time intervals from onset Q in the electrocardiogram to peak myoca-
Table 1: Right parasternal long-axis view, gray scale analysis: right ventricular velocities (cm/s) of the individual segments (basal, mid, apical) in longitudinal and transverse planes in 6 healthy warmblood horses (group 1) compared to 6 asthmatic warmblood horses (group 2). Results were expressed as mean ± s.d, median, RMSCV % and P-value.
| Variable (cm/s) | Group | basRV | midRV | apRV | ||||||
| Mean ± s.d. | Median | RMSCV (%) (P) | Mean ± s.d. | Median | RMSCV (%) (P) | Mean ± s.d. | Median | RMSCV (%) (P) | ||
| VL_S | 1 | 7.29±0.89 | 7.47 |
16.7 (0.937) |
6.26±1.51 | 6.56 |
17.5 (0.18) |
2.84±0.74 | 2.76 |
37.8 (0.914) |
| 2 | 7.28±1.92 | 7.41 | 7.56±1.12 | 7.30 | 2.04±2.75 | 2.79 | ||||
| VL_E | 1 | -10.84±0.68 | -10.51 |
24.2 (0.589) |
-9.03±2.11 | -8.63 |
16.3 (0.041) |
-2.64±0.9 | -2.72 |
19.9 (0.114) |
| 2 | -10.24±2.5 | -10.20 | -12.3±0.68 | -12.22 | -4.08±4.97 | -5.29 | ||||
| VL_A | 1 | -3.07±0.76 | -3.20 |
37.1 (0.818) |
-4.52±1.69 | -4.02 |
28 (0.015) |
-2.04±1.01 | -1.85 |
38.9 (0.257) |
| 2 | -3.58±1.51 | -3.23 | -7.43±1.62 | -7.04 | -2.94±1.26 | -2.70 | ||||
|
VL_ E/A |
1 | 4.2±1.5 | 3.80 |
35.9 (0.485) |
2.2±0.7 | 2.20 |
17.9 (0.24) |
2±1.3 | 1.9 |
42.9 (1) |
| 2 | 3.2±0.9 | 3.50 | 1.8±0.3 | 1.70 | 1.6±2.2 | 2.3 | ||||
| VT_S | 1 | 3.47±1.6 | 3.21 |
29.2 (0.485) |
4.02±1.29 | 4.34 |
19 (0.18) |
1.86±0.83 | 1.37 |
36.7 (0.792) |
| 2 | 2.76±1.77 | 2.35 | 3.22±1.32 | 3.96 | 1.63±0.95 | 1.40 | ||||
| VT_E | 1 | -4.81±1.61 | -5.08 |
27.7 (0.041) |
-5.93±2.38 | -5.33 |
24.8 (0.818) |
-2.69±1.24 | -2.24 |
39.1 (0.792) |
| 2 | -3.02±0.83 | -2.82 | -4.55±2.01 | -4.89 | -2.96±1.34 | -2.69 | ||||
| VT_A | 1 | -1.56±0.72 | -1.49 |
33.7 (0.818) |
-1.66±0.54 | -1.67 |
36.9 (0.394) |
-1.38±0.82 | -1.15 |
30.4 (0.126) |
| 2 | -1.92±2.06 | -1.49 | -1.3±0.58 | -1.49 | -0.91±0.58 | -0.79 | ||||
|
VT_ E/A |
1 | 3.8±2.2 | 2.90 |
40.8 (0.699) |
4.2±2.2 | 3.20 |
40.9 (0.589) |
3.1±3 | 1.80 |
36.3 (0.257) |
| 2 | 3.8±2.8 | 2.60 | 4.4±2.4 | 3.80 | 3.7±1 |
3.40 |
||||
Group 1: control; Group 2: severe equine asthma; VL: longitudinal velocity; VT: transverse velocity; basRV: basal right ventricular segment; midRV: mid right ventricular segment; apRV: apical right ventricular segment; _S: systolic; _E: early diastolic; _A: late diastolic/atrial contraction; E/A: quotient of early diastolic and late diastolic/atrial contraction velocities; s.d.: standard deviation; P: value of significance; RMSCV: root mean square coefficient of variance.
Table 2: Right parasternal long-axis view, gray scale analysis: interventricular septum velocities (cm/s) of the individual segments (basal, mid, apical) in longitudinal and transverse planes in 6 healthy warmblood horses (group 1) compared to 6 asthmatic warmblood horses (group 2). Results were expressed as mean ± s.d, median, RMSCV % and P-value.
| Variable (cm/s) | Group | apIVS | midIVS | basIVS | ||||||
| Mean ± s.d. | Median | RMSCV (%) (P) | Mean ± s.d. | Median | RMSCV (%) (P) | Mean ± s.d. | Median | RMSCV (%) (P) | ||
| VL_S | 1 | 4.13±1.61 | 3.42 |
16.3 (0.937) |
6.98±1.83 | 7.34 |
7.9 (0.937) |
9.57±2.01 | 10.45 |
7.9 (0.24) |
| 2 | 4.54±1.53 | 4.99 | 7.1±2.08 | 8.18 | 10.89±1.19 | 10.98 | ||||
| VL_E | 1 | -3.22±1.09 | -3.14 |
18.4 (0.485) |
-6.66±1.68 | -6.68 |
10 (0.093) |
-9.03±1.21 | -8.73 |
10.7 (0.18) |
| 2 | -3.99±1.71 | -4.39 | -8.08±1.02 | -8.21 | -10.1±1.41 | -10.41 | ||||
| VL_A | 1 | -3.93±1.05 | -3.95 |
18.2 (0.065) |
-5.41±2.11 | -5.29 |
15.4 (0.485) |
-8.13±1.84 | -8.18 |
7.3 (0.818) |
| 2 | -2.91±0.72 | -3.11 | -6.34±2.02 | -6.49 | -7.39±1.98 | -7.49 | ||||
|
VL_ E/A |
1 | 0.9±0.4 | 0.80 |
22.6 (0.31) |
1.5±0.9 | 1.30 |
18.2 (0.818) |
1.2±0.2 | 1.20 |
12.4 (0.31) |
| 2 | 1.6±1.1 |
1.40 |
1.4±0.7 | 1.10 | 1.5±0.6 | 1.30 | ||||
| VT_S | 1 | 3.73±1.32 | 3.43 |
19.5 (0.937) |
4.16±0.49 | 4.27 |
15.6 (1) |
-1.88±3.31 | -3.80 |
16.5 (0.065) |
| 2 | 3.75±1.12 | 3.86 | 4.4±1.27 | 4.13 | 0.93±2.92 | 2.35 | ||||
| VT_E | 1 | -4.36±1.33 | -4.63 |
12 (0.699) |
-5.26±1.7 | -5.69 |
11.4 (0.699) |
3.68±7.37 | 7.77 |
8.4 (0.394) |
| 2 | -4.21±1 | -4.22 | -5.56±2.08 | -5.82 | 0.08±7.83 | -3.77 | ||||
| VT_A | 1 | -3.67±0.8 | -4.02 |
25.8 (0.485) |
-5.5±1.74 | -5.50 |
15.6 (0.065) |
1.19±3.14 | 2.28 |
17.8 (0.24) |
| 2 | -3.28±1.36 | -2.98 | -3.83±0.78 | -3.56 | -1.02±3.55 | -2.88 | ||||
|
VT_ E/A |
1 | 1.4±0.9 | 1.20 |
24 (0.485) |
1±0.5 | 0.80 |
21.8 (0.18) |
3±1.7 | 2.80 |
18.6 (0.24) |
| 2 | 1.4±0.4 | 1.40 | 1.6±0.8 | 1.80 | 2±1 |
1.70 |
||||
Group 1: control; Group 2: severe equine asthma; VL: longitudinal velocity; VT: transverse velocity; apIVS: apical interventricular septum segment; midIVS: mid interventricular septum segment; basIVS: basal interventricular septum segment; _S: systolic; _E: early diastolic; _A: late diastolic/atrial contraction; E/A: quotient of early diastolic and late diastolic/atrial contraction velocities; s.d.: standard deviation; P: value of significance; RMSCV: root mean square coefficient of variance.
Table 3: Right parasternal long-axis view, gray scale image analysis: right ventricle (RV) and the interventricular septum (IVS) strain (%) of the individual segments (bas, mid, apical) in longitudinal and transverse planes in 6 healthy warmblood horses (group 1) compared to 6 asthmatic horses (group 2). Results were expressed as mean ± s.d, median, RMSCV % and P-value.
| Segments | Group | Strain % (SL) in longitudinal plane | Strain % (ST) in transverse plane | ||||
| Mean ± s.d. | Median |
RMSCV (%) (P) |
Mean ± s.d. | Median |
RMSCV (%) (P) |
||
| basRV | 1 | 49.1±37.2 | 35.15 |
62.3 (0.045) |
61.7±41.01 | 40.79 |
39 (0.310) |
| 2 | 65.49±28.25 | 61.66 | 69.1±31.02 | 66.15 | |||
| midRV | 1 | -26.14±3.09 | -24.79 |
32.1 (0.589) |
46.41±29.5 | 36.12 |
27.1 (0.937) |
| 2 | -26.28±7.73 | -25.39 | 60.44±30.09 | 63.78 | |||
| apRV | 1 | -34.46±12.29 | -34.20 |
25.4 (0.394) |
28.17±15.66 | 31.38 |
27.5 (0.394) |
| 2 | -39.18±4 | -40.38 | 44.43±24.87 | 39.19 | |||
| apIVS | 1 | -27.79±9.46 | -25.01 |
17.9 (0.699) |
22.36±21.34 | 15.54 |
26.9 (0.818) |
| 2 | -27.99±6.15 | -27.97 | 26.06±15.48 | 27.83 | |||
| midIVS | 1 | -26.31±6.79 | -26.37 |
14.3 (1.000) |
26.73±22.62 | 17.31 |
48.1 (0.310) |
| 2 | -29.3±2.92 | -29.42 | 22.54±13.65 | 21.09 | |||
| basIVS | 1 | -23.22±4.31 | -22.59 |
24.5 (1.000) |
47.15±21.59 | 41.41 |
37.5 (0.818) |
| 2 | -23.56±9.21 | -24.51 | 44.16±13.57 | 43.59 | |||
Group 1: control; Group 2: severe equine asthma; SL: longitudinal strain %; ST: transverse strain %; basRV: basal right ventricular segment; midRV: mid right ventricular segment; apRV: apical right ventricular segment; apIVS: apical interventricular septum segment; midIVS: mid interventricular septum segment; basIVS: basal interventricular septum segment; s.d.: standard deviation; P: value of significance; RMSCV: root mean square coefficient of variance.
Table 4: Right parasternal long -axis view, gray scale image analysis: right ventricular strain rate (1-s) of the individual segments (basal, mid, apical) in longitudinal and transverse planes in 6 healthy horses (group 1) compared to 6 asthmatic horses (group 2). Results were expressed as mean ± s.d, median, RMSCV % and P-value.
| Variable (cm/s) | Group | basRV | midRV | apRV | ||||||
| Mean ± s.d. | Median | RMSCV (%) (P) | Mean ± s.d. | Median | RMSCV (%) (P) | Mean ± s.d. | Median |
RMSCV (%) (P) |
||
| SrL_S | 1 | 2.21±1.11 | 2.03 |
28 (0.485) |
-1.44±0.26 | -1.36 |
25.1 (0.394) |
-1.7±0.72 | -1.67 |
18.9 (0.818) |
| 2 | 2.63±0.83 | 2.50 | -1.37±0.44 | -1.19 | -1.88±0.31 | -1.86 | ||||
| SrL_E | 1 | -3.11±1.05 | -2.83 |
41.6 (0.818) |
2.19±0.31 | 2.14 |
27 (0.065) |
2.16±0.74 | 1.94 | 21.5 (0.699) |
| 2 | -3.29±0.86 | -3.00 | 1.55±0.59 | 1.48 | 2.29±0.62 | 2.12 | ||||
| SrL_A | 1 | -2.14±1.23 | -1.59 |
40.5 (0.093) |
0.82±0.2 | 0.87 |
22.5 (0.31) |
1.05±0.36 | 1.11 |
19.1 (0.31) |
| 2 | -3.68±1.48 | -3.38 | 0.75±0.39 | 0.57 | 1.28±0.39 | 1.31 | ||||
| SrT_S | 1 | 1.93±0.52 | 2.14 |
24.7 (0.31) |
1.38±0.33 | 1.42 |
20.4 (0.485) |
1.01±0.41 | 1.04 |
19.7 (0.24) |
| 2 | 2.29±0.66 | 2.52 | 1.52±0.28 | 1.50 | 1.27±0.53 | 1.27 | ||||
| SrT_E | 1 | -2.85±0.97 | -2.82 |
38.9 (0.24) |
-1.69±0.7 | -1.73 |
30.1 (0.818) |
-1.27±0.67 | -1.32 |
35.7 (0.699) |
| 2 | -2.11±0.81 | -2.08 | -1.73±0.61 | -1.61 | -1.6±0.57 | -1.54 | ||||
| SrT_A | 1 | -1.3±0.8 | -1.28 |
60.6 (0.18) |
-0.86±0.54 | -0.62 |
38.1 (0.065) |
-0.75±0.31 | -0.65 |
40.9 (0.041) |
| 2 | -0.71±0.97 | -0.40 | -0.51±0.25 | -0.43 | -0.46±0.11 |
-0.46 |
||||
Group 1: control; Group 2: severe equine asthma; SrL: longitudinal strain rate; SrT: transverse strain rate; basRV: basal right ventricular segment; midRV: mid right ventricular segment; apRV: apical right ventricular segment; _S: systolic; _E: early diastolic; _A: late diastolic/atrial contraction; s.d.: standard deviation; P: value of significance; RMSCV: root mean square coefficient of variance.
Table 5: Right parasternal long -axis view, gray scale image analysis: interventricular septum strain rate (1-s) of the individual segments (basal, mid, apical) in longitudinal and transverse planes in 6 healthy horses (group 1) compared to 6 asthmatic horses (group 2). Results were expressed as mean ± s.d, median, RMSCV % and P-value.
| Variable (cm/s) | Group | apIVS | midIVS | basIVS | ||||||
| Mean ± s.d. | Median | RMSCV (%) (P) | Mean ± s.d. | Median | RMSCV (%) (P) | Mean ± s.d. | Median |
RMSCV (%) (P) |
||
| SrL_S | 1 | -1.41±0.59 | -1.27 |
18.9 (0.485) |
-1.12±0.37 | -1.03 |
14 (0.31) |
-1.18±0.22 | -1.21 |
18.1 (0.937) |
| 2 | -1.48±0.37 | -1.40 | -1.33±0.29 | -1.30 | -1.14±0.4 | -1.12 | ||||
| SrL_E | 1 | 1.62±0.68 | 1.42 |
29.8 (0.589) |
1.6±0.4 | 1.56 |
19 (0.937) |
1.31±0.46 | 1.41 |
28.3 (0.394) |
| 2 | 1.64±0.52 | 1.60 | 1.64±0.57 | 1.53 | 1.48±0.47 | 1.70 | ||||
| SrL_A | 1 | 1.28±0.26 | 1.33 |
16 (0.31) |
0.86±0.18 | 0.85 |
22.4 (0.485) |
0.92±0.43 | 0.84 |
34.3 (0.394) |
| 2 | 1.15±0.28 | 1.18 | 0.77±0.25 |
0.81 |
0.75±0.54 | 0.53 | ||||
| SrT_S | 1 | 0.96±0.43 | 0.98 |
22.6 (0.937) |
0.94±0.32 | 0.94 |
29.4 (0.485) |
1.34±0.42 | 1.24 |
32.2 (0.818) |
| 2 | 0.96±0.35 | 1.03 | 0.8±0.17 | 0.76 | 1.38±0.42 | 1.43 | ||||
| SrT_E | 1 | -1±0.36 | -0.92 |
35.4 (0.818) |
-1.11±0.44 | -1.09 |
35.7 (0.394) |
-1.28±0.46 | -1.27 |
36.7 (0.24) |
| 2 | -1.1±0.28 | -1.01 | -0.8±0.3 | -0.81 | -0.96±0.35 | -0.92 | ||||
| SrT_A | 1 | -0.71±0.3 | -0.78 |
32.5 (0.132) |
-0.69±0.13 | -0.75 |
35.9 (0.24) |
-1.15±0.71 | -1.06 |
37 (0.24) |
| 2 | -0.48±0.12 | -0.42 | -0.59±0.21 | -0.57 | -0.7±0.31 |
-0.65 |
||||
Group 1: control; Group 2: severe equine asthma; SrL: longitudinal strain rate; SrT: transverse strain rate; apIVS: apical interventricular septum segment; midIVS: mid interventricular septum segment; basIVS: basal interventricular septum segment; _S: systolic; _E: early diastolic; _A: late diastolic/atrial contraction; s.d.: standard deviation; P: value of significance; RMSCV: root mean square coefficient of variance.
Table 6: Right parasternal long-axis view, gray scale image analysis: Longitudinal and transverse right ventricle (RV) and the interventricular septum (IVS) displacement (mm) of the individual segments (bas, mid, apical) in 6 healthy warmblood horses (group 1) compared to 6 asthmatic horses (group 2). Results were expressed as mean ± s.d, median, RMSCV % and P-value.
| Segments | Group | Longitudinal displacement (DL) | Transverse displacement (DT) | ||||
| Mean ± s.d. | Median | RMSCV (%) (P) | Mean ± s.d. | Median |
RMSCV (%) (P) |
||
| basRV | 1 | 19±2.23 | 19.01 |
17.2 (0.065) |
10.24±5.275 | 9.37 |
31 (0.485) |
| 2 | 22.34±3.67 | 22.00 | 7.82±2.997 | 7.49 | |||
| midRV | 1 | 18.17±3.99 | 16.46 |
22.6 (0.041) |
11.03±4.53 | 11.18 |
21.7 (0.699) |
| 2 | 23.09±3.74 | 22.48 | 10.85±5.07 | 13.45 | |||
| apRV | 1 | 4.75±2.66 | 4.61 |
38.1 (0.69) |
7.24±3.65 | 7.58 |
36 (0.818) |
| 2 | 5.25±2.54 | 5.22 | 7.69±3.14 | 7.63 | |||
| apIVS | 1 | 12.48±5.84 | 11.94 |
20.9 (0.18) |
8.79±0.99 | 8.64 |
15.7 (0.31) |
| 2 | 15.18±1.44 | 15.39 | 9.42±1.2 | 8.82 | |||
| midIVS | 1 | 24.78±6.39 | 25.44 |
10.4 (0.818) |
10.86±2.06 | 11.16 |
8.1 (0.132) |
| 2 | 25.24±5.03 | 26.42 | 12.52±1.13 | 12.55 | |||
| basIVS | 1 | 35.22±5.79 | 36.79 |
7.8 (1) |
0.59±7.43 | 0.27 |
14.8 (0.093) |
| 2 | 36.16±4.89 | 37.16 | 7.62±1.57 | 7.36 | |||
Group 1: control; Group 2: severe equine asthma; DL: longitudinal displacement mm; DT: transverse displacement mm; basRV: basal right ventricular segment; midRV: mid right ventricular segment; apRV: apical right ventricular segment; apIVS: apical interventricular septum segment; midIVS: mid interventricular septum segment; basIVS: basal interventricular septum segment; s.d.: standard deviation; P: value of significance; RMSCV: root mean square coefficient of variance.
rdial events, were measured manually. The endocardium was tracked manually where region of interest (ROI) was placed on the myocardium manually clockwise starting at the interventricular septum. Tracking speckles was started automatically dividing the right ventricular free wall and interventricular septum into equal 3 segments each (basRV, midRV, apRV, apIVS, midIVS, basIVS), the software analysed the velocities, strain, strain rate and displacement. The region of interest was adjusted at a maximum width to assess the myocardium (Figure 1).
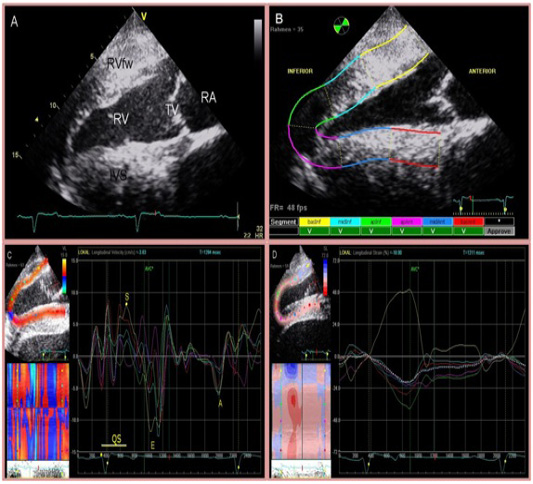
Figure 1: Four chamber view of the heart (A) and two-dimensional speckle tracking analysis (B). The right side of the image is cranial. Inferior is referred to as RV and anterior as IVS. The region of interest is manually divided into 6 segments starting at the IVS. Tracking quality is verified by the software and approved segments are marked with ‘V’. Segmental curves for long-axis images show the longitudinal velocity (C), and the longitudinal strain % (D). On the left, a greyscale image is displayed showing the tracked ROI. On the right, the segmental traces are displayed. The vertical axis represents values of the selected variable; the horizontal axis shows time (ms).
Statistical Analysis
Statistical analysis was performed using PASW Statistics 17.0 (SPSS Inc., Chicago, IL, USA). The individually based coefficient of variation (CV) was calculated and summarized using the root mean square coefficient of variation (RMSCV) to obtain a comparable statistic of sample variability within repeated measurements. The Mann-Whitney U test was used to compare the central tendency of quantitative data between two independent samples. All statistical tests were performed two-sided at a 0.05 level of significance. Intra-individual variance was analysed by calculating root mean square coefficient of variance (RMSCV) of three consecutive measurements. RMSCV was defined of very low variability (<5%), low variability (5 - 15%), moderate variability (16 - 25%) and high variability (>25%) (Schwarzwald et al., 2009b). Data are expressed as mean ± s.d., median and the RMSCV % in addition to the significance of Mann-Whitney U test.
Results
Two-dimensional speckle tracking imaging was applicable to all study subjects. All trackings were accepted by the software. Root mean square coefficient of variance was calculated for three individual 2DST tracks of consecutive cardiac cycles at a frame rate of 47.9 fps. RMSCV was of overall moderate (16 – 25%) to high (> 25%) variability for peak velocities, strain, strain rate and displacement parameters of the right ventricular myocardium. The results of speckle tracking echocardiography indicate altered RV functional measurements. There was a significant difference between the measurements of severely asthmatic horses and the control group discussed in the next paragraphs.
Longitudinal right ventricular free wall velocities at the midRV segment was significantly increased in horses affected by severe equine asthma compared to healthy horses regarding early (P = 0.041) and late diastolic filling velocities (P = 0.015) (Table 1 and 2). Transverse right ventricular free wall velocities at the basRV segment was significantly (P = 0.041) decreased in asthmatic horses compared to healthy horses during early diastolic filling (Table 1 and 2). In general, highest velocities were achieved at basal segments followed by mid and apical segments.
Strain at the longitudinal plane of the basRV segment was significantly (P = 0.045) increased in horses with severe asthma compared to clinically healthy horses (Table 3). Transverse strain has no significant changes in control and asthmatic horses in all segments. Highest strain % was obtained at the basal right ventricular segment. Strain rate at the transverse apRV segment during late diastolic filling stage was significantly (P = 0.041) lower in severe asthmatic horses (Table 4 and 5).
Myocardial displacement was higher for longitudinal than transverse movement of the right ventricle and the interventricular septum. Longitudinal displacement of the right ventricles mid segment was significantly (P = 0.041) higher in horses affected by severe equine asthma compared to control horses (Table 6).
In this study, there were some limitation included 1) the EchoPAC clinical workstation software was developed to evaluate human myocardial function from apical scan planes; 2) high quality 2D-images needed; 3) the entire right ventricle was difficult to examine from the right parasternal long axis view; 4) ROI settings were accepted by the software, But sometimes the ROI seemed not to follow the myocardium throughout cardiac movement due to the limitations of using 2-DST in horses, although these measurements were discarded.
Discussion
The present study describes two-dimensional speckle tracking (2DST) imaging to analyze right ventricular wall motion in the horse. Velocities, strain, strain rate and displacement parameters were calculated for the right ventricular wall and the interventricular septum. Early diastolic filling velocity was significantly lower in horses affected by severe equine asthma at the transverse plane of the basal segment of the right ventricular wall compared to clinically healthy horses; this might be an indicator of altered myocardial relaxation where myocardial tissue velocities represent the contractile and elastic properties of the area under investigation. This was in agreement with studies on human COPD patients, where chronic hypoxia and delayed cell to cell communication manifest as lower early diastolic filling velocity (Boissiere et al., 2005; Melek et al., 2006). Late diastolic filling velocity was significantly higher in horses suffering from severe equine asthma in the longitudinal plane of mid right ventricular free wall segments reflecting atrial contraction, which is a sign of primary pulmonary hypertension due to equine asthma and secondarily elevated right heart pressure. These alterations were mostly observed in colour or pulsed-wave Doppler myocardial studies (Lopez-Candales et al., 2009).
Highest strain percentages were obtained from the basal segment of the right ventricular wall, followed by the mid and apical segments. In addition, the strain % at the basal segment of the right ventricular wall was significantly higher in horses affected by severe equine asthma compared to clinically healthy horses, which reflects the impact of respiratory disease on contractile myocardial function. In humans, the contractile function may be compensatory elevated and delayed in onset due to higher pulmonary resistance before permanent pulmonary hypertension is evident (Dambrauskaite et al., 2003; Jamal et al., 2003; Matias et al., 2009). The late diastolic filling strain rate at the apical right ventricular free wall segment in the transverse plane was significantly lower in horses suffering from severe equine asthma. In humans, lower strain rate was correlated with higher pulmonary artery pressure (Dambrauskaite et al., 2003). Myocardial displacement was higher at the mid segment of the right ventricular free wall in horses affected by severe equine asthma compared to clinically healthy horses, which might be the consequence of elevated right ventricular pressure and correspond to strain and strain rate alterations. The contractile function in horses adapts well to recurrent hypoxia and pressure changes by elevation of displacement parameters. The strain and strain rate reflect local myocardial function; it can be used for assessment of systolic and diastolic ventricular function and may be superior to tissue velocities.
This study has some limitations, the EchoPAC clinical workstation software was used for offline analyses of stored 2D-images; this tool was developed to evaluate human myocardial function from apical scan planes. In horses, right ventricular myocardium and interventricular septum was imaged from the right parasternal long-axis view so, the software named longitudinal parameters to be transverse and vice versa.
Although the technique of 2DST is independent of angle, the need for high quality 2D-images can be a limiting factor for feasibility in equine medicine. Although all horses in this study were extensively prepared for good image acquisition by shaving, application of alcohol and ultrasonographic coupling gel, 2D image quality, in particular of the right ventricular wall, was impaired by near-field artefacts due to the proximity to the transducer (Bleeker et al., 2008; Bleeker et al., 2006). Furthermore, the entire right ventricular wall was difficult to examine using the right parasternal long axis view. The apical segment and the region next to the tricuspid valve (basal segment) were often difficult to verify. Furthermore, in horses affected by severe equine asthma, lung compartments were sometimes overlying right ventricular myocardium in the long-axis four chamber views. Although, ROI settings were accepted by the software, sometimes the ROI seemed not to follow the myocardium throughout cardiac movement due to the limitations explained above; these measurements were discarded from the analysis.
Although 2DST imaging seems to be a time saving automatic opportunity to determine myocardial function, there was another limitation, the examinations in this study were performed by an experienced, well-trained observer, and there was a moderate to high intra individual RMSCV between measurements. Once more, this fact points out the necessity of image acquisition guidelines and the need of experienced observers.
Conclusion
It is concluded that right ventricular myocardial function can be assessed by 2DST imaging based on the measurement of strain and strain rate. Severe equine asthma has an impact on the right ventricular velocities, strain, strain rate and displacement parameters before extensive changes in conventional echocardiography are evident. In addition, pulmonary hypertension and RV functional changes are evident in asthmatic horses. Further studies are needed to prove the clinical value and feasibility of 2DST imaging.
Acknowledgments
We thank the German Heart Center Munich, Department of Pediatric Cardiology and Congenital Heart Defects, Munich, Germany, especially Dr. Vogt and K. Petzuch, for their assistance in applying speckle tracking to the equine right ventricle.
Conflict of interest
We declare that there are no conflicts of interest and this research did not receive any specific grant from funding agencies in the public, commercial, or not-for-profit sectors.
Authors Contribution
Heidrun Gehlen and Tibor Schuster conceived and designed the experiment. Heidrun Gehlen, Tarek Shety and Heba El-Zahar and Anna Stahl collected the data and samples, analyzed the data and wrote the article. Anna Stahl performed laboratory analysis. All authors have read and approved the final draft of the manuscript.
References

