
Wheat Growth in Response to Model Based Applied Fertilizer Boron


Research Article

Wheat Growth in Response to Model Based Applied Fertilizer Boron
Muhammad Shafiq* and Tahir Maqsood
Directorate of Land Reclamation, Lower Chenab Canal (West), Circle Irrigation Department, Faisalabad, Punjab, Pakistan.
Abstract | A field trial was done on a medium textured soil to notice the return of wheat crop to model based applied fertilizer B. For this idea, B adsorption isotherm of the soil was developed at the Institute of Soil and Environmental Sciences, University of Agriculture, Faisalabad, during 2013-14. Adsorption procedure was done by harmonizing 2.5g soil in 0.01M CaCl2 solution having diverse B doses (0, 0.01, 0.03 , 0.05 , 0.07, 0.09, 0.11, 0.13,0.15 and 0.17 mg B L-1). Freundlich and Langmuir adsorption models were applied to the data to check the sorption of B on sandy clay loam soil. Freundlich model depicted superior fitness of the sorption (r2=0.99) statistics than Langmuir model (r2=0.75). Ten B treatments (0, 0.47, 0.81, 1.42, 1.57, 1.95, 2.35, 2.66, 3.1, 3.3 kg ha-1) were applied with recommended N, P and K doses. Boron was applied at sowing time as basal dose. The results showed that there was a positive effect of fertilizer B on grains spike-1, 1000-grain weight and grain turn out however, the vegetative growth i.e. plant height, tillering and total biomass were affected non-significantly in response to B application. Regarding chemical analysis concentration of boron in both wheat straw and grains increased with B application but there was no effect of fertilizer B on NPK concentration of straw and grains. These results are very heartening; signifying that for any soil, B adsorption isotherm need to be worked out for location precise fertilizer B use.
Received | March 04, 2016; Accepted | January 10, 2017; Published | January 26, 2017
Correspondence | Muhammad Shafiq, Directorate of Land Reclamation, Lower Chenab Canal (West), Circle Irrigation Department, Faisalabad, Punjab, Pakistan; Email: shafiq1049@gmail.com
Citation | Shafiq, M., and T. Maqsood. 2017. Wheat growth in response to model based applied fertilizer boron. Sarhad Journal of Agriculture, 33(1): 8-13.
DOI | http://dx.doi.org/10.17582/journal.sja/2017.33.1.8.13
Keywords | Boron, Wheat, Adsorption isotherm
Introduction
Fertilizer exploitation in Pakistan principally pertains to nitrogen (N) and phosphorus (P); potassium (K) utilization is restricted to a minute number of huge-K exploiting crops like tobacco and potato. Application of boron (B) is not worth mentioning. Plentiful crop varieties are extra prone to B dearth than landraces (Chaudhry et al., 1977; Rashid and Din, 1992). As a result, soil situation and agronomic activities are causing to the incidence of B dearth in plants. Grassland study in Pakistan have established yield augment owing to B exploit on quite a lot of crops, counting wheat, rice, maize, groundnuts, tobacco, as well as potato. There was 14%, 19% and 20% boost of yield owing to B in wheat, rice and maize, correspondingly (NFDC, 1998).
The rates and methods of B fertilization should be specifically defined because of the minute amounts needed for correction while avoiding over-application and possible toxicity. B should be broadcasted after incorporation to the full cultivation depth before preparing the seedbed.
A sorption isotherm is the depiction of intensity, quantity and capacity parameters, as these are imperative to indicate soil nutrients which are obligatory for supreme plant boom. It makes possible to envisage how the nutrient location of a soil can differ upon cropping. After documenting the crucial solution level for plant growth, nutrient-sorption isotherm can be used to deduce the fertilizer B sought to legalize the soil solution for uppermost yield level. As the clay minerals, CEC, organic matter, soil texture, CaCO3 and other properties affect the magnitude of nutrients indispensable by a soil, which necessitate to be measured so as to finish off soil supplies by using sorption technique. Another advantage is that for basic site-specific fertilizer suggestion an unassuming time as well as laboratory work is requisite to put up a sorption curve (Solis and Torrent, 1989). So, awareness of the sorption capacity of soils provides a precise estimate of fertilizer provisions of soils.
Empirical models such as the Langmuir and Freundlich adsorption isotherm equations conventionally present B adsorption by soils (Elrashidi and O’ Connor, 1982). Two adjustable indicators have been included mutually by these equations and presume that adsorption takes place at stable solution pH. To get paramount produce of wheat crop isotherms were used in this trial to appraise the amount of B fertilizer desired.
Materials and Methods
This field level research was chalked out during the year 2013-2014. For the creation of boron adsorption isotherms soil samples (0-15cm) were collected, air-dried, ground and passed through a 2mm sieve. Boron adsorption capability of soi was calculated by fitting the soil analysis results from laboratory to customized Freundlich and Langmuir equations. Usual methods (Moodie et al., 1959; Richards, 1954) were used for the analysis of electrical conductivity (EC), pH, CaCO3, organic matter contents and textural analyses. At 25°C 2.5g soil was stirred with 25ml 0.01M CaCl2 having B doses of 0, 3, 4, 5, 6, 7, 8, 9, 10, 15 mg/l as boric acid for 24 hours for the adsorption learning. Three times this practice was continued. Whatman filter paper No. 42 was used for filtering the soil solution as the shaking was completed. Azomethine-H method was used for calculation of B concentration in the filtrate by Spectronic-20 at 420nm wavelength after filtration, and sorption isotherm was constructed at the Institute of Soil and Environmental Sciences, University of Agriculture, Faisalabad, Pakistan according to methods presented by Rowell (1994). By deleting the equilibrium boron concentration in solution from the added boron adsorption capacity for soil was worked out.
Freundlich Model
The modified Freundlich model used to narrate the soil in this exertion is as follows:

Where;
x, amount of B adsorbed per unit of soil (mg/kg); C, Equilibrium B concentration in soil solution (mg/l); a and b, constants which correspond to the intercept and slope of the sorption isotherms, correspondingly.
Langmuir Model

Where;
x/m, amount of B adsorbed per unit of soil (mg/kg); C, equilibrium B concentration in soil solution (mg/l); k, it is a constant associated to bonding energy of B to the soil; b, it is the maximum adsorption capacity of soil.
Calculation of Fertilizer B doses
By rising adsorption isotherm in the laboratory, various levels of B solution (0, 0.01, 0.03, 0.05, 0.07, 0.09, 0.11, 0.13, 0.15 and 0.17 mg/l) were computed tentatively by Freundlich model and then corresponding to these specific solution levels fertilizer B doses were premeditated as given below:

Where;
x/m, amount of B adsorbed per unit weight of soil (mg B/kg soil); C, specific soil solution B level (mg/l).
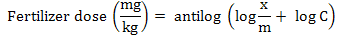

Finally the above equation was taken into account to calculate fertilizer rates alongside specific soil solution B levels.
Model based B, as Na-tetraborate fertilizer doses (0, 0.47, 0.81, 1.42, 1.57, 1.95, 2.35, 2.66, 3.1, 3.3 kg ha-1) having different solution levels (0, 0.01, 0.03, 0.05, 0.07, 0.09, 0.11, 0.13, 0.15 and 0.17mg/l) were applied to wheat crop (cv. Inqulab-91). Basal doses of NPK (110- 90- 60- kg/ ha) were added. Data on plant height, number of tillers/m2, biomass (Mg/ha), grains/ spike, 1000-grain weight (g) and grain yield (Mg/ha) were noted. Plant samples (both grain and shoot at maturity) were analyzed for NPK and total boron contents.
Table 1: Comparison of coefficients of determination (R2) for the fit of the Freundlich and Langmuir equations to the sorption data of the soil under study
| Equations | R2 |
| Freundlich Y = 0.5057x + 0.3788 | 0.99 |
| Langmuir Y = 0.0906x + 0.2632ns | 0.75 |
Results and Discussion
B availability in soil is determined by adsorption based B equilibrium solution level. Equilibrium B concentration is a superior index of soil fertility using adsorption isotherm technique (Tsadilas et al., 2005). The facts were mainly fitted to Freundlich adsorption isotherm equation as the results (Table 1) show that R2 value in Freundlich equation was highly significant (at P < 0.05). Therefore, this equation was used further in field study to calculate B fertilizer requirements of soil. By using Freundlich adsorption isotherm different soil solution B levels were worked out theoretically which ranged from 0 to 0.17 mg/l. Equivalent fertilizer B rates were from 0 to 3.31 kg per hectare (Table 2) in accordance with the adjusted same soil solution B levels in field.
Table 2: Freundlich model based B rates applied to wheat crop
| Treatment |
Adjusted soil solution B level (mg L-1) |
B rates | |
|
mg kg-1 |
kg ha-1 |
||
| Control | 0 | 0 | 0 |
| T1 | 0.01 | 0.235 | 0.47 |
| T2 | 0.03 | 0.405 | 0.81 |
| T3 | 0.05 | 0.71 | 1.42 |
| T4 | 0.07 | 0.785 | 1.57 |
| T5 | 0.09 | 0.975 | 1.95 |
| T6 | 0.11 | 1.175 | 2.35 |
| T7 | 0.13 | 1.33 | 2.66 |
| T8 | 0.15 | 1.55 | 3.1 |
| T9 | 0.17 | 1.65 |
3.3 |
Boron was applied one month after sowing. Similar procedures to find out fertilizer rate to adjust specific soil solution were adopted by other researchers to get maximum yield (Moodie et al., 1959).
Effect of fertilizer boron on different yield components of wheat crop
Wheat crop yield is related to its diverse yield parameters. Core of growth parameters that are used to express the presentation of a particular crop include plant height, tillers m-2, total biomass and 1000-grain weight (Taiz and Zeiger, 2006).
Plant height (cm), Tillers m-2, Total biomass
To attain latent and unprejudiced nourishment Plant height, tillers m-2 and total biomass play the role of genetic factors. Grain yield may also be imposed by these factors and they show the growth manners of a crop. Elevated yields are ensued from dense plant stands as plant height has an imperative role in shaping light interception and, as a result, height may turn out to be a prime determinant of individual plant’s achievement (Weiner and Fishman, 1994). There was statistically non-significant boost (Table 3) in plant height, total biomass, number of tillers m-2 due to B addition.
Table 3: Effect of fertilizer B on plant height, tillers m-2 and total biomass of wheat
| Treatment | B rate | Plant height |
No. of tillers m-2
|
Total biomass |
|
kg ha-1 |
(cm) |
Mg ha-1 |
||
| Control | 0 | 71.3 | 308 | 5.8 |
| 1 | 0.47 | 71.3 | 300 | 5.8 |
|
2 |
0.81 | 70.3 | 320 | 6.0 |
| 3 | 1.42 | 69.3 | 320 | 6.0 |
| 4 | 1.57 | 72.7 | 316 | 6.1 |
| 5 | 1.95 | 69.3 | 303 | 6.1 |
| 6 | 2.35 | 69.0 | 320 | 5.9 |
| 7 | 2.66 | 68.7 | 304 | 6.0 |
| 8 | 3.1 | 67.7 | 316 | 5.9 |
| 9 | 3.3 | 68.0 | 300 | 5.9 |
| LSD(P=0.05) | NS | |||
Similar results were obtained by Furlani et al. (2003) who explained that on rising B concentrations, plant height of wheat crop did not fluctuate a great deal, but for this trait amongst wheat cultivars, there were fluctuations, which may be considered a genetic trait of the plant. There was non-significant dissimilarity in reply to practical fertilizer B in, number of plants m-2, total number of tillers per plant and number of fertile tillers per plant (Hussain et al., 2005).
Number of grains spike- 1, 1000-grain weight, grain yield
Number of grains spike-1, 1000 grain weight and grain yield (Table 4) showed unimportant boost with 0.47 kg B ha-1 as compared to the control treatment. There was in general, an appreciable increase in these yield parameters with enhance in soil solution B level. Treatment 4 caused the highest number of grains spike-1 (48), 1000 grain weight (43.9g) and grain yield (3.15Mg ha-1) where adjusted soil solution B level was 0.07 mg L-1 and B was applied at the rate of 1.57 kg ha-1. There was a decline in these yield parameters, with the higher rates than 1.57 kg B ha-1 which might be due to the lethal effect of B. B application increased these yield parameters as there was low available B in soil before planting. B fertilizer is generally ignored by the farmers as they depend only on natural soil B and irrigation water source. B is an indispensable fertilizer element which capably alters sunlight, water, and air into high crop yields and worth food and fiber. Each incremental level of added B up to 1.57 kg ha-1 caused a continuous boost in number of grains spike-1, 1000grain weight and grain yield, as is apparent from this research work. B concentration of the soil solution explains the real B availability to a greater degree. Fertilizer B application causes B diffusion of the B-sensitive binding sites. Freundlich model is used for the determination of rates of B fertilizer and in this way for the whole crop growth period B concentration of the soil solution can be adjusted (Goldberg, 1993). The same results were achieved by Soylu et al. (2004) and Jana et al. (2005) who explained that with the B additions grain yields in all genotypes of wheat crop were amplified considerably as compared to control.
Table 4: Effect of fertilizer B on grains spike-1, 1000-grain weight and grain yield of wheat
| Treatments | B level | B rate |
No. of grains spike-1 |
1000-grain weight (g) | Grain yield |
|
mg L-1 |
kg ha-1 |
Mg ha-1 |
|||
| Control | 0 | 0 | 41.0bc | 40.2abcd | 2.99a |
| 1 | 0.01 | 0.47 | 42.0bc | 41.2abcd | 3.02a |
|
2 |
0.03 | 0.81 | 44.3ab | 42.3abc | 3.06a |
| 3 | 0.05 | 1.42 | 46.7a | 43.1ab | 3.11a |
| 4 | 0.07 | 1.57 | 48.0a | 43.9a | 3.15a |
| 5 | 0.09 | 1.95 | 41.0bc | 40.3abcd | 3.04a |
| 6 | 0.11 | 2.35 | 40.3cd | 39.4bcde | 2.76b |
| 7 | 0.13 | 2.66 | 36.7de | 38.8cde | 2.73b |
| 8 | 0.15 | 3.1 | 35.3e | 37.8de | 2.66b |
| 9 | 0.17 | 3.3 | 33.3e | 36.1e | 2.39c |
| P=0.05 | LSD=3.851 |
LSD= 0.1956 |
|||
B concentration in wheat grain and straw
Soil test data about B in Pakistan is sufficient as compared to Plant analysis. Rashid and Qayyum (1991) concluded that for farmer-grown wheat, rice, sorghum, rapeseed-mustard and peanut a systemic nutrient indexing has given wide-ranging awareness about B level and cotton (Rashid et al., 2002). In our research the B content of wheat as influenced by B application was determined in the laboratory.
B concentration in wheat grain and straw augmented with an enhancement in B-use (Table 5). But this increase was statistically non-significant.
Table 5: Effect of B on its concentration in wheat grain and straw
| Treatment | B level | B rate | B concentration (straw) | B concentration (grain) |
|
mg L-1 |
kg ha-1 |
mg kg-1 |
mg kg-1 |
|
| Control | 0 | 0 | 1.15g | 0.98 |
| 1 | 0.01 | 0.47 | 1.17f | 1.00 |
| 2 | 0.03 | 0.81 | 1.18ef | 1.00 |
| 3 | 0.05 | 1.42 | 1.18ef | 1.01 |
|
4 |
0.07 | 1.57 | 1.19de | 1.03 |
| 5 | 0.09 | 1.95 | 1.20cde | 1.03 |
| 6 | 0.11 | 2.35 | 1.21bcd | 1.04 |
| 7 | 0.13 | 2.66 | 1.21abc | 1.04 |
| 8 | 0.15 | 3.1 | 1.22ab | 1.05 |
| 9 | 0.17 | 3.3 | 1.23a | 1.06 |
| P=0.05 | LSD=0.01715 | |||
Table 6: Effect of B on NPK concentration in wheat straw and grains
| Treat-ment | B level | B rate |
NPK concentration (straw) (g kg-1) |
NPK concentration (grains) (g kg-1) |
||||
|
mg L-1 |
kg ha-1 |
N | P | K | N | P | K | |
| Control | 0 | 0 | 6.1 | 0.37 | 24.4 | 18.2 | 6.7 | 9.3 |
| 1 | 0.01 | 0.28 | 6.5 | 0.40 | 24.7 | 17.7 | 6.7 | 10.7 |
| 2 | 0.03 | 0.79 | 6.5 | 0.34 | 24.4 | 17.7 | 6.3 | 10.0 |
| 3 | 0.05 | 1.27 | 6.1 | 0.38 | 24.0 | 17.9 | 6.6 | 10.7 |
| 4 | 0.07 | 1.74 | 6.1 | 0.34 | 24.4 | 17.2 | 6.5 | 9.3 |
| 5 | 0.09 | 2.21 | 6.1 | 0.35 | 24.4 | 17.4 | 6.7 | 10.0 |
| 6 | 0.11 | 2.64 | 6.1 | 0.33 | 24.7 | 17.7 | 6.6 | 9.3 |
| 7 | 0.13 | 3.1 | 6.1 | 0.35 | 24.7 | 17.3 | 6.5 | 10.7 |
| 8 | 0.15 | 3.32 | 6.2 | 0.34 | 24.0 | 18.0 | 6.9 | 10.7 |
| 9 | 0.17 | 3.54 | 6.3 | 0.34 | 24.4 | 17.7 | 6.5 | 10.7 |
| LSD(P=0.05) | NS | NS | NS | NS | NS |
NS |
||
These outcome are in conformity with those diagnosed by Furlani et al. (2003) who said that B concentrations in plant parts amplified linearly with the B-added treatments in nutrient solution for all wheat cultivars. Johnson et al. (2005) found that soil B fertilization improved B substance of the grain of lentil (Lens culinaris), chickpea (Cicer arientum) and wheat by a part of two to five, though increasing the yield of chickpea only.
NPK concentration of wheat straw and grains
Table 6 narrates the NPK concentration in wheat straw and grains affected by B. It is evident that NPK concentration in wheat was insignificantly affected by B. P, Ca, K and Mg in leaves (average sample of flag leaves) were within adequate limits based on reports in literature for the plants grown in the field. B treatments did not affect significantly the P, K, Ca and Mg concentrations in leaves of wheat cultivars studied in this project.
External B concentrations did not interfere with the uptake of other nutrients as demonstrated by Yamagishi and Yamamoto (1994) and Furlani et al. (2003). They observed that increasing B concentrations caused no interactions between B and K, Ca and Mg contents in plant DM of soybean cultivars.
Conclusion
Construction of B Adsorption isotherm and computation of fertilizer doses were better fitted to Freundlich model as compared with Langmuir model. Application of fertilizer on the basis of soil solution level of B for various crops and soils may be used and tested in Pakistan. There was no effect of applied B on the vegetative growth i.e. plant height, tillering and total biomass of wheat crop. However, there was a positive effect of fertilizer B on grains per spike. The highest number of grains per spike (164.7) was recorded with the application of 1.74 kg B per hectare. Then it decreased with increase in B rate and the least number of grains per spike (133.7) was counted where 3.32 kg B per hectare was applied. The decrease in number of grains at higher rates was due to toxic effect of B.
Author’s contribution
Both the authors had thoroughly and comprehensively participated in all the activities for this study.
References
Elrashidi, M.A., and G.A. O’Connor. 1982. Boron sorption and desorption in soils. Soil Sci. Soc. Am. J. 46: 27–31. https://doi.org/10.2136/sssaj1982.03615995004600010005x
Furlani, A.M.C., C.P. Carvalho, J.G. de Freitas and M.F. Verdial. 2003. Wheat cultivar tolerance to boron deficiency and toxicity in nutrient solution. Sci. Agric. 60(2): 359-370. https://doi.org/10.1590/S0103-90162003000200022
Hussain, N., M.A. Khan and M.A. Javed. 2005. Effect of foliar application of plant micronutrient mixture on growth and yield of wheat (Triticum aestivum L.). Pak. J. Bio. Sci. 8(8): 1096-1099. https://doi.org/10.3923/pjbs.2005.1096.1099
Johnson, S.E., J.G. Lauren, R.M. Welch, J.M. Duxbury. 2005. A comparison of the effects of micronutrient seed priming and soil fertilization on the mineral nutrition of chickpea (Cicer arietinum), lentil (Lens culinaris), rice (Oryza sativa) and wheat (Triticum aestivum) in Nepal. Exp. Agric. 41(4): 427-448. https://doi.org/10.1017/S0014479705002851
NFDC. 1998. Micronutriments in Agriculture: Pakistan Perspective. NFDC Publication No. 4/98, Islamabad.
Rashid, A., and F. Qayyum 1991. Micronutrients status of Pakistani soils and its role in crop production. Cooperative Program. Final report, 1983-90. Natioal Agriculture Research Center, Islamabad. pp. 84.
Rashid, A. and J. Din. 1992. Differential susceptibility of chickpea cultivars to iron chlorosis grown on calcareous soils of Pakistan. J. Indian Soc. Soil Sci. 40: 488-492.
Rashid, A., S. Muhammad and E. Rafique. 2002. Gynotypic variation in boron uptake and utilization in rice and wheat. In: All aspects of plant and animal boron nutrition (eds. H.E. Goldbach, B. Rerkasem, M.A. Wimmer, P.H. Brown, M. Thellier, R.W. Bell), Kluwer and Plenum Academic Publishers. pp. 305–310. https://doi.org/10.1007/978-1-4615-0607-2_29
Rowel, D.L. 1994. Soil science. Methods and applications. Longman Scientific and Technical, Harlow, Essex, U.K.
Solis, P. and J. Torrent. 1989. Phosphate sorption by calcareous vertisols and inceptisols of Spain. Soil Sci. Soc. Am. J. 53: 456-459. https://doi.org/10.2136/sssaj1989.03615995005300020026x
Soylu, S., A. Topal, B. Sade, N. Akgun, S. Gezgin and M. Babaoglu. 2004. Yield and yield attributes of durum wheat genotypes as affected by boron application in boron-deficient calcareous soils: an evaluation of major Turkish genotypes for boron efficiency. J. Plant Nutr. 27(6): 1077-1106. https://doi.org/10.1081/PLN-120037537
Tsadilas, C.D., G. Argyropoulos and E. Tsadila. 2005. Estimation of external boron requirements and their correlation to soil properties in red Mediterranean soils, 3rd Symp. All Aspects of Plant and Animal Boron Nutrition. Sep. 9-13, 2005. Huazhong Agricultural University, Wuhan, China.
Weiner, J., and L. Fishman. 1994. Competition and allometry in Kochia scoparia. Annal. Bot. 73:263-271.
Yamagishi, M. and Y. Yamamoto. 1994. Effects of boron on nodule development and symbiotic nitrogen-fixation in soyben plants. Soil Sci. Plant Nutr. 40: 265-274. https://doi.org/10.1080/00380768.1994.10413300
To share on other social networks, click on any share button. What are these?


