
The Role of Livelihood Assets’ Endowment in Adoption of Rural Livelihood Strategies: An Intra-Regional Comparison of District Bhimber, AJ&K


Research Article
The Role of Livelihood Assets’ Endowment in Adoption of Rural Livelihood Strategies: An Intra-Regional Comparison of District Bhimber, AJ&K
Faisal Azeem Abbassi1, Atta Ullah2, Muhammad Saim Hashmi1, Khadim Hussain1* and Nasim Akhter1
1Department of Economics, Mirpur University of Science and Technology (MUST), Mirpur, AJ&K, Pakistan; 2Department of Economics, Preston University, Kohat-Islamabad Campus, Islamabad, Pakistan.
Abstract | This study was intended to identify the endowment of livelihood assets and to assess their role in adoption of livelihood strategies in district Bhimber, AJ&K. A basic survey was carried out to collect primary data from 310 households selected through convenient sampling. Endowment of livelihood assets was calculated by constructing asset indices. Asset weights were obtained using Principal Component Analysis (PCA). Assets indices revealed that district has performed best on physical capital (index value 0.63) and human capital (index value 0.59) dimensions. It was found that foreign remittance is the most popular livelihood strategy (29% of households’ main source of income) in the district. Apart from this, livelihood strategies are fairly diverse in different tehsils (sub-divisions) of the district. Results of Multinomial Logit Model demonstrate that human capital has the strongest positive role to enable households to enter into more rewarding livelihood strategies. Study recommends to take appropriate steps to reduce pressure on natural resources, to make further investment in human capital to enable people entering into more rewarding livelihood strategies and to educate households to use remittance money for job creating activities to enhance employment opportunities and to augment household income.
Received | May 10, 2019; Accepted | January 13, 2020; Published | February 20, 2020
*Correspondence | Khadim Hussain, Department of Economics, Mirpur University of Science and Technology (MUST), Mirpur, AJ&K, Pakistan; Email: [email protected]
Citation | Abbassi, F.A., A. Ullah, M.S. Hashmi, K. Hussain and N. Akhter. 2020. The role of livelihood assets’ endowment in adoption of rural livelihood strategies: an intra-regional comparison of district Bhimber, AJ&K. Sarhad Journal of Agriculture, 36(1): 258-271.
DOI | http://dx.doi.org/10.17582/journal.sja/2020/36.1.258.271
Keywords | Livelihood assets, Livelihood strategies, Human capital, Physical capital, PCA
Introduction
Study of living standards and human welfare have shifted emphasis from the usage of uni-dimensional approaches to multi-dimensional approaches. In the beginning, studies used to mainly focus on calories intake, level of income or level of expenditures. Sen’s capability approach was one of the first theories to shift focus from unidimensional measures to multi-dimensional measures. This approach uses the concepts of ‘functionings’ and ‘capabilities’ to measure human wellbeing (Sen, 1999, 1993, 1985). Sen’s capability theory led to the development of Human Development Index (HDI). Using four indicators HDI measures human wellbeing in three dimensions: health, education and access to resources. Then UNDP launched another initiative, Millennium Development Goals (MDGs). This initiative also asked intervening in non-monetary dimensions of wellbeing along with monetary dimensions (Vandemoortele, 2009).
Among many other approaches to measure individuals’ wellbeing; livelihood studies have gained much attention in last couple of decades to understand the determinants of socio-economic status, mostly of the rural people living in developing countries (Davis and Pearce, 2001; Bernstein et al., 2001). Prominent world organizations use livelihood approach to study socio economic status of rural population. These organizations include; World Bank, Department for International Development (DFID), United Nations Development Program (UNDP), CARE Oxfam and FAO (Hussein, 2002). These studies explore role of different type of assets along with institutions in livelihood.
A bulk of literature proves the key role of different assets in households’ adoption of livelihood strategies. In a study Jan et al. (2012) found that increase in human capital reduces chances of being employed in informal sector and ownership of livestock increases chances of being employed in farm sector, in Pakistan. A similar study by Rahut and Scharf (2012), also found important role of livelihood assets in the adoption of non-farm activities in Himalyian region of India. Khan (2007), found that personal characteristics (age, education, ownership of livestock and land and infrastructure availability) and different household assets have important role to play in adoption of different livelihood strategies in rural Pakistan. Démurger el al. (2009) have also found that ownership of land, education and size of household are having substantial effects to adopt off-farm livelihood activities in China.
In another study, Irfan (2013) found that while selecting livelihood strategies in Pakistan household assets and individual characteristics have significant effect. Nasir (2005), found that choice of profession is affected by gender and ownership of livelihood assets. Studying determinants of occupation selection in Colombia, Destré and Henrard (2004), has found different type of household assets are having significant effect while choosing an occupation. Obi et al. (2014) found human capital is having significant effect in choosing among livelihood strategies in Nigeria. In another study Rehman, et al. (2008) found that higher endowment of assets leads to more remunerative livelihood strategies. Thennakoon (2001) found that ownership of assets effects livelihood options available to rural population of Sri Lanka.
Sustainable Livelihoods Framework (SLF) of DFID is most widely used framework in livelihood studies (Lautze and Raven, 2006). So, for present study too, this framework will be used. SLF has been selected for present study because it was made for rural areas and it has extensively been used in studies similar to present one. These studies are; Ansom and Mckay (2010), Zhong et al. (2015), Chowdhury (2015), Erenstein (2011), Tefera et al. (2004), Xu (2015) and Steimann (2005) among others. SLF is explained in next section.
Major hurdle in formation of effective policy framework to combat with the basic issues of livelihoods and sustainability in Azad Jammu and Kashmir (AJ&K) is lack of data. This issue is linked with lack of proper understanding of ground realities and absence of true picture of existing situation for which policy is being devised. Knowing this requires well designed and structured studies of their livelihoods strategies and their endowment of livelihood assets. So, in this purview there is a dire need to design such a basic study that can bring forward the basic issues of the rural livelihood.
Traditional way of studying rural livelihoods strategies is assuming individuals are engaged in agriculture sector and moving toward non-agriculture source of income is thought primarily a coping strategy or risk minimizing strategy (Mwamba, 2013; Seng, 2015). In few cases it is believed that it is done to earn higher non-agriculture income (Shehu and Abubakar, 2015).
AJ&K is an almost entirely a mountainous area. Hence land here is not fit for agriculture purposes. Little agriculture which is done mainly consists on marginalized land tracts. Due to low fertility and uneven land, productivity is extremely low. Agriculture produce doesn’t fulfill the needs of even households themselves. Hence, here main sources of livelihoods are non-agricultural e.g. small scale businesses, daily wage employment and local urban and international remittances. In this situation there is need to adapt different strategy to study livelihood dynamics in AJ&K. This is where the main contribution of the present study lies.
This study is an attempt to find; total endowment of household assets, most popular livelihood strategies and to quantify the role of household assets in adoption of those livelihood strategies in district Bhimber of Azad Jammu and Kashmir (AJ&K). It turned out that district is best endowed with physical and human capital, foreign remittance is the most popular livelihood strategy and adoption of a particular livelihood strategy critically depends upon households’ assets endowment.
Theoretical framework
SLF has been selected as theoretical framework for present study. It is drawn in Figure 1. This framework demonstrates that livelihoods are the result of manifold interaction of different factors that affect people’s choice of livelihood. SLF shows that livelihood strategy adopted and choice of livelihood strategies depends on households’ endowment of livelihood assets in a given structure of institution and vulnerability context.
Source: Sustainable livelihoods framework, DFID, (2000).
On the core of SLF lie assets pentagon. This pentagon divides assets into five types; human capital, social capital, physical capital, financial capital and natural capital. These interlinked five types of capitals are fundamental determinants of livelihood strategies. (DFID, 2000).
Human capital in pentagon includes quantity as well as quality of human capital owned by household. Quantity is normally measured in form of total workers available to household while quality is measured by level of education, skill attained and good health of household members. Household with better quality of human capital can benefit from high paying livelihood strategies (Rakodi, 1999).
Natural capital is the gift of nature. It includes land, forests, biodiversity, wildlife, rivers etc. (Hawken et al., 1999). Without the use of natural capital, no production process whatsoever can ever be carried out.
Physical capital on the other hand consists of manmade products necessary for production of other goods. Bridges, roads, irrigation canals and shelter etc. are examples of physical capital. Better infrastructural facilities enable households to diversify their livelihood strategies and to get engaged in high paying livelihood strategies (Scoones, 2000).
Financial capital may include availability of credit, saving and cash etc. (DFID, 2000). For rural population; presence of financial institutions and livestock are two very important financial assets. Ownership of livestock acts as safety net for rural population and can be used when any adverse shock takes place.
Social capital includes norms and networks of mutual benefit and relationships of trust (Putnam, 1993). It includes networks, family, voluntary associations (Ballet et al., 2007).
Another core term in SLF is, “livelihood strategies”. Livelihood strategies include: productive, reproductive and investment activities (DFID, 2000). Livelihood strategies are activities which households are engaged in for living or survival (Ellis, 2000).
Significance of the study
Azad Jammu and Kashmir is an internationally recognized as a disputed territory, the masses living in this region are supposed to be living under vulnerable conditions physically and socially. This uncertain living situation has forced many households to migrate to different other cities of the country as well. This makes this area an interesting case to study the livelihoods and its determinants because these may be different than the other parts of the country. Numerous studies have been conducted focusing on other parts of Pakistan which address our stated objective (Jan et al., 2012; Israr and Khan, 2010; Israr, 2010; Khan, 2007; Shah et al., 2005) but no such study exists based on livelihood conditions of the people in AJ&K. This is a pioneering study, which utilizes innovative assets pentagon methodology, principal component analysis and multinomial logit model to study livelihood situation and strategies of the people of district Bhimber of AJ&K. This will enable the policy makers to compare this situation with other parts of AJ&K and to better target the local needs and prioritize their development policies. This study would also offer many entry points for future researchers who would intend to study the topics like use of natural resources, vulnerability and resilience, human and social capital in AJ&K.
Table 1: Definition used for different livelihood assets.
| Capital | Variable | Type of Variable | Usage in Literature |
| Natural Capital |
1. Access to Forest Resources: i) Fodder Sources ii) Fuel Wood |
Binary (1=Yes, 0=No) |
Zhong et al. (2015); Israr and Khan (2010) and Steimann (2005) |
| 2. Production from Land |
Binary (1=Yes, 0=No) |
Zhong et al. (2015); Xu et al. (2015); Israr and Khan (2010); Ansoms and Mckay (2010); Steimann (2005) |
|
| 3. Total Trees Owned | Scale | Authors’ own contribution | |
| Physical Capital |
House Structure: i) Quality of Wall ii) Quality of Roof iii) Quality of Floor |
Binary (1=Pakka, 0=Katcha) |
Zhong et al. (2015); Ansoms and Mckay (2010); Steimann (2005); Jakobsen (2012) |
| 2. Type of Latrine | Binary(1=Indoor, 0=Open) | ||
|
3. Household Items: i) Fan ii) Water Motor |
Binary (1=Yes, 0=No) |
||
|
4. Transportation: i) Bicycle ii) Rickshaw iii) Motor Bike |
Binary (1=Yes, 0=No) |
Jakobsen (2012); Ansoms and Mckay (2010) and Steimann (2005) |
|
| 5. Distance to Nearest Market(k.m) | Scale | ||
| Human Capital | 1. Household Size | Scale | |
| 2. Number of Working Members | Scale | ||
| 3. Household Head Education |
Ordinal (0= No Class, 1=Primary Pass, 2=Middle Pass, 3= Matric Pass,4=FA and above) |
||
| 4. Highest Education of any Household Member |
Ordinal (0= No Class, 1=Primary Pass, 2=Middle Pass, 3= Matric Pass, 4=FA and above) |
||
| 5. Age of Household Head (Years) | Scale | ||
| Social Capital | 1. Information Through Media via TV or Radio |
Binary (1=Yes, 0=No) |
|
| 2. Presence of NGO/CBO |
Binary (1=Yes, 0=No) |
||
| Financial Capital | 1. Number of Income Sources | Scale | |
| 2.Total Live Stock Units (TLU) {1 LU= 1 Goat/Sheep ,5 Goats/ Sheeps= 1 Cattle and 10 Goats/ Sheeps =1 buffalo} | Scale | ||
| 3. Poultry Units(1 PU= 1 Hen/Duck) | Scale |
Materials and Methods
Data
Present study was conducted by collecting primary data from 310 households using pre-tested structured questionnaire in field interviews.
Calculating endowment of livelihood assets
To identify the endowment and accessibility of different livelihoods assets; asset indices are made by using different definitions given in literature as presented in Table 1.
We need to devise some way to aggregate assets in each type of capital. Some studies have done simple addition of assets (Case et al., 2004). It is not a very popular approach as in this case all assets get equal weights. Two simple ways to give different weight to different assets are; using prices of assets as their weights (Bollen et al., 2001) and calculating inverse of ratio of households who own an asset to the households who don’t own it (Morris et al., 2000). Other popular ways are using multivariate statistical techniques such as; the use of Principal Component Analysis (PCA) (Labonne et al., 2007; McKenzie, 2005; Filmer and Pritchett, 2001), Factor Analysis (Barrett et al., 2006) and Multiple Correspondence Analysis (MCA). PCA and Factor Analysis though, are based on different mathematical formulations they mostly give similar results (Filmer and Scott, 2008). MCA is believed to be more appropriate to use when variables in model are categorical (Booysen et al., 2005). There are number of other advanced techniques. For example; Multiple Indicator Multiple Cause (MIMIC) (Montgomery and Hewett, 2005), Hierarchical Ordered Probit (DIHOPIT) (Ferguson et al., 2003) and Item Response Theory (Mukherjee, 2006).
PCA has been preferred over all above mentioned techniques in literature to construct asset indices (Labonne et al., 2007; McKenzie, 2005; Filmer and Pritchett, 2001). In the purview of discussions in literature, nature of the data and scope of the study: PCA has been selected for present study.
PCA creates components in such a way that these components are uncorrelated to each other from the variables that are correlated with each other. It is user’s choice to decide the number of components to be used in study. It is believed that first principle measures economic status (Houweling et al., 2003).
Studying most popular livelihood strategies
To explore the most commonly adopted livelihood strategies in district Bhimber; all income sources of households are grouped into five mutually exclusive livelihood strategies as defined in table 2.2. Such grouping of large number of income sources into few broader categories is common in literature (Irfan et al., 2013; Jan et al., 2012; Khan, 2007).
Assessing role of livelihood assets in adopting livelihood strategies
To quantifying the role of livelihood assets in adopting livelihood strategies by households, multinomial logit model is used. Multinomial logit model is widely used to examine the determinants of livelihood strategies (Jan et al., 2012; Nasir, 2005; Amelie and Zimmermann, 2004). Probit Model has also been used in such studies but it is less popular because of computational issues (Greene, 2003).
For each livelihood strategy coefficients θj can be estimated using multinomial logit model as:
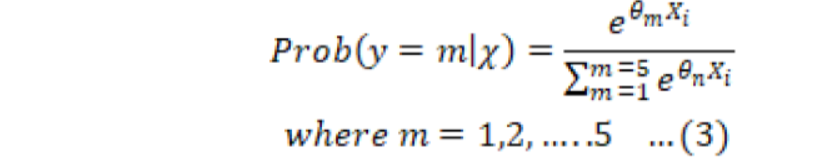
Informal sector’s employment will be used as reference category by setting θ1=0. So, coefficients left θm define change compared to informal sector’s employment. The probabilities will therefore be:

and
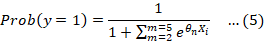
Where;
Prob= Probability of a livelihood strategy; i = Asset indices of households; m = five livelihood strategies; Xi= Vector of exogenous variables which effect decision of entering into a livelihood strategy.
Maximum likelihood method is used to estimate multinomial logit model and above probabilities will enter into the likelihood function (Greene, 2003).
Results and Discussion
Livelihood assets endowment: Descriptive analysis
Descriptive statistics on various dimensions of asset pentagon are presented in Table 3.
Table 3 shows in every Tehsil people have huge dependence on natural capital though degree of dependence in different tehsils is different. These results are in confirmation with the results of Zhong et al. (2015). Khan (2012) and Ansom and Mckay (2010).
Table 2: Definitions of livelihood strategies.
| Sr.No | Livelihood Strategy | Definition |
| 01 | Foreign Remittance | Foreign remittance is the main source of HH income |
| 02 | Business | Self-employment in business and trade is the main source of HH income |
| 03 | Urban Remittance | Remittance from other cities of own country is the main source of HH income |
| 04 | Formal Sector | Private or govt. regulated sector’s employment is the main source of HH income |
| 05 | Informal Sector | Main source of HH income is other than above mentioned four categories |
Where: HH: Household.
Table 3: Summery statistics on various assets.
| Capital | Variable | Tehsil Barnala | Tehsil Bhimber | Tehsil Samahni | Overall District | ||||
| Mean | SD | Mean | SD | Mean | SD | Mean | SD | ||
| Natural Capital |
1. Access to Forest Resources: i) Fodder Sources ii) Fuel Wood |
0.33 0.94 |
0.05 0.02 |
0.31 0.60 |
0.05 0.05 |
0.68 0.97 |
0.04 0.02 |
0.45 0.85 |
0.03 0.02 |
| 2. Production from Land | 0.82 | 0.04 | 0.54 | 0.05 | 0.99 | 0.01 | 0.80 | 0.02 | |
| 3. Total Trees Owned | 14.62 | 1.11 | 6.99 | 1.09 | 15.63 | 0.72 | 12.74 | 0.60 | |
|
Physical |
House Structure: i) Quality of Wall ii) Quality of Roof iii) Quality of Floor |
0.42 0.38 0.55 |
0.05 0.05 0.05 |
0.93 0.88 0.95 |
0.03 0.03 0.02 |
0.70 0.63 0.71 |
0.04 0.05 0.04 |
0.67 0.61 0.72 |
0.03 0.03 0.03 |
| 2. Type of Latrine | 0.64 | 0.05 | 0.98 | 0.02 | 0.96 | 0.02 | 0.85 | 0.02 | |
|
3. Household Items: i) Fan ii) Motor |
0.87 0.17 |
0.03 0.04 |
0.96 0.56 |
0.02 0.05 |
0.97 0.44 |
0.02 0.05 |
0.93 0.38 |
0.01 0.03 |
|
|
4. Transportation: i) Bicycle ii) Rickshaw iii) Motor Bike |
0.15 0.09 0.53 |
0.03 0.03 0.05 |
0.13 0.00 0.53 |
0.04 0.00 0.05 |
0.01 0.00 0.39 |
0.01 0.00 0.05 |
0.09 0.03 0.48 |
0.02 0.01 0.03 |
|
| 5. Distance to Nearest Market(k.m) | 10.90 | 0.56 | 4.40 | 0.43 | 11.67 | 0.59 | 9.27 | 0.36 | |
|
Human |
1. Household Size | 6.69 | 0.19 | 5.89 | 0.19 | 7.04 | 0.30 | 6.58 | 0.14 |
| 2. Number of Working Members | 1.59 | 0.09 | 1.95 | 0.13 | 2.02 | 0.13 | 1.85 | 0.07 | |
| 3. Household Head Education | 1.57 | 0.10 | 2.36 | 0.13 | 1.91 | 0.14 | 1.92 | 0.07 | |
| 4. Highest Education of any Household Member | 2.56 | 0.10 | 3.41 | 0.09 | 2.80 | 0.11 | 2.89 | 0.06 | |
| 5. Age of Household Head (Years) | 45.54 | 1.33 | 50.05 | 1.32 | 48.01 | 1.26 | 47.74 | 0.76 | |
|
Social |
1. Information Through Media via TV or Radio | 0.69 | 0.04 | 0.82 | 0.04 | 0.95 | 0.02 | 0.82 | 0.02 |
| 2. Presence of NGO/CBO | 0.00 | 0.00 | 0.19 | 0.04 | 0.02 | 0.01 | 0.06 | 0.01 | |
|
Financial |
1. Number of Income Sources | 2.59 | 0.10 | 2.41 | 0.12 | 2.51 | 0.07 | 2.51 | 0.06 |
| 2. Total Live Stock Units (TLU) | 11.60 | 0.94 | 10.08 | 1.38 | 14.95 | 1.01 | 12.34 | 0.64 | |
| 3. Poultry Units | 2.74 | 0.30 | 1.69 | 0.35 | 3.03 | 0.38 | 2.54 | 0.20 | |
Note: Author’s own calculations based on Surveyed data.
In total 45 percent of households use forest resources to feed their livestock and 85 percent of them use forest as fuel wood. 80 percent of the households use land for agriculture, mainly for own consumption. This huge dependence on natural resources, particularly on forests, can be unsustainable and must be addressed properly. This can be done by the raising awareness about the possible ill effects of deforestation and at the same time anti deforestation laws must be implemented in letter and spirit.
According to Jakobsen (2012), Erenstein (2011) and Filmer and Pritchett (2001), physical capital is the most important type of capital to determine the socio-economic status. Our findings show households in study area are having good quality of housing. 61% of households own a house having concrete (Pakka) roof, 67% are having concrete (Pakka) walls and 72% of them are having cemented (Pakka) floor. Average distance to nearest market in study area is less than 10 kilometers, which shows good achievement of location capital.
Results on human capital show that average household size in study area is 6.58 persons. This is close to the national average of Pakistan, 6.80 (Rehman et al., 2008).
On social capital front of connectivity to outside world, 82 percent of household’s own televisions. It implies well social, economic and political awareness of households. But performance on the other indicator of social capital is very poor.
On financial capital dimension, results show on the average households in study area have about two and half income sources as depicted in the Table 3 above.
Livelihood assets endowment: Livelihood assets indices
Table 4 shows weights or factor scores for each variable generated through PCA. Indicators of physical capital and human capital got the highest weights. Which means that these are the most important determinants of socio-economic status. Jakobsen (2012), Erenstein (2011) and Filmer and Pritchett (2001) had also found results similar to it.
Distance to market is found to have the lowest weight and that too with negative sign. Which means increase in distance to market lowers socio-economic status of households. It is because closeness to markets broadens income generating opportunities for households as well as it enhances access to different public extension services thereby helping to raise socio-economic status. Since it is common to own motor bike in surveyed households, it has got low weight. Owning of rickshaw was found to have negative weight. Which means owning rickshaw is a sign of poverty. McKenzie (2005) and Houweling et al. (2003) have also found negative weights for some fixed assets.
Factor loadings attained by PCA indicate that all assets included in natural and financial capital carry negative weights. This is because indicators included in both of these capitals are having rural contents and rural households are less well-off compared to households living in towns. Negative weights of natural capital indicators imply poor will hit hard by environmental hazards as they are more dependent on nature.
Table 4: Weights of assets generated through PCA.
| Capital | Variable | Mean |
| Natural capital |
1. Access to Forest Resources: i) Fodder Sources ii) Fuel Wood |
-0.2600 -0.4726 |
| 2. Production from Land | -0.3909 | |
| 3. Total Trees Owned | -0.2550 | |
| Physical capital |
House Structure: i) Quality of Wall ii) Quality of Roof iii) Quality of Floor |
0.8172 0.8188 0.7329 |
| 2. Type of Latrine | 0.5143 | |
|
3. Household Items: i) Fan ii) Motor |
0.1063 0.4730 |
|
|
4. Transportation: i) Bicycle ii) Rickshaw iii) Motor Bike |
0.1605 -0.0946 0.2304 |
|
| 5. Distance to Nearest Market(K.M) | -0.5665 | |
| Human capital | 1. Household Size | -0.1715 |
| 2. Number of Working Members | 0.1057 | |
| 3. Household Head Education | 0.5219 | |
| 4. Highest Education of any Household Member | 0.5880 | |
| 5. Age of Household Head (Years) | 0.0003 | |
| Social capital | 1. Information Through Media via TV or Radio | 0.1739 |
| 2. Presence of NGO/CBO | 0.2852 | |
| Financial capital | 1. Number of Income Sources | -0.1698 |
| 2. Total Live Stock Units (TLU) | -0.2998 | |
| 3. Poultry Units | -0.2101 |
Source: Authors’ own calculation from survey data.
Figure 2 is drawn to make inter tehsil comparison in all dimensions of assets endowment.
It can be seen that tehseel Bhimber has outperformed other two tehsils in the dimensions of Physical capital, Social Capital and Human capital (its pentagon is bulged out than other pentagons on these dimensions). Tehsil Smahni has outperformed other two in Natural and Financial Capital dimensions. While tehsil Barnala has not outperformed other two in any dimension. That is why asset pentagon of Barnala lie inside the other two pentagons.
Samahni is the best endowed tehsil with Natural Capital with a score of 0.44 against the score of 0.40 and 0.21 for Barnala and Bhimber respectively. Bhimber is best endowed with Physical capital with a score of 0.83. Scores of 0.53 and 0.56 of Physical Capital for Barnala and Samahni show that they have almost similar level of physical capital endowment. Tehsil Bhimber has performed better than other two tehsils by a fair margin on human capital dimension as well with the score of 0.69 against 0.52 and 0.57 for Barnala and Samahni respectively. Bhimber has performed best on social capital dimension of asset pentagon as well with the score of 0.43. While Barnala scored least with the score of 0.26. It is primarily because NGOs/CBOs are not working in any tehsil other than Bhimber. On financial capital dimension Samahni has performed best while Bhimber has performed worst. This is because of the fact that livestock is the important indicator of financial capital and Samahni is better able to support it as it is best endowed with natural capital. It can use forest resources as fodder. These results again confirm the primary importance of physical capital in raising the standards of living of rural people. Tehsil Bhimber which hosts district headquarters (thereby having better location capital) is better endowed with other types of livelihood assets as well. It can be deduced from the above findings, that there is need of generous reshuffling of resources across tehsils to make them comparatively better off in their respective deficient areas.
Descriptive analysis of livelihood strategies
This section will present discussion on the most popular livelihood strategies. This is presented in Figure 3.
The extension and contraction of pentagons at different frontiers show the diversity of livelihood strategies adopted by households of study area. Although popularity of different livelihood strategies varies in different tehsils yet foreign remittance remains almost the most popular livelihood strategy in all tehsils. Other than this, livelihood strategies in different tehsils are widely different in their popularity. Business is the most popular livelihood strategy in tehsil Bhimber but the same is least popular in tehsil. Formal sector employment is a very popular livelihood stragtegy in Bhimber where 24.2 percent of households are engaged with. But it is least popular livelihood strategy in Barnala where only 12.7 percent of households are engaged in it. Similarly, informal sector employment is the most popular livelihood strategy in Barnala but it is second least popular livelihood strategy both in Bhimber and Samahni. Urban remittance is one of the most popular livelihood strategy in Samahni while it is least popular livelihood strategy in Bhimber.
Different livelihood strategies earn very different rewards. For example, foreign remittance is a much more rewarding strategy than employment in informal sector. Huge variation in adoption rate of different livelihood strategies in different parts of the study area is the indicative of difference in intra region standards of livings. This finding requires the targeted intervention of policy makers in different regions so as to equalize the living conditions of masses in different regions.
A multinomial logit analysis
This section quantifies the role of livelihood assets in adoption of livelihood strategies by households using Multinomial Logistic Regression. Results of multinomial logistic regression are presented in Tables 5 and 6. Chi-Square results show that model is significant
Foreign remittance
Results of multinomial logit regression in Table 6 show that adoption of foreign remittance compared to informal sector employment is positively and significantly affected by the endowment of human
Table 5: Overall model fitting information and LR test.
| Model | Model Fitting Criteria | Likelihood Ratio Tests | ||
| -2 Log Likelihood | Chi-Square | Df | Sig. | |
| Intercept Only | 972.056 | |||
| Final | 907.073 | 64.982 | 24 | 0.000 |
| Effect | -2 Log likelihood of reduced model | Chi-Square | df | P-Value |
| Intercept | 915.461 | 8.388 | 4 | 0.078 |
| NCI (Natural Capital Index) | 908.971 | 1.897 | 4 | 0.755 |
| PCI (Physical Capital Index) | 913.081 | 6.007 | 4 | 0.199 |
| HCI (Human Capital Index) | 918.546 | 11.473 | 4 | 0.022 |
| SCI (Social Capital Index) | 931.791 | 24.717 | 4 | 0.000 |
| FCI ( Financial Capital Index) | 918.59 | 11.516 | 4 | 0.021 |
| D1 (Dummy for tehsil Bhimber) | 916.263 | 9.19 | 4 | 0.057 |
Source: Authors’ own calculation from survey data.
Table 6: Multinomial logit regression.
| Livelihood Strategy | Variable | Co-efficient Analysis | Odd Ratio Analysis | ||||
| Co-efficent | Std. error | Sig. | Odd ratios | Std. error | Sig. | ||
| Foreign remittance | Intercept | -1.287* | 0.747 | 0.085 | 0.276* | 0.747 | 0.085 |
| NCI | 0.778 | 0.754 | 0.302 | 2.177 | 0.754 | 0.302 | |
| PCI | -0.837 | 0.872 | 0.337 | 0.433 | 0.872 | 0.337 | |
| HCI | 2.351** | 0.962 | 0.014 | 10.501** | 0.962 | 0.014 | |
| SCI | 1.886** | 1.027 | 0.066 | 6.591** | 1.027 | 0.066 | |
| FCI | -0.356 | 0.661 | 0.590 | 0.701 | 0.661 | 0.590 | |
| D1 | -0.122 | 0.477 | 0.798 | 0.885 | 0.477 | 0.798 | |
| Business | Intercept | -2.523** | 0.925 | 0.006 | 0.08** | 0.925 | 0.006 |
| NCI | 0.033 | 0.893 | 0.970 | 1.034 | 0.893 | 0.970 | |
| PCI | -0.701 | 1.02 | 0.492 | 0.496 | 1.02 | 0.492 | |
| HCI | 1.333 | 1.096 | 0.224 | 3.791 | 1.096 | 0.224 | |
| SCI | 4.597*** | 1.228 | 0.000 | 99.166*** | 1.228 | 0.000 | |
| FCI | 0.609 | 0.724 | 0.401 | 1.838 | 0.724 | 0.401 | |
| D1 | 0.367 | 0.542 | 0.499 | 1.443 | 0.542 | 0.499 | |
| Urban remittance | Intercept | -1.713* | 0.975 | 0.079 | 0.18* | 0.975 | 0.079 |
| NCI | 0.888 | 1.033 | 0.390 | 2.429 | 1.033 | 0.390 | |
| PCI | -2.365** | 1.098 | 0.031 | 0.094** | 1.098 | 0.031 | |
| HCI | 2.658** | 1.213 | 0.028 | 14.271** | 1.213 | 0.028 | |
| SCI | 4.688* | 1.486 | 0.002 | 108.631*** | 1.486 | 0.002 | |
| FCI | -2.473** | 1.043 | 0.018 | 0.084** | 1.043 | 0.018 | |
| D1 | -1.441* | 0.781 | 0.065 | 0.237** | 0.781 | 0.065 | |
| Formal sector | Intercept | -1.275 | 0.833 | 0.126 | 0.279 | 0.833 | 0.126 |
| NCI | 0.717 | 0.839 | 0.392 | 2.049 | 0.839 | 0.392 | |
| PCI | -1.726* | 0.983 | 0.079 | 0.178* | 0.983 | 0.079 | |
| HCI | 3.273*** | 1.099 | 0.003 | 26.381*** | 1.099 | 0.003 | |
| SCI | 0.593 | 1.099 | 0.589 | 1.81 | 1.099 | 0.589 | |
| FCI | -1.125 | 0.769 | 0.144 | 0.325 | 0.769 | 0.144 | |
| D1 | 0.59 | 0.519 | 0.256 | 1.803 | 0.519 | 0.256 | |
Source: Authors’ own calculation from survey data; Informal sector is reference category Pseudo R-Square: Cox and Snell, 0.189; Nagelkerke, 0.19
and social capital. Analysis of odds ratios show that compared to adopting informal sector employment odds for going abroad for work increase about ten and half times with a unit increase in human capital index. Odds for going abroad for work compared to adopting informal sector employment also increase by six and half times with a unit increase in social capital index.
It means that increase in human capital and social capital helps households to adopt more rewarding foreign remittance as livelihood strategy compared to less rewarding informal sector’s employment. This result stresses the need of human capital buildup as well as development of social connections and presence of NGOs and CBOs. Because this takes individuals out from low paid informal sector and enables them to pursue job abroad with better earnings. Our earlier results indicated although district has performed comparatively well on human capital dimension but both tehsil Samahni and Barnala lag behind the district average. Hence human capital build-up must have particular focus in these two tehsils.
Business
Results of multinomial regression show that while deciding between adopting informal sector employment as livelihood strategy and establishing own business only social capital among the capital pentagon plays significant role. Odds of adopting business compared to the adoption of informal sector employment as livelihood strategy increase by ninety-nine times with a unit increase in social capital. Such a huge impact of social capital on adoption of business would probably be because it is tehsil Bhimber which has highest level of social capital (largely because of presence of NGOs/CBOs) and business is most popular livelihood strategy in tehsil Bhimber. Bhimber being a town, gives residents of this tehsil ample opportunities to set up their own business compared to getting engaged in low earning informal sector employment.
Urban remittance
Regarding adoption of urban remittance compared to the adoption of informal sector employment multinomial regression results suggest that physical capital has negative impact. It means households having better physical capital prefer to get engaged in low paid informal sector employment instead of leaving their houses and going to other cities for the job. And those who are less endowed with physical capital are forced to go out to other cities for work. Human capital plays positive role to adopt urban remittance as livelihood strategy compared to informal sector employment. Odds of adopting urban remittance as livelihood strategy compared to informal sector employment increases by fourteen times with a unit increase in human capital. Hence, here again, it is found that human capital plays positive role in lifting up socio-economic status of household by enabling them to adopt more remunerative livelihood strategy compared with less remunerative informal sector employment. Irfan et al., (2013), Jan et al. (2012), Nasir (2005) and Parida and Madheswaran (2011), also found positive impact of human capital on the adoption of urban remittance. Social capital too has positive impact on adoption of urban remittance compared to informal sector employment. Chances of adoption of urban remittance as compared to employment in informal sector as a livelihood strategy decreases with increase in financial capital. Odds of adopting urban remittance compared to informal sector’s employment reduced by almost ninety-two percent with a unit increase in financial capital. It is because financial capital mainly includes livestock and rearing of livestock requires staying near homes as their looking after becomes difficult when household members would migrate to cities. Hence, chances of adopting urban remittance reduce with increase in financial capital.
Being resident of tehsil Bhimber negatively effects adoption of urban remittance as livelihood strategy compared with informal sector employment as indicated by co-efficient of dummy for Bhimber. It is probably because Bhimber, being district head quarter, creates more employment opportunities for its residents hence few people of this tehsil migrate to other cities for work.
This indicates that lack of livelihood assets acts as push factor for households to migrate to cities for employment. So, in order to reduce the rate of urbanization too (which is putting huge pressure on civic facilities in cities) enhancement of rural livelihood assets is required.
Formal sector employment
While choosing between formal sector’s employment and informal sector’s employment only physical and human capital were found to have significant effect. This result was expected because education serves as a pre-requisite for entering in both public and private sector formal jobs. Similar results have been found by Prasad et al. (2013), Irfan et al. (2013), Jan et al. (2012), Ansoms and Mckay (2010) and Nasir (2005). Yet again we have found the life transformative role of human capital for the rural households in the sense that it enables households moving out to stable formal sector employment from low paid informal sector’s employment.
Conclusions and Recommendations
This study have utilized DFID framework to study the endowment of livelihood assets, these assets were divided into five categories (natural capital, physical capital, human capital, social capital and financial capital), known as capital pentagon. To study the most popular livelihood strategies, five categories of livelihood strategies were made. And role of livelihood assets in adoption of different livelihood strategies was assessed using multinomial logit model.
We conclude that asset endowment in abnormal conditions (living in border areas where frequent firing incidences took place and uncertainty prevails) has best performed on the dimensions of physical and human capital and it has poorly performed on social capital dimension.
Furthermore, it is found that foreign remittance is most frequently adopted livelihood strategy under uncertainty and abnormal conditions. It is almost equally popular in all tehsils. Other than this, adoption of livelihood strategies is quite diverse in different tehsils.
Another conclusion drawn from study is that natural capital doesn’t play significant role in adoption of any livelihood strategy in study area while human capital plays significantly positive role in adoption of any livelihood strategy compared to informal sectors’ employment. This is because natural capital is primarily concerned with agriculture and study area was non-agricultural and result on human capital is in confirmation with human capital theory which predicts positive impact of human capital on earning.
Based on the results of the study following policy suggestions are being made;
- • Huge money remitted from abroad is mainly being used for consumption purposes and in building big houses. There is need to devise policies which may encourage households to invest this money in other productive activities. This will not only enhance household income but will also reduce unemployment rate in the region.
- • Human capital has been found to positive affect households to shift from low rewarding informal sector employment to more rewarding livelihood strategies. So, investment in human capital be increased. Particularly, job skills improvement programs should be introduced in rural areas to enable poor to participate in economically more rewarding activities.
Novelty Statement
Azad Jammu and Kashmir is an internationally recognized as a disputed territory, this makes this area an interesting case to study the livelihoods and its determinants because these may be different than the other parts of the country.
Author’s Contribution
FAA conceived the idea of the study, reviewed the relevant literature, collected and analysed the data, designed the research and prepared the first draft. AU contributed through providing critical and analytical discussion of empirical results and overall supervision of the study. MSH contributed through collection, compilation and insight analysis of data. Spearheaded the research endeavor with his insightful vision. KH contributed through conceptualizing, developing the framework, materializing the concept into a researchable issue, reviewing the manuscript critically and editing it technically. NA helped in data collection and compilation. Supported in literature review and proofreading the manuscript.
References
Amelie, C., and K.F. Zimmermann. 2004. Occupational choice across generations. Dis., Ger. Inst. Econ. Res., Berlin, Ger. Pap. No. 395.
Ansom, A., and A. Mckay. 2010. A quantitative analysis of poverty and livelihood profiles: The case of rural Rwanda. Elsevier, Food Policy, 35(6): 584–598. https://doi.org/10.1016/j.foodpol.2010.06.006
Ballet, J., N. Sirven and D.M. Requires. 2007. Social capital and natural resource management: A critical perspective. J. Environ. Dev., 16(4): 355-374. https://doi.org/10.1177/1070496507310740
Barrett, C.B., P.P. Marenya, J. McPeak, B. Minten, F. Murithi, K.W. Oluoch, F. Place, J.C. Randrianarisoa, J. Rasambainarivo and J. Wangila. 2006. Welfare dynamics in rural Kenya and Madagascar. J. Dev. Stud., 42(2): 248–277. https://doi.org/10.1080/00220380500405394
Bernstein, E., A.A. Caudy, S.M. Hammond and G.J. Hannon. 2001. Role for a bidentate ribonuclease in the initiation step of RNA interference. Nat., 409(6818): 363–366. https://doi.org/10.1038/35053110
Bollen, K.A., J.L. Glanville and G. Stecklov. 2001. Socioeconomic status and class in studies of fertility and health in developing countries. Ann. Rev. Soc., 27: 153-185. https://doi.org/10.1146/annurev.soc.27.1.153
Booysen, F., S. Berg, D., Van, R. Burger, M. Maltitz, Von and G.D. Rand. 2005. Using an asset index to assess trends in poverty in seven sub-saharan African countries. Conf. Multidimension. Poverty, Int. Poverty Centre U. N. Dev. Progr. (UNDP), August, Brasilia, Brazil. pp. 29-31.
Case, Anne, P. Christina and A. Joseph. 2004. Orphans in Africa: Parental death, poverty, and school enrollment. Demography, 41(3): 483-508. https://doi.org/10.1353/dem.2004.0019
Chowdhury, T.A., 2015. Development of a multidimensional sustainable livelihoods model for rural Bangladesh. J. Dev. Areas, 49 (Special Issue): 153-168. https://doi.org/10.1353/jda.2015.0052
Davis, R. Jr. and D. Pearce. 2001. The non-agricultural rural sector in central and eastern Europe. Nat. Res. Inst. Rep. No. 2630.
Démurger, S., M. Fournier and W. Yang. 2009. Rural households’ decisions towards income diversification: Evidence from a township in northern China. Working Paper no. 923, Groupe d’Analyse Et De Théorie Economique (GATE), Centre National De La Recherche Scientifique (CNRS), Université Lyon 2, Ecole Normale Supérieure, France. https://doi.org/10.2139/ssrn.1517783
Destré, G., and V. Henrard. 2004. The determinants of occupational choice in Colombia: An empirical analysis. Working Paper Bla04065a, Cahiers De La Maison Des Sciences Economiques, Université Panthéon-Sorbonne, France.
DFID. 2000. Sustainable livelihoods guidance sheets. Dep. Int. Dev., London, UK.
Ellis, F., 2000. Rural livelihoods and diversity in developing countries. Oxford: Oxf. Univ. press, viewed 15 May 2016, from http://libserv5.tut.ac.za:7780/pls/eres/wpg_docload.download_file?pfilename=F1559246066/MohamedSS.pdf
Erenstein, O., 2011. Livelihood assets as a multidimensional inverse proxy for poverty: A district-level analysis of the Indian indo-gangetic plains. J. Hum. Dev. Capabilities, 12(2): 283-302. https://doi.org/10.1080/19452829.2011.571094
Ferguson, B.D., A. Tandon, E. Gakidou and C.J.L. Murray. 2003. Estimating perma-nent income using indicator variables in health system performance assessment: Debates, methods and empiricism. Murray, C, J,L,. and Evans, D, B., eds. WHO, Geneva.
Filmer, D., and L. Pritchett. 2001. Estimating wealth effects without expenditure data or tears. Appl. Educ. Enrollments States India. Demography, 38(1):115-132. https://doi.org/10.2307/3088292
Filmer, D., and K. Scott. 2008. Assessing assets indices. Policy research working paper no 4605, The World Bank Development Research Group, Human Development and Public Services Team. https://doi.org/10.1596/1813-9450-4605
Greene, W.H., 2003. Econometric analysis, 5th ed. Prentice Hall, USA.
Hawken, P., A. Lovins and H. Lovins. 1999. Natural capitalism: Creating the next industrial revolution. Little, brown and company, U. S.
Houweling, T.A.J., A.E. Kunst and J.P. Mackenbach. 2003. Measuring health inequality among children in developing countries: Does the choice of the indicator of economic status matter? Int. J. Equity Health, 2(1): 8. https://doi.org/10.1186/1475-9276-2-8
Hussein, K., 2002. Livelihoods approaches compared: A multi-agency review of current practice. Dep. Int. Dev. Overseas Dev. Inst., London.
Irfan, M., S. Anwar, W. Akram, S. Ramzan and I. Waqar. 2013. Determinants of occupational choice among four provinces of the Pakistan. Int. J. Econ., Finance Manage., 6(2): 403-413.
Israr, M., 2010. Determinants of rural household income for livelihood in northern-Pakistan. Ph. D dissertation, Khyber Pukhtunkhwa Agric. Univ., Peshawar, Pkaistan.
Israr, M., and H. Khan. 2010. An analysis of livelihood sources in hilly areas of northern Pakistan. Sarhad J. Agric., 26(4): 665-672.
Jakobsen, K., 2012. Livelihood asset maps: A multidimensional approach to measuring risk-management capacity and adaptation policy targeting a case study in Bhutan. Reg. Environ. Change, 13(2): 219-233. https://doi.org/10.1007/s10113-012-0320-7
Jan,I., M.K. Khattak, M.A. Khan, S. Hayat and T. Rahim. 2012. Factors affecting rural livelihood choices in northwest Pakistan. Sarhad J. Agric., 28(4): 681-688.
Khan, M.A., 2007. Factors affecting employment choices in ruran northwest Pakistan. Conf. Int. Agric. Res. Dev., October 9-11,2007, Tropentag, Univ. Kassel-Witzenhausen Univ. Gottingen.
Khan, R.S., 2012. Linking conservation with sustainable mountain livelihoods: A case study of northern Pakistan. Doctoral thesis, Clayton H. Riddell Fac. Environ., Earth Resour. Nat. Resour. Inst. Univ. Manitoba.
Labonne, J., D. Biller and R. Chase. 2007. Inequality and relative wealth: Do they matter for trust? Evid. Poor Communities Philippines. Soc. Dev. Pap., Community Driven Dev., Paper No 103, The World Bank, 2007.
Lamichhane, K., 2010. Sustainable livelihood approach in assessment of vulnerability to the impacts of climate change: A study of chhekampar vdc, gorkha district of Nepal. Bachelor thesis Submitted Kathmandu Univ. Center Dev. Stud. Nat. Coll., Baluwatar, Kathmandu, Nepal.
Lautze, S. and A. Raven. 2006. Violence and complex humanitarian emergencies: Implications for livelihoods models. Disasters, 30(4): 383-401. https://doi.org/10.1111/j.0361-3666.2006.00328.x
Mckenzie, D.J., 2005. Measuring inequality with asset indicators. J. Popul. Econ., 18(2): 229-260. https://doi.org/10.1007/s00148-005-0224-7
Montgomery, M., and C.H. Paul. 2005. Urban poverty and health in developing countries: Household and neighborhood effects. Demography, 42(3): 397-425. https://doi.org/10.1353/dem.2005.0020
Morris, S.S., C. Carletto, J. Hoddinott and L.J.M. Christiaensen. 2000. Validity of rapid estimates of household wealth and income for health surveys in rural Africa. J. Epidemiol. Commun. Health. 54(5): 381-387. https://doi.org/10.1136/jech.54.5.381
Mukherjee, S., 2006. On asset indices. Draft, Princeton Univ., Princeton, NJ.
Mwamba, O.L., 2013. Vulnerability and adaptability: Modelling the adaptive capacity of rural households to environmental changes.”PhD diss., Unpublished.
Nasir, Z.M., 2005. An analysis of occupational choice in Pakistan: A multinomial approach. Pak. Dev. Rev., 44(1): 57–79. https://doi.org/10.30541/v44i1pp.57-79
Obi, I., and M. Njoku. 2014. Socio-economic factors affecting choice of livelihood activities among rural dwellers in southeast Nigeria. J. Agric. Vet. Sci. (IOSR-JAVS), 7(4): 52-56. https://doi.org/10.9790/2380-07415256
Parida, J.K. and S. Madheswaran. 2011. Determinants of migration and remittance in India: Empirical evidence. Working paper 272, Inst. Soc. Econ. Change, Bangalore.
Prasad, B.C., H. Chen and B. Singh. 2013. An analysis of employment prospects in Fiji’s urban area. J. Pac. Stud., 33(2): 30-47.
Putnam, R.D., 1993. What makes Democracy Work? Nat. Civic Rev., 82(2): 101-107. https://doi.org/10.1002/ncr.4100820204
Rahut, D.B., and M.M. Scharf. 2012. Livelihood diversification strategies in the Himalayas. Aust. J. Agric. Resour. Econ., 56(4): 558–582. https://doi.org/10.1111/j.1467-8489.2012.00596.x
Rakodi, C., 1999. A capital assets framework for analyzing household livelihood strategies. Dev. Policy Rev., 17(3): 315-342. https://doi.org/10.1111/1467-7679.00090
Rehman, M., Jehanzeb and M.F. Rana. 2008. Livelihood strategies of different categories of households in rural areas of Abbottabad, Pakistan. Sarhad J. Agric., 24(4): 685-692.
Scoones, C., 2000. Rural livelihoods and diversity in developing countries. New York: Frank Allis.
Sen, A., 1985. Commodities and capabilities. Amsterdam, North-Holland.
Sen, A., 1993. Capability and Well-being. In: Nussbaum, M. C. and Sen, A. K. (eds.). The Quality of Life. Oxford, Clarendon Press. https://doi.org/10.1093/0198287976.003.0003
Sen, A., 1999. Development as freedom, Oxford, Oxford University Press.
Seng, K., 2015. The effects of nonfarm activities on farm households’ food consumption in rural Cambodia. Dev. Stud. Res. 2(1): 77–89. https://doi.org/10.1080/21665095.2015.1098554
Shah, H., A.M. Khan, N. Akmal and M. Sharif. 2005. Livelihood assets and livelihood strategies of small farmers in salt range: A case study of Pind Dadan Khan District Jhelum, Pakistan. Pak. J. Agric. Sci., 42(1-2): 82-88.
Shehu, A., and N. Abubakar. 2015. Determinants of participation of farm households in non-farm enterprise activities in rural Nigeria. Int. J. Econ., Commerce Manage. 3(6): 57–71.
Steimann, B., 2005. Livelihood strategies in north-west Pakistan. IP6 Working Paper No. 5, Development Study Group, Department of Geography, University of Zurich, Winterthurerstr. 190, CH-8057 Zurich, Switzerland and Sustainable Development Policy Institute, # 3, UN Boulevard, Diplomatic Enclave 1, G-5, Islamabad, Pakistan.
Tefera, T.L., S. Perret and J.F. Kirsten. 2004. Diversity in livelihoods and farmers’ strategies in the hararghe highlands, eastern Ethiopia. Int. J. Agric. Sustainability, 2(2): 133-146. https://doi.org/10.1080/14735903.2004.9684573
Thennakoon, S., 2001. Rural livelihood strategies and the five capitals: A comparative study in the selected villages of Sri Lanka. www.sasnet.lu.se.
Vandemoortele, J., 2009. The mdg conundrum: meeting the targets without missing the point. Dev. Policy Rev., 27(4): 355–371. https://doi.org/10.1111/j.1467-7679.2009.00451.x
Xu, D., J. Zhang, G. Rasul, S. Liu, F. Xie, M. Cao and E. Liu. 2015. Household livelihood strategies and dependence on agriculture in the mountainous settlements in the three gorges reservoir area, China. Sustainability, 7: 4850-4869. https://doi.org/10.3390/su7054850
Zhong, L., M. Blaxland and T. Zuo. 2015. Without rice, even the cleverest housewife cannot cook: sustainable livelihoods research in a poor chinese village. Asian Soc. Work Policy Rev., 9(1): 3-17. https://doi.org/10.1111/aswp.12046
To share on other social networks, click on any share button. What are these?


