
Supply Response of Basmati Rice in Pakistan


Research Article
Supply Response of Basmati Rice in Pakistan
Muhammad Azam Niazi1* and Umar Farooq2
1PARC Institute of Advanced Studies in Agriculture, National Agricultural Research Centre, Islamabad, Pakistan; 2PARC Institute of Advanced Studies in Agriculture, National Agricultural Research Centre, Islamabad, Pakistan.
Abstract | The knowledge of responsiveness of the Basmati farmers to various stimuli is important for the policy makers to plan resource allocation and output of Basmati rice. Supply response analysis was carried out to quantify the response of farmers to price and non-price factors. Most of the literature on supply response of crops in Pakistan has relied on the assumption that the data series used for analyses were stationary while most of time series are in fact trended. This makes the results of many earlier studies unreliable. This study uses the modern time series approach of cointegration using Autoregressive Distributed Lag bounds testing. The bounds testing showed existence of a long run relationship between Basmati rice production and the regressors used in the study. The Basmati rice production showed a positive association with its own price. The response to fertilizer price was negative as per expectations. Tubewell availability had a positive effect on Basmati production. The Basmati rice had a speed of adjustment of 42 per cent showing that any deviation from the equilibrium would be corrected by 42 per cent in the current period. It is suggested that as Basmati rice supply reacts positively to an increase in its own price, its price stability should be ensured to have a consistent supply. The price of fertilizer (DAP) needs to be kept in check by keeping an eye on hoarding and black marketing. Mechanization can improve Basmati production and encouraging tubewells where ground water table allows sustainable use, should be encouraged to ensure timely water availability.
Received | November 22, 2018; Accepted | October 20, 2019; Published | November 16, 2019
*Correspondence | Muhammad Azam Niazi, PARC Institute of Advanced Studies in Agriculture, National Agricultural Research Centre, Islamabad, Pakistan; Email: mazamniazi@gmail.com
Citation | Niazi, M.A. and U. Farooq. 2019. Supply response of basmati rice in Pakistan. Sarhad Journal of Agriculture, 35(4): 1192-1197.
DOI | http://dx.doi.org/10.17582/journal.sja/2019/35.4.1192.1197
Keywords | Supply, Response, Bsmati, Rice, Pakistan, ARDL
Introduction
Supply response in agriculture refers to the changes in agricultural output mainly resulting from variations in price and non-price factors. In essence, supply response concerns response of output to a change in the product’s price. This can be a result of the extent of use of resources which itself could be a resultant of price variation. Supply response is a dynamic relationship and involves the role of supply shifters as well while supply function depicts a stationary relationship. Some researchers bifurcate production into acreage and yield and hence work on two different supply response models (Mushtaq and Dawson, 2003). Production variables might also affect supply response and hence supply response is influenced by factors moving the supply curve (Akanni and Okeowo, 2011). The responsiveness to prices can change over time as new non-price factors might intervene (Mushtaq, 2000).
Supply response of crops is considered as one of the most important issues in agricultural production economics as the responsiveness of farmers to economic incentive determines agriculture’s contribution to the economy where the sector is the largest employer of labour (Mushtaq and Dawson, 2003). When prices are considered such a strong policy tool, knowledge about its efficacy is naturally an important avenue to be measured. Price policy can be both through support to, output prices or input prices, affecting how farmers adjust their area under a particular crop. The availability of supply elasticities at hand is a blessing for a policy maker planning to develop a evidence-based policy. A prior idea of how the farmers would tend to respond to the planned change in support price is a key to making such decisions. This information provides an important insight to the farmers’ responsiveness to any natural or induced changes in prices of input and/or output prices. Supply response estimates are fundamental to the understanding of price mechanisms. Knowledge of the impact of other non-price variables on the response of production is similarly important for policy makers. Key variables in the analysis of supply response of crops include, own prices, prices of the competing crops, prices of complementary crops, input prices, changes in technology, weather, infrastructure. Chaudhary et al. (1998) stressed that farmers are price-responsive and a fair output and input prices are vital for maintaining farmers’ incentive to go for higher production. The Nerlovian framework (Nerlove, 1958) is the base of much of the theoretical framework in the supply response studies.
Rice follows second to wheat as staple food of Pakistan. Sown from June and harvested in November rice is a Kharif season crop. It is used both as cooked rice and as bread, especially in the Sindh province of Pakistan. It is an important component of Pakistan’s agricultural export list. Pakistan mainly has two important types of rice, the aromatic Basmati and the non-aromatic coarse IRRI type varieties. Pakistan’s Basmati has a special aroma that has no parallel in the world. It contribution is 3.1 percent in agricultural value added and 0.6 percent of total GDP. IRRI is a short duration (harvested about 30 days earlier) high yielding rice while Basmati is a comparatively long duration and lower yielding rice that is mainly concentrated in the Province of Punjab while IRRI is concentrated mainly in Sindh but there is some overlap of area especially in Punjab. Many studies have found both rice to compete for area (Mushtaq and Dawson, 2002; Hussain et al., 2005; Nosheen et al., 2011).
This paper aims to study the supply response of Basmati rice in Pakistan and suggest policy measures to increase Basmati rice production given, its role in Pakistan’s food security and as a foreign exchange earner.
Materials and Methods
The study covers all Pakistan. Annual data has been used for the period 1970-2015. Data were limited to 2015 as data on some variables were not published after 2015 which restricted the period on variables. Data were obtained mainly from the publications of the Government of Pakistan.
This study uses the Autoregressive Distributed Lag Model (ARDL) bounds testing approach coupled with the error correction approach. The first step in any time series analysis is to test for the presence of unit roots among the data series. The earlier approaches required variables to be have the same order of integration while the Bounds testing approach overcomes this shortcoming of previous approaches including the possibility to include variables that are integrated of a mix of I(0) and I(1) variables however the variables must not be I(2). Cointegration is checked using the ARDL bounds testing approach developed by (Pesaran et al., 2001). Error correction model framework is used which takes into account “the dynamics of short-run adjustment towards long-run equilibrium in a theoretically consistent manner” (Albayrak, 1997).
Basmati rice production is assumed to be a function of its own price, price of IRRI rice, availability of tubewells, price of fertilizer and the price of potato as Basmati has been gaining roots in the potato area and competition can be there with potato.
Augmented Dickey and Fuller test was used to check for stationarity. The lag lengths were determined by Schwartz Bayesian Criterion (SBC)
The model
Basmati rice production is assumed to be a function of its own price, price of IRRI rice, availability of tube wells, price of fertilizer and the price of potato, as Basmati rice overlapp at certain areas in the Punjab province of Pakistan. Past studies have quite consistently included IRRI rice as the competing crop (Muhammad, 2005; Yousaf et al., 2016).
BP= f (BPR, IPR, TW, FPR, PPR) …..1
Where;
BP= Ln of Basmati rice production; BPR= Ln of Basmati rice price; IPR= Ln of IRRI price; TW=Ln of number of tubewells; FPR= Ln of fertilizer price; PPR= Ln of potato price.
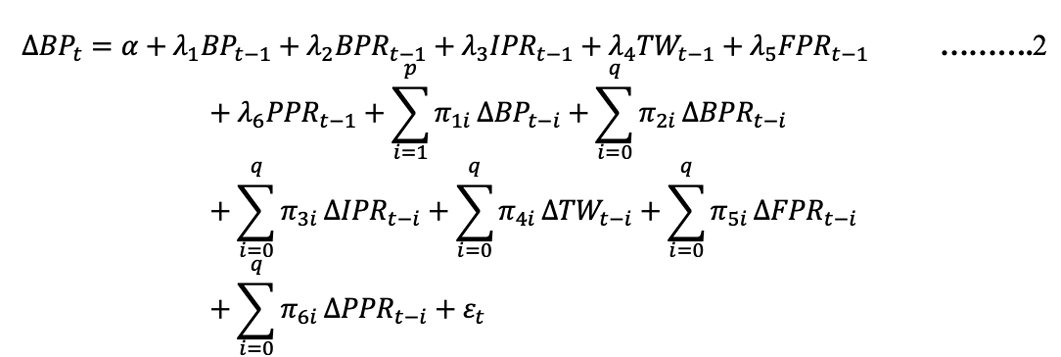
The ARDL model for basmati rice
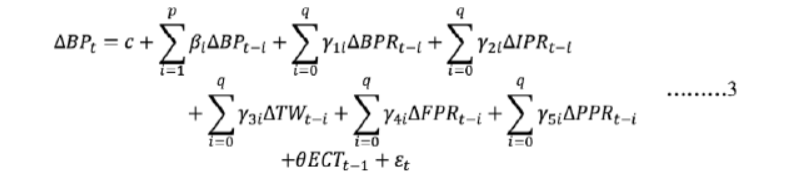
Error correction model for basmati rice
Here ECT is the error correction term.
Results and Discussion
Data series were checked for stationarity using both ADF (Table 1) and PP (Table 2) tests for reliability. The results of unit root tests showed that the variables were a mix of I(1) and I(0). Prices can be seen to be I(0) and it is understandable for prices to fluctuate based on market forces. Other variables are I(1) in agreement with the notion that most economic time series area trended. The results are to a large extent in agreement with previous studies (Mushtaq and Dawson, 2002; Mohammad et al., 2007).
Table 1: Unit root tests using augmented dickey-fuller test.
| At Level | First Difference | ||||
| Constant | Constant & Trend | Constant | Constant & Trend | ||
| Variable | t-Statistic | t-Statistic | Variable | t-Statistic | t-Statistic |
| BP | -0.80 | -2.51 | d(BP) | -6.88 ** | -6.90 ** |
| IPR | -3.74 ** | -3.75 * | d(IPR) | -7.16 ** | -7.06** |
| BPR | -2.83 | -2.87** | d(BPR) | -6.00 ** | -2.71** |
| FPR | -1.31 | -2.85 | d(FR) | -6.58 ** | -6.61** |
| PPR | -1.14 | -2.80 | d(PPR) | -5.55 ** | -5.51** |
| TW | -1.53 | -2.48 | d(TW) | -6.00 ** | -6.04** |
Source: Author’s calculations; Note: Here ‘d’ is the difference operator; The lag length was chosen by SIC criteria; *=significant at 0.05 level; **= significant at 0.01 level.
First differences of all the variable area highly significant at 0.01 level showing that the variables are not I(2) which is a desirable condition for running ARDL model.
Table 2: Unit root tests using Philips-Perron (PP) test.
| Levels | First Differences | ||||
| Constant | Constant & Trend | Constant | Constant & Trend | ||
| Variable | t-Statistic | t-Statistic | Variable | t-Statistic | t-Statistic |
| BP | -0.71 | -2.71 | d(BP) | -7.07 ** | -7.59 ** |
| IPR | -3.76 ** | -3.80 * | d(IPR) | -8.28 ** | -8.05 ** |
| BPR | -2.90 | -2.71 | d(BPR) | -7.31 ** | -7.22 ** |
| FPR | -1.08 | -2.85 | d(FPR) | -8.36 ** | -9.94 ** |
| PPR | -1.11 | -2.94 | d(PPR) | -5.57 ** | -5.53 ** |
| TW | -1.53 | -2.67 | d(TW) | -6.00 ** | -6.04 ** |
Source: Author’s calculations; Note: Here ‘d’ is the difference operator; The lag length was chosen by SIC criteria; *=significant at 0.05 level; **= significant at 0.01 level.
Zivott-Andrews test was conducted to find any structural breaks in the series. The variables were not found to be I(2) and the break point suggested by the test was included in the model through a dummy but was found to be non-significant and did not improve the model.
Lag length was selected using Schwartz Information Criteria (SIC). SIC is well suited for small data series like the one used in this study as it offers a more parsimonious set of lags as compared to other criteria. The final model selected had the following optimal lags: LnBP(1), LnBPR (0), LnTW(0), LnFPR(0), LnIPR(0) and PPR(1).
For the ARDL Bounds test , Narayan tables were used that define I(0) and I(1) bounds for the smaller data series below 80. As this study has a sub 80 sample size these values were of great help. The F-statistic was found to comfortably exceed the I(1) boundary showing that a long run relationship exists (Table 3).
Table 3: ARDL bounds test for basmati rice model (1,0,0,0,0,1).
| Test Statistic | Value | k |
| F-statistic | 5.69** | 5 |
| Critical Value Bounds (Narayan) | ||
| Significance | I(0) Bound | I(1) Bound |
| 10 percent | 2.46 | 3.67 |
| 5 percent | 2.92 | 4.27 |
| 1 percent | 4.03 | 6.00 |
Source: Author’s calculations.
Table 4 shows the long run coefficients for the Basmati rice model. The own price of Basmati rice was significant at 10 percent level and the coefficient wass positive, showing that a 1 percent increase in the price of basmati rice would tend to increase its production by 0.6 per cent. An increase in the number of tubewells also showed to have a positive impact on production of Basmati. A 1 percent increase in the number of tubewells would result in 1.58 percent increase in production of Basmati, the coefficient is highly significant at 1 percent level. Fertilizer price was also highly significant at 5 percent level and showed a negative relationship with Basmati production. A 1 percent increase in the price of fertilizer would result in 0.7 percent drop in the production of Basmati. The competing crops IRRI rice and potato had the expected negative signs but were non-significant.
Table 4: Long-run coefficients for basmati rice model.
| Variable | Coefficient | Std. Error | t-Statistic | Prob. |
| BPR | 0.62 | 0.32 | 1.93 | 0.06 |
| IPR | -0.18 | 0.68 | -0.27 | 0.79 |
| TW | 1.58 | 0.47 | 3.35 | 0.00 |
| FPR | -0.72 | 0.31 | -2.30 | 0.03 |
| PPR | -0.40 | 0.32 | -1.26 | 0.22 |
| Constant | -8.37 | 6.35 | -1.32 | 0.20 |
Source: Author’s calculations.
The results show that the Basmati production in Pakistan is affected by changes in its own price, the price of fertilizer, the irrigation infrastructure/technology variable tubewells. Tubewells, in addition to representing the irrigation technology being introduced over time also add to the water availability which is crucial for anaerobic Basmati rice production where water is kept standing in the field to a depth of a few inches. The two possible competing crops added were IRRI rice and potato. IRRI rice has been used by many researchers as a competing crop of Basmati rice in supply response models for Pakistan (Mushtaq and Dawson, 2002; Hussain et al., 2005; Mahmood et al., 2007; Nosheen et al., 2011; Yousaf et al., 2016). Basmati and IRRI rice do compete with each other in various areas but are mainly concentrated in different areas. Based on the previous literature IRRI rice was included as a competing crop but its coefficient came out to be non-significant. Potato was another important crop in the area where Basmati grows in the Punjab province and almost all of it is grown in the Punjab province of Pakistan (GoP, 2015). The coefficients of both IRRI rice and potato were non-significant which can possibly be attributed to the relatively smaller competing zones under these two crops in the Basmati rice zone.
The positive coefficient of own price is as per expectations. High prices can affect production in two ways viz. increasing area under Basmati and to increase its yield using higher input levels, where these are not up to the desired mark. Price fluctuations in the past are expected to have affected the production levels, on an average there has been an increase in production. Introduction of new varieties also provided an impetus to the crop that helped increasing production over the long run.
The coefficient of the number of tubewells was positive and significant as per expectations. Tubewells provide a buffer to water supply shocks specially at crucial stages of growth of Basmati rice. Basmati is grown in submerged conditions (Bouman, 2018), though dry sowing has been introduced in the region but it is yet to catch up and cannot be expected to have an impact during the sample period. Farmers mostly keep the basmati fields flooded and a few inches of water is kept standing in the fields. This helps in providing anaerobic conditions to the plants as well as aid in controlling weeds. The price of fertilizer is expected to have an inverse relationship with the production of Basmati rice. Basmati requires a considerable doze of fertilizers which contribute to the cost of production. The negative coefficient for fertilizer price was hence as per expectations and in line with the past studies (Junaid et al., 2014). Any effort to reduce the price of fertilizer is expected to increase production of Basmati rice.
The results of Error Correction Model (ECM) are provided in Table 5, the short run results are in line with the long run results. The Error Correction Term (ECT) was found to be highly significant with the expected negative sign and a coefficient of 0.42 shows that any disequilibrium is expected to be corrected by 42 per cent in the first period. The lower speed of adjustment hinted at the slow response of farmers to react to external shocks which could be result of higher cost of adjustment involved, which may be coupled with the fewer options to choose from. Basmati rice is grown in a very special belt with no comparable belt available in the country. The aroma in Basmati produced in this special Punjab belt could not be achieved in any other zone of Pakistan. Keeping in view the premium price received for the aroma of this fine rice variety, it does not seem to have had a serious competition from any other crop during the period under study. As this is a national level study competition in small pockets would perhaps be overshadowed by the overall area.
Table 5: Short-run coefficients for basmati rice model.
| Variable | Coefficient | Std. Error | t-Statistic | Prob. |
| D(BP) | 0.26 | 0.09 | 2.80 | 0.01 |
| D(TW) | 0.67 | 0.19 | 3.46 | 0.00 |
| D(FPR) | -0.30 | 0.13 | -2.36 | 0.02 |
| D(IPR) | -0.08 | 0.28 | -0.27 | 0.79 |
| D(PPR) | 0.33 | 0.25 | 1.34 | 0.19 |
| ECT(-1) | -0.42 | 0.12 | -3.63 | 0.00 |
Source: Author’s calculations.
A series of diagnostics are required to be done on the model to ensure it does not suffer from any violations of the pre-conditions of the model (Table 6). Durbin-Watson statistic is used for testing autocorrelation but it is not suitable in case of autoregressive models where autocorrelation has already been considered (Anyaeji, 2017). This weakness can be overcome by using Breusch-Godfrey Lagrange Multiplier or simply (LM) test that can provide valid results for higher order autoregressive errors for serial correlation to detect presence of any serial correlation in the model. Breusch-Pagan-Godfrey test for heteroskedasticity was done to check if there existed any signs of heteroskedasticity. Model specification was tested using Ramsey RESET test. This test makes an assessment for incorrect functional forms. Test for normality was done using the Jarque-Bera test. All the tests cleared the model of any problem tested for.
Table 6: Diagnostic tests for validating model.
| Test | Test Statistic | p-value |
|
Breusch-Pagan (χ²) |
0.43 | 0.81 |
| Ramsey RESET | 1.12 | 0.30 |
|
Jarque-Bera (χ²) |
1.56 | 0.46 |
|
Breusch-Pagan-Godfrey (χ²) |
6.76 | 0.46 |
Source: Author’s calculations.
The cumulative sum (CUSUM) tests for parameter stability are done to see whether the recursive residual moves away from the mean of zero or not. Five percent significance bars were plotted and the recursive residuals were supposed to stay within these lines (Figure 1).
The cumulative CUMSQ was supposed to be a stronger test demonstrating impact of any shocks in data which eventually show up as instabilities within the recursive residuals (Figure 2). The model was stable in the long run as both the CUSUM and CUMSQ plots stayed within the five percent lines.
Conclusions and Recommendations
Basmati rice is one of the major crops of Pakistan, both for food security as well as a foreign exchange earner. Policies are normally used as a tool by governments to direct the production and allocation of resources in the economy. This study aimed at studying the factors that affect Basmati rice production and to quantify the extent of their contribution.
It is concluded that the price of Basmati rice has a positive relationship with Basmati production. Fertilizer price negatively affected basmati supply while the availability of tube wells improved Basmati production.
The following suggestions are put forward based on the results obtained in this study. It is suggested that in order to increase the supply of Basmati rice, its own price needs to be stabilised, for the farmers to keep investing and increase basmati production in future. This could be achieved through a combination of improved market efficiency, international market intelligence and introduction of crop insurance. The price of fertilizer needs to be reduced through ensuring a check on non-occurrence of black marketing and further ensuring transmission of fertilizer subsidies to the farmers, this would be a step towards increased profitability of the crop and hence encourage production through optimal input application. Technology can improve productivity and profitability, these can include introduction of high yielding disease resistant Basmati varieties and mechanization, tubewell availability may be improved in areas where the water table makes it technically and environmentally feasible, following sustainable agriculture approach.
Novelty Statement
This study utilized the ARDL bounds testing approach allowing for a mix of I(0) and I(1) variables while earlier studies on supply response either bypassed checking for stationarity or used more restricted approaches requiring larger samples. Weighted prices were used as opposed to simple averages used in previous studies.
Authors’ Contribution
This research article is part of Ph.D dissertation of Muhammad Azam Niazi supervised by Umar Farooq. Muhammad Azam Niazi (principal author) designed the study, conducted data analysis and undertook write-up for this research. Umar Farooq (supervisor) contributed in study design and helped in development of the model.
References
Akanni, K. and T. Okeowo. 2011. Analysis of aggregate output supply response of selected food grains in Nigeria. J. Stored Prod. Postharvest Res. 2(14): 266-278.
Albayrak, N. 1997. Applying time series analysis to supply response and risk. PhD. Dissertation submitted Dep. Econ. Univ. Leicester.
Anyaeji, E. 2017. The economic impact of fusion power in the UK’s 2050 energy mix. PhD Dissertation submitted Dep. Econ., Univ. Reading, UK.
Bouman, B. 2018. Does rice really use too much water? http://irri.org/blogs/bas-bouman-s-blog-global-rice-science-partnership/does-rice-really-use-too-much-water Blog accessed in 2018.
Chaudhary, M.A., M.A. Khan, K.H. Naqvi and M. Ahmad. 1998. Estimates of farm output supply and input demand elasticities: The translog profit function approach. Pak. Dev. Rev. 1031-1050. https://doi.org/10.30541/v37i4IIpp.1031-1050
GoP. 2015. Agricultural statistics of Pakistan. Minist. Nat. Food Secur. Res., GoP.
Hussain, Z., M. Shafique, M. Sial, I. Hussain and W. Akram. 2005. Factors affecting supply of rice in the Pakistani Punjab. Eur. J. Sci. Res. 17(1):31-43.
Junaid, S., A. Ullah, S. Zheng, S.N.M. Shah, S. Ali and M. Khan. 2014. Supply response analysis of rice growers in district Gujranwala, Pakistan. Pak. Agric. Sci. 5(11): 1069 -1076. https://doi.org/10.4236/as.2014.511116
Mahmood, M.A., A. Sheikh and M. Kashif. 2007. Acreage supply response of rice in Punjab. J. Agric. Res. 45(3): 231-236.
Mohammad, S., M.S. Javed, B. Ahmad and K. Mushtaq. 2007. Price and non-price factors affecting acreage response of wheat in different agro-ecological zones in Punjab: A co-integration analysis. Pak. J. Agric.Sci. 44(2):370-377.
Muhammad, S. 2005. Supply response of mjor crops in deifferent agro-ecological zones in Punjab. PhD Dissertation submitted Dep. Agric. Econ. Univ. Agric. Faisalabad.
Mushtaq, K. 2000. Supply response of major agricultural commodities in Pakistan. Ph.D Dissertation submitted Dep. Agric. Econ. Food Mark. Univ. New Castle Upon Tyne.
Mushtaq, K. and P. Dawson. 2002. Acreage response in Pakistan: a co-integration approach. Agric. Econ. 27(2): 111-121. https://doi.org/10.1111/j.1574-0862.2002.tb00110.x
Mushtaq, K. and P. Dawson. 2003. Yield response in Pakistan agriculture: A cointegration approach. Pap. Presented Proc. 25th Int. Conf. Agric. Econ. (IAAE).
Nerlove, M. 1958. On the Nerlove estimate of supply elasticity: A reply. J. Farm Econ. 40(3): 723-728. https://doi.org/10.2307/1235381
Nosheen, M., A.U. Rahman, S. Ullah and J. Iqbal. 2011. Farmers response to price and other factors of rice in Pakistan. Afr. J. Agric. Res. 6(12): 2743-2748.
Pesaran, M.H., Y. Shin and R.J. Smith. 2001. Bounds testing approaches to the analysis of level relationships. J. Appl. Econ. 16(3): 289-326. https://doi.org/10.1002/jae.616


