


Research Article
South Asian Experience of Trade Liberalization: Implications for Food Security
Inam Ur Rahman1, Syed Faizan Iftikhar2, Sanam Wagma Khattak3*, Wajahat Ali1, Azra4 and Sajad Ali1
1Department of Economics, Sarhad University of Science and Information Technology, KP, Peshawar, Pakistan; 2Applied Economics and Research Centre, University of Karachi, Pakistan; 3Department of Economics, University of Peshawar, Khyber Pakhtunkhwa, Pakistan; 4Department of Economics, Kohat University of Science and Technology, Kohat, Khyber Pakhtunkhwa, Pakistan.
Abstract | Food security is a multi-dimensional phenomenon having four pillars like availability of food, access to food, utilization of food and stability of food, where each pillar consist of several indicators. This study have two main objectives; computation of food security various dimensions indices and a composite food security index and exploring the link between trade liberalization and food security various dimensions, in the case of selected South Asian economies. The descriptive analysis revealed that Pakistan is the most and Nepal is the least food secure country in the region. Moreover, at country level the food availability and accessibility has lower values, where most of the countries are below the regional average values. While exploring the implications of trade liberalization for food security this study uses the panel data of five south Asian economies for a period of 24 years by utilizing the fixed effect and random effect estimation techniques. The trade liberalization link has been explored separately with each dimension of the food security. The empirical results show that the trade liberalization have negatively affect the food availability, accessibility and stability in the case of South Asia, while the food utilization is found to be positively associated with trade liberalization.
Received | May 10, 2020; Accepted | November 04, 2020; Published | January 22, 2021
*Correspondence | Sanam Wagma Khattak, Department of Economics, University of Peshawar, Khyber Pakhtunkhwa, Pakistan; Email: [email protected]
Citation | Rahman, I.U., S.F. Iftikhar, S.W. Khattak, W. Ali, Azra and S. Ali. 2020. South Asian experience of trade liberalization: Implications for food security. Sarhad Journal of Agriculture, 37(1): 52-63.
DOI | http://dx.doi.org/10.17582/journal.sja/2021/37.1.52.63
Keywords | Food security, Food availability and accessibility, Food utilization and stability, South Asian economies, Trade liberalization
Introduction
In developing countries, the trade liberalization policy is vastly debatable for its role in food security. The developing countries are typically dependent on inputs and technology imports to yield output. Consequently, the imports suppression policy and its mechanism have important insinuation for allocation of resources, distribution of income and efficiency. The trade policies have impacts on the level of production and development processes, through its influence on the structure and level of exports and imports.
Given trade liberalization, the post-world war II era have observed many changes in the policy professions. In 1950 and early 60’s, the development thinking was based on import substitution strategy, whereas it changed to outward (export) oriented strategy in the late 1960. The restrictive measures in that period embarked distortions in the allocation of resources; however, the trade liberalization was thought to solve the problem of resource misallocation, growth and investment (Karingi et al., 2005). Therefore, most of the developing countries embraced some type of trade liberalization to achieve the broader economic development and poverty reduction goals (Sachs and Warner, 1995). Trade liberalization is the process of becoming open to international trade by the means of gradual reduction in tariff and non-tariff barriers among the trading partners. It is presumed that the international trade enhances the economic growth and efficiency through reallocation of resources to produce and trade based on comparative advantages, which originates from the conventional trade theory (i.e. Heckscher-Ohlin theorem).
The Malthusian approach to food security says that the issue is starting with the disequilibrium of food amount and number of inhabitants. To attain the per capita food availability, the growth rate of the population should not be greater than the growth rate of food. This is the case of closed economy; however, the trade can play a prominent role to overcome the disequilibrium (Napoli et al., 2011). As per the World Bank (WB), International Monetary Fund (IMF) and World Trade Organization (WTO), the trade liberalization upshots the economic growth and development to reduce poverty and by extension improves the food security situation, (Bezuneh and Yiheyis, 2014). Nevertheless, the question remains debatable; Can the multi-dimensional food security be attributed at least in the direction of trade liberalization in developing countries (specifically, South Asia)?
Large number of studies over the subject has been conducted in recent decades. However, food security is a multi dimensional phenomenon, where the literature is missing the multi dimensionality of food security, while connecting it with trade liberalization. This study is an effort to contribute in the ongoing debate over the nexus between trade liberalization and food security in the case of South Asia, while considering the multi-dimensionality of food security. The study aims to construct the food security various dimensions indices and to find out the impact of trade liberalization on food security’s various dimensions to make deep insight. The study, thus, by empirical examination formulates important policy implications over this issue.
The study has been arranged in a manner as section two is discussing the food security profile of South Asia. Data, methodology and construction of multi dimensional food security Index has been discussed in section three. The theoretical framework of trade liberalization and food security has been explained in section four. Finally, results and conclusion of the study has been discussed in section five and six, respectively.
Food security profile of south Asia
The World Food Program 2014 estimated that 98% famished peoples’ lives in developing regions among which Asia and Pacific region account for 526 million hungry people, where 336 million starved people live in south Asia (World Bank, 2015). According to The World Bank 2013-14, 1345 million people are poor, lives with $1.25/day or less in the developing regions of the world, causing hunger and undernourishment. Similarly, according to the 2014-16 estimates of The State of Food Insecurity in the World shows that 795 million people are undernourished around the world.
In 2015, the monitoring period of the Millennium development goals (MDG) has over; the share of undernourished population has decreased to 12.9% from 23.3% of total population of 1990-92. Where some regions made fast progress and some regions remained slow on the track. South Asia lies in the slow group to cope with the MDGs 1c targets. At the beginning of MDG targets, 1010.6 million people were undernourished with 18.6% prevalence, where 20 million (less than 5%) were belonging to developed regions and the remaining 990.7 million (23.3%) belonging to developing regions. By 2016, the global number has reduced to 975 million people. Table 1 shows the distribution of under nourished population and prevalence of undernourishment around the world and regions.
The developing world is trickier in this esteem; however, the inter-regional distribution is not alike. South Asia shares the largest portion (28.8 million) of the undernourished people, where only Bangladesh, Maldives and Nepal have achieved the MDG 1c targets; however, no country have achieved the WFS goals (FAO, 2015).
To look over the hunger targets, child underweight and prevalence of undernourishment are the outcomes of food insecurity. In South Asia, during the MDG monitoring period, the prevalence of underweight children has been reduced from 49.2% in 1990 to 30% in 2013. The large contribution made by the access to clean water sources and better sanitation condition that provides better hygiene and health conditions.
Table 1: World wide and regional distribution of undernourished people and prevalence of undernourishment.
|
Regions/ Periods |
1990-92 |
2014-16 |
||
|
No. (In Mil.) |
Prevalence (%) |
No. (In Mil.) |
Prevalence (%) |
|
|
World |
1010.6 |
18.6 |
794.6 |
10.9 |
|
Developed world |
20 |
<5.0 |
14.7 |
<5.0 |
|
Developing world |
990.7 |
23.3 |
779.9 |
12.9 |
|
Develop regions (Overall) |
20 |
15 |
2 |
1.8 |
|
Developing regions |
||||
|
South Asia |
291 |
281 |
28.8 |
35.4 |
|
Sub Saharan Africa |
176 |
220 |
17.4 |
27.7 |
|
Eastern Asia |
295 |
145 |
29.2 |
18.3 |
|
South eastern Asia |
138 |
61 |
13.6 |
7.6 |
|
Latin America and Caribbean |
66 |
34 |
6.5 |
4.3 |
|
Western Asia |
8 |
19 |
0.8 |
2.4 |
|
Northern Africa |
6 |
4 |
0.6 |
0.5 |
|
Caucasus and central Asia |
10 |
6 |
0.9 |
0.7 |
|
Oceania |
1 |
1 |
0.1 |
0.2 |
|
Total |
1011 |
795 |
100 |
100 |
Source: FAO; Note: 2014-16 are provisional estimates.
Despite the improvements in global food security over the past five years, the food insecurity and hunger persist (The Economist, Intelligence Unit, 2016). In 2015-16 most of the countries lost their nutritional scores instead of improvements. The index ranked 113 countries, including Sri Lanka, India, Pakistan, Nepal and Bangladesh from South Asia on 65th, 75th, 78th, 82nd and 95th position, respectively. Sri Lanka’s food security scores have been declining in 2016 than that of 2015; however, the remaining countries have improved their scores.
Construction of multi-dimensional food security index: Data and methodology
The theoretical framework, indicators selection, normalization of the data, weighting and aggregation of the indicators and dimensions are necessary parts of constructing a multi-dimensional index prescribed by (Nardo et al., 2005). The multivariate analysis and principal component analysis are also necessary. However, this study uses the indicators based on the previous studies like Napoli et al., (2011) and Amaya (2009), where they have checked the statistical appropriateness of the indicators; the remaining steps are as follow.
Theoretical foundations of food security index
The food security is a versatile phenomenon and cannot be measured directly. To measure the phenomenon, we are using several indirectly observed indicators, which describe the different aspects of the phenomenon (Napoli et al., 2011). The four dimensions of food security are very complex terms and accommodate different suits of indicators. The indicators, used in this study are taken from (Napoli et al., 2011), and the various issues of FAO on the state of food insecurity in the world. Table 2 shows the indicators selected for various dimensions of food security.
The indicators for each dimension have been selected based on some criteria, stated as follow:
Food availability contains the existence of utensils for production indicated by arable land and has positive relationships with food availability in terms of production. The Average dietary energy supply adequacy (ADA) displays an improvement in food deprivation or the undernourishment situation and share of dietary energy Supply derived from cereals, roots and tubers (DEC) specify diet quality, which is negatively related to food availability. Average protein supply (APS) is also vital for enhancing the food availability. The rising value of the food production index will augment the food availability.
Food accessibility is the access to adequate means (entitlements) to acquire appropriate food for nutritious diet. The physical or corporal access means transportation and infrastructure used to ship the food stuff to deficient areas is shown by the percentage of paved roads over total roads (PRD) (FAO, United Nations Rome 2013). The economic/financial access identifies the number of people having abilities to buy the available food. So, it is indicated by the Consumer Price Index (Napoli et. al., 2011), and GDP per capita (GDPPC) (Amaya, 2009). The social access problem arises when food might physically be available and the potential consumer has the money to buy the food but is prevented from doing so for being the member of a specific social group, region or gender, signified by Rural Population (RPN) (Riely et al., 1999). Theoretically, the PRD, GDPPC has positive relationship with FAC while the CPI, RPN are negatively associated with the food accessibility.
Food utilization is the nonfood input of food security, describing the state of nutritional well being achieved through adequate diet, fresh drinking water, enriched sanitation and health care, (FAO, 2006). Food utilization is identified by anthropometric indicators affected by under nutrition, i.e. wasting; stunting and underweight are proxy by the prevalence of malnutrition (MLN) and undernourishment (UNT). The food quality and preparation, health and hygiene condition determine the effective utilization of available food (FAO, UN Rome, 2013). It is identified by access to improved water sources (WIP) and improved sanitation facilities (SIP).
Food stability means the permanence of the other three dimensions. It pledges the access to available adequate food all times and may not be worsened due to abrupt economic, climatic and seasonal jolts, (FAO, 2006). The stability indicated by vulnerability or exposure to risk, which gradually make us food insecure by affecting indirectly the food security, shown by arable land equipped for irrigation (AIL) which measures the exposure draughts. The shocks that directly affect food security like unexpected changes in input and product prices, production and supply also harm the stability of food (FAO, 2013). The stability will be achieved when food production index is less volatile (VFP). Similarly, with higher volatility of general price level, there will be uncertain shocks to food accessibility. It is specified by the variability of consumer price index (VCPI). Cereal import dependency ratio (CMDR) has negative implications for food stability as cereal is the main food constituent, when foreign exchange rate increases the imports becomes more lavish and leads to a reduction in imports of food which causes country wise food security.
The data of Dietary energy supply adequacy (ADA), Dietary energy supply derived from cereals, roots and tubers (DEC), Average protein supply (APS), Paved roads (PRD), Gross domestic product per capita (GDPPC), Access to improved water (WIP), Access to Improved sanitation facilities (SIP), Undernourishment (UNT), Cereal import dependency ratio (CMPD)Arable Land (ARL), Food Production index (FPI), Rural population (RPN), Undernourishment (UNT)3, Consumer Price Index (CPI), Agricultural irrigated land area (AIL) Variability of consumer price index (VCPI) and Variability of food price index (VFPI) has been taken from different sources namely: the food and agriculture organization statistics (FAOSTAT), FAO food security indicators, world development indicators (WDI) and UN statistical data base for the period of 24 years (1991 to 2014).
In this paper, we have only taken six countries from the region as per availability of data. However, the missing observations have been imputed through explicit modeling, i.e. the unconditional mean imputation and regression imputation suggested by (Nardo et al., 2005) and (Napoli et al., 2011).
The linear transformation is necessary as different units are not comparable and cannot be aggregated together. The max-min linear scaling technique has preferred over the z-score statistics because the z-score transformation doesn’t remain stable when the data becomes available for a new time (Nardo et al., 2005). The indicators once transformed have been rescaled from 1 to 100 range to make it standardized (Napoli et al., 2011). For each indicator Y, the country i in time t, is transformed by;
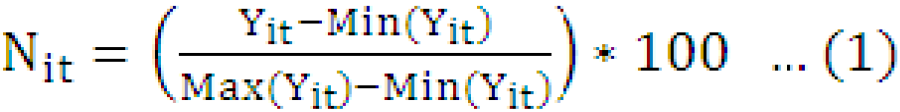
Where;
Nit is a normalized indicator in time t for country i and Yit is the observation in given time t for the ith country. The expression (1) is mostly used in time dependent studies, when the Yit>Maxit the observation will become greater than 1 (Nardo et al., 2005).
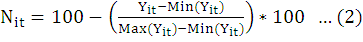
The indicators are being classified “bad” or “good” in their relation to the phenomenon. The indicators classified as bad to be inversed (Napoli et al., 2011). For inversion, Equation 1 is being subtracted from 100 given in Equation 2.
Aggregation of the indicators and dimension
The simple arithmetic mean is used for linear aggregation in two steps; to aggregate the indicators in dimension and then to aggregate the dimensions in multi dimensional food security index. The food security for ith country in the time t is being calculated as:
FSMIit= {1/4(FAVit+ FACit + FUTit + FSTit)} …(3)
Some studies like Nardo et al., (2005) and Annand and Sen (2000) proposed the geometric mean to compute the multipart index. However, Neumayer et al. (2010), Sagar and Najam (1998) and Desai (1991) suggested the simple arithmetic mean. They argued that we are calculating the same phenomenon through multiple indicators; therefore, we could allow one indicator to compensate for another.
The incidence of food security in south Asia
The 2014-16 of World Food Insecurity estimates confirm that still one in nine people in the world suffering from hunger and undernourishment which indicates that we should do more in fighting against the hunger. Based on the techniques discussed in part 2 of the paper, we have calculated the food security for South Asian countries. The Table 3 in this regard shows the overall food security and its dimension-wise distribution across the south Asian countries.
The fact is, there are large variances in dimensional status across the countries. India stands on top rank in terms of food availability, whereas the Sri Lanka is on the bottom. The food accessibility topped by Bangladesh and again Sri Lanka stands at the lowest one. However, the food utilization situation is best in Sri Lanka and worst in Bangladesh. Pakistan food stability is highest among the south Asian economies and India has the lowest rank.
The food availability and food accessibility are the areas that need to be improved, while the food utilization and stability is somehow better. But on the other hand, the average value of food availability, which is threshold level for overall region, is 50.40 where only two countries lie below the average. It means that there are little differences in food availability across the countries; however, the low regional threshold level indicates the alarming situation. Similarly, in case of food accessibility, the average value (regional threshold) is 34.45, 64.63 for food utilization and 80.92 for food stability; where 3, 3 and 4 countries, respectively lie below the average value. The results again show that the regional situation is much harmed in terms of food accessibility as compare to food utilization and food stability. The results also show that most of the countries lie below the threshold level which needs to be improved. It means that the countries have the capacity to improve their situation in terms of the last three dimensions of food security.
The Global Food Security Rankings in Asia and Pacific region estimated 23 countries, where the threshold (average) level for all the countries in terms of food security was 56.43. Out of the 5 economies in our analysis 4 countries are above the regional threshold. Pakistan is the most food secure country in overall terms. However, the individual dimensional position is not smooth. Nepal is the lowest food secure country or in other words the most food insecure country in the region; however, the food accessibility and stability is somehow better over there. The remaining three countries have least variances in their food security scores. The percentage distribution of food security is not much varied across the countries, as shown in Figure 1. It means that the contribution of all the countries to the regional food security is not much varied. This outcome indicates that not a single country is performing very well and other are countries are lacking. So, food security is the problem of the entire region, not only of the single country. In this regard, both the regional combined as well as individual country efforts are needed to make improvements in food security situation with special focus on food availability and accessibility dimensions of food security. The food availability and accessibility are highly dependent on the status of agriculture and income conditions of the inhabitants, which needs to be highly focused while designing economic policies.
Trade liberalization and food security: Theoretical frame work
The nexus between international trade and food security is very complex. For instance, if a country bans the grain imports may boost the domestic food supply and to lessen the prices in short run but the exporting farmers may negatively be influenced by such policies. International trade policies may affect the domestic availability, prices of goods and factors of production, market structures, productivity, resource use sustainability, nutrition and various population groups in various ways, which have implications for food availability, access to food, utilization and stability of food, respectively (The state of food insecurity in the world, 2015). A simple analytical frame work for linking trade liberalization and food security includes three stages. Figure 2 enlightens the link between trade liberalization and food security.
The figure clearly shows that any reform or external shock will indirectly affect the welfare of the society through some intermediate factors. Trade liberalization influences domestic prices by delivering incentives to producers and consumers. As a response to the changes in price level and access to external markets; the altered quantities are produced. It depends on the degree of market admittance, market assimilation and the degree of access to marketed assets. Trade liberalization on the one hand contributes to domestic stuffs and on the other hand it contributes to international trade volume. Finally, the gains from prices and quantities make sure the food supply (availability) and by increasing income levels provide means for accessing to food (Reforms, 2003).
Empirical framework: Data and estimation techniques
The major determinant of food security is presumed to be trade liberalization. The dependent variables are food availability, food accessibility, food utilization, food stability and overall food security. This is a balance panel data of five developing countries from South Asia including Bangladesh, India, Nepal, Pakistan and Sri Lanka for 24 years, from 1991 to 2014. This study uses the trade intensity ratio is a measure of trade liberalization. The data for Trade openness/intensity has been taken from world pen table and UNCTAD database. Besides the trade liberalization the analysis uses a suit of various other determinants as control variable, which are given along with their sources in Table 4.
Panel data has preferred over cross sectional data because it can check for the differences in individual specific behaviors. The ordinary least square (OLS) estimation taking constant the observed and unobserved effects, while the panel data estimation can incorporate the effect of such factors to allow for heterogeneity (Greene and Hensher, 2010). Let us explain the use of appropriate model by setting a hypothetical regression equation.
Xit= βYit+ λŽi + εit
Here Yi t represents a set of regressors with no constant term, while Ži contains the constant term and a set of observed and unobserved individual effects. εit shows the overall disturbance term in the model. If the Ži is assumed only constant term, then we can use the Pooled Regression where the slopes and intercepts obtained will be consistent and efficient. If the Žiis unobserved and correlated with yit then the slope coefficients will be biased and inconsistent due to omitted variable(s) where the fixed effect model will be used. But if the unobserved effect has formulated uncorrelated with included individual variables then we will use the random effect model to obtain sound results. The model has been selected based on the langrage multiplier test for deciding between the polled OLS and random effect models, while the Hausman specification test has been used for choosing between fixed effect and random effect models. This study embraces 5 regressions to assess the impact of trade liberalization on food security. All the regressions show the determinants of each dependent variable along with expected signs. Here we use only the short form of variables in regressions; however, the full description of the variables is given in Table 4.
All the models inspect into the determinants of food availability (FAV), food accessibility (FAC), food utilization (FUT), food stability (FST).
Table 2: Food security dimensions and it indicators.
|
Dimensions |
Indicators |
|
Food Availability (FAV) |
Arable land as percentage of total land area (ARL) Average dietary energy supply adequacy (ADA) Share of dietary energy supply derived from cereals, tubers and roots (DEC) Average protein supply (APS) Food production index (FPI) |
|
Food Accessibility (FAC) |
Paved roads as percentage of total roads (PRD) GDP per capita (GDPP) Consumer price index (CPI) Domestic food price index (DFP) Rural population as percentage of total population (RPN) |
|
Food Utilization (FUT) |
Prevalence of malnutrition (MLN) Prevalence of undernourishment (UNT) Access to improved water sources (WIP) Access to improved sanitation facilities (SIP) |
|
Food Stability (FST) |
Percentage of arable land equipped for irrigation (AIL) Volatility of food production index (VFP) Variability of consumer price index (VCPI) Cereal import dependency ratio (CMDR) |
Table 3: Distribution of food security and it dimensions across the countries.
|
Country |
Food avaialbility |
Food accessibility |
Food utilization |
Food stability |
Food security |
|||||
|
Scores |
Rank |
Scores |
Rank |
Scores |
Rank |
Scores |
Rank |
Scores |
Rank |
|
|
Bangladesh |
54.17 |
2 |
45.84 |
1 |
61.56 |
5 |
79.20 |
4 |
57.62 |
4 |
|
India |
56.20 |
1 |
37.80 |
2 |
62.20 |
3 |
77.76 |
5 |
57.81 |
3 |
|
Nepal |
46.01 |
4 |
31.75 |
3 |
61.98 |
4 |
80.17 |
3 |
54.44 |
5 |
|
Pakistan |
50.81 |
3 |
30.65 |
4 |
66.07 |
2 |
87.23 |
1 |
61.06 |
1 |
|
Sri Lanka |
44.75 |
5 |
26.22 |
5 |
71.35 |
1 |
80.27 |
2 |
58.71 |
2 |
Source: Author’s calculations.
Table 4: Data sources for the determinants of overall food security and it individual dimensions.
|
Variables |
Sources |
|
AGPOP (agriculture population) |
WAF |
|
EXR (Exchange rate), HEXP (Health Expenditure), REM (Remittances), UEM (Unemployment rate), GDPPCGR (GDP per capita growth rate), AGRPOPGR (Agriculture population growth rate), AGRLL (Agriculture land), CRL (crop land area) |
WDI (World Development Indicators) |
|
GDPGR (GDP growth rate), GDPPC (GDP per capita), IRI (Agriculture irrigated land), RPNT (rural population, CPI (Consumer price index) |
FAO food security indicators, WDI, IMF data base. |
FAVit = βo + β1it (TRL) + β2it (CRL) + β3it (GDPPC) + β4it (EXR) + β5it (RPNGR) + uit …(1)
FACit = βo + β1it (TRL) + β2it (REMM) + β3it (EXR) + β4it (RPN) + uit ….(2)
FUTit = βo + β1it (TRL) + β2it (GEXP) + β3it (GDPPC) + β4it (AGRL) + β5it (RPN) + uit ….(3)
FSTit = βo + β1it (TRL) + β2it (IRI) + β3it (GDPPC) + β4it (AGRLL) + β5it (CPI) + β6it (UEM) + uit …(4)
Results and Discussion
Determinants of food availability
Based on the Housman statistic the model has been estimated through the fixed effect panel data estimation technique with time dummies included and the regression line is best fitted as shown by the R2 value. The results revealed that the Trade openness has distinctively negative association with food availability shown in Table 5.
Table 5: Trade liberalization and other determinants of food availability.
|
Determinants |
Coefficients |
T-value |
P-value |
|
TRL (Trade Openness) |
(-0.19) ** |
-2.19 |
0.03 |
|
Crop land Area |
(0.37) *** |
1.86 |
0.06 |
|
GDP per capita |
-0.00002 |
0.1 |
0.92 |
|
Foreign Exchange rate |
(-0.0002) ** |
-2.3 |
0.02 |
|
Rural population growth |
(-0.59) ** |
-2.42 |
0.018 |
|
Constant |
(47.61) * |
37.52 |
0.00 |
|
R2 Within |
0.89 |
||
|
F-Value |
F = (33.23) * |
0.00 |
|
|
Housman stats |
Chi2 (5) = (362.71) * |
0.00 |
|
|
Wald stats |
Chi2 (6) = (12.32) *** |
0.0553 |
|
|
Time Dummy |
Included |
||
Note: (*P<0.05, **P<0.01 and ***P<0.001) correspondingly show the results significance at 10%, 5% and 1% level of significance.
As per FAO (2015) and WFP (2015); the trade liberalization could negatively influence the food availability for net food exporting countries, because the higher prices in international market attracts the producers, which could harm the domestic food supply. On other hand, in case of net food importing countries, the domestic producers cannot compete with the imported goods, which harm the rural agriculture activities through multiplier effects.
Among the other determinants of food availability; the crop land areas have a positive significant association with food availability because the increase in crop land area can increase the crops production, which enhances the food availability. The rising foreign exchange rate and rural population growth rate has unfavorable impact on food availability situation. The negative association of rural population growth rate with food availability is due to the disguised unemployment in rural agriculture sector and the incomes of rural population falls, which decreases the food availability.
Determinants of food accessibility
Table 6 shows the link between Food Accessibility and its determinants, the results are obtained from panel data regression model estimated through fixed effect estimation technique, based on significant Housman statistic. The regression line is best fitted and the time dummies are included in the model.
Table 6: Trade liberalization and other determinants of food accessibility.
|
Determinants |
Coefficients |
T-value |
P-value |
|
TRL (Trade Openness) |
(-1.75) * |
-2.81 |
0.006 |
|
Foreign exchange rate |
(-0.06) ** |
-4.69 |
0.00 |
|
Foreign remittances |
(4.98e-12) |
0.37 |
0.713 |
|
Rural Population |
(-0.52) * |
-7.29 |
0.00 |
|
Constant |
(75.78) * |
13.94 |
0.00 |
|
R2 Within |
0.9131 |
||
|
F-Value |
F (26,79) = (31.91) * |
0.00 |
|
|
Housman stats |
Chi2 (4) = (42.52) * |
0.02 |
|
|
Wald stats |
Chi2 (6) = (29.12) * |
0.00 |
|
|
Time Dummy |
Included: chi2 (21) = (36.73) * Prob> chi2 = 0.0181 |
||
Note: (*P<0.05, **P<0.01 and ***P<0.001) correspondingly show the results significance at 10%, 5% and 1% level of significance.
Table 7: Trade liberalization and other determinants of food utilization.
|
Determinants |
Coefficients |
T-value |
P-value |
|
TRL (Trade Openness) |
(3.33) * |
3.56 |
0.001 |
|
Govt.; health expenditure |
(-1.11) ** |
-2.02 |
0.04 |
|
Rural population |
(-1.02) * |
-8.76 |
0.00 |
|
Per Capita GDP |
(0.002) * |
7.89 |
0.00 |
|
Agriculture land area |
(0.008) * |
6.61 |
0.00 |
|
Constant |
(72.80) * |
6.19 |
0.00 |
|
R2 Within |
0.70 |
||
|
F-Value |
F = (56.47) * |
0.00 |
|
|
Housman stats |
Chi2 (4) = (115.88) * |
0.00 |
|
|
Wald stats |
Chi2 (6) = (92.55) * |
0.00 |
|
|
Time Dummy |
Not Included |
||
Note: (*P<0.05, **P<0.01 and ***P<0.001) correspondingly show the results significance at 10%, 5% and 1% level of significance.
The findings revealed that trade liberalization is negatively associated with food accessibility and the results are consistent with FAO (2015). According to WFP (2015), the negative impact of trade liberalization for net food exporting countries is because of the increase in domestic prices of exportable goods. Trade liberalization may also decline the employment and incomes in sensitive import competing sectors of the economy. Foreign exchange is also negatively associated with food accessibility. The possible negative impact is due to the lack of resources for imports in food deficient economies. Similarly, the rural population has negative impact on food accessibility because the rural agriculture is mostly subsistent and the local demand always exceeds the local supply. Because the natural disasters and calamities, lake of water resources and farm mechanization keeps the production at lower level. On the other hand, the transportation cost is higher in rural areas due to the lack of communication and road infrastructure, which makes it difficult to transport the perishable goods to remote areas and the people access to food, becomes limited. So, the people become more vulnerable to food both in terms of production and consumption.
Determinants of food utilization
Table 7 shows the determinants of food utilization estimated through fixed effect panel data estimation technique based on the value of Housman statistic, where the time dummies are not included in the model.
Table 8: Trade liberalization and other determinants of food stability.
|
Determinants |
Coefficients |
T-value |
P-value |
|
TRL (Trade Openness) |
(-0.08) * |
-4.23 |
0.00 |
|
Agriculture irrigated land |
(0.48) * |
8.65 |
0.00 |
|
GDP per capita |
(0.003) * |
4.54 |
0.00 |
|
Inflation rate (CPI) |
(-0.15) ** |
-7.17 |
0.00 |
|
Agriculture land area |
(0.0003) ** |
3.03 |
0.003 |
|
Unemployment rate |
(-0.04) |
-0.21 |
0.83 |
|
Constant |
(36.47) * |
4.18 |
0.00 |
|
R2 Within |
0.45 |
||
|
F-Value |
F = (16.88) * |
0.00 |
|
|
Housman stats |
Chi2(5)=(40.51)* |
0.00 |
|
|
Wald stats |
Chi2(6)=(175.21)* |
0.00 |
|
|
Time Dummy |
Not included |
Note: (*P<0.05, **P<0.01 and ***P<0.001) correspondingly show the results significance at 10%, 5% and 1% level of significance.
The results show that food utilization have positive link with trade liberalization and the results are in line with the results of FAO (2015) and WFP (2015). According to these studies, trade induces variety of foods, which promotes the diet quality, preferences and tastes of the consumers by applying international standards. The health expenditure shows a negative association with food utilization because the higher health expenditure shows that a large portion of the population experiencing the health issues and needs higher level of expenditures in health sector. So, higher the government expenditures on health, lower will be the food utilization situation in the short run. The rural population is negatively associated with food utilization situation in the case of south Asian economies, because the lack of safe sanitation facilities, lack of clean drinking water and hygienic food preparation techniques harms the food utilization situation. If there is an increase in per capita GDP it will have positive impact on food utilization, because the people will spend more on education which make them aware of health and hygiene care that reduce the diseases associated with food utilization. The agriculture land area has also positive impact on food utilization. It means that increase in agriculture land area promotes food utilization because it adds into the production of varieties of food and provides a healthy environment, which is necessary for reducing diseases and promoting food utilization situation.
Determinants of food stability
Table 8 shows the link between food stability and it determinants estimated through the fixed effect panel data estimation technique.
The result shows that the food stability is negatively associated with trade liberalization. Because, in the case of net food importing countries, primary reliance is on international market for food supplies, therefore; these economies are not shock friendly. Secondly, the exporting countries trade policies also affect the importing countries i.e. tightening the exports. So, at the earlier stages of development, the sectors become more suspicious regarding the price and import shocks (FAO, 2015; WFP, 2015). In the other determinants, the increase in agriculture land area significantly induces the food stability, through the improvements in domestic production. An increase in the per capita GDP also enhances the food stability situation, which provides both for consumption and production of food and even in the periods of food shock the people can afford to maintain their dietary requirements. The inflation rate is very important indicator that decreases the food stability situation, where an increase in the inflation rate highly reduces the food stability because inflation reduces the real incomes of the people and less amounts are then devoted to food consumption. Agriculture land area also accounts for a slight inducement in food stability. The provision of irrigation facilities and utilization of agriculture land for crops production is vital for stable food, while the unemployment is very harmful to food stability. The unemployment reduces the income and the people with unemployed status cannot complete their dietary needs. They are becoming vulnerable to shocks and their food intakes do not remain stable.
Conclusions and Recommendations
Food security has four pillars like availability, accessibility, utilization and stability, where each pillar contains a suit of various indicators. The paper has two parts including the computation of multi-dimensional food security and estimating the impact of trade liberalization and other determinants of food security. To compute the food security multi-dimensional index, the data has been normalized to make the indicators comparable for which the maximum-minimum linear scaling technique is used, while the simple arithmetic mean is used for computing the composite index of food security. The results show that Pakistan stands with higher level of food security followed by Sri Lanka, India, Bangladesh and Nepal. The distribution of food security by dimensions is much diversified. Food availability is higher in India, accessibility in Bangladesh, Utilization in Sri Lanka and Stability in Pakistan.
Trade liberalization has subsidiary effect on food security all dimensions. The effect may change from sample to sample, the definition and computation of food security as well as the definition and measurement of trade liberalization. In case of South Asia, the trade liberalization has negative impact on food availability, accessibility and stability, while it has positive impact on food utilization that means overall food security is harmed through trade liberalization in South Asia. The study suggests that the multidimensionality of food security and individual analyses are very important that has been ignored in earlier studies. Each individual dimension has its own relationship with other macro-economic variables.
The study also suggests some policy tools to attain the food security by the means of socio-economic drivers. Utilization of food and its stability are somehow better in the region, while the access to food is a big problem faced by the region. The access should be improved by developing the roads and railways infrastructure, and the financial and the social means. Poverty, lake of planned urbanization and poor rural agriculture economy in the region is the big hurdle in access to nutritious and sufficient food. So, in attaining the food security the food accessibility needs more attention. The study further proposed that the domestic economic conditions can play a more decisive role than international economy in handling the issue. The policy makers need to focus on the domestic means instead of going for international solution of the problem.
The study also has some limitations and a broader scope for future research. The very limitation in this regard is the availability of data. The trade liberalization is a policy measure which should be computed through tariff and non-tariff tools. The food security has also been more complex and it has now more than four pillars, which need to be quantified so that to be sued in empirical assessment. The researchers in this subject needs to broaden the empirical tools and study country-wise situation to attain the most appropriate results.
Novelty Statement
This research highlights empirical literature over the nexus between trade liberalization and food security in developing countries (the case of South Asia), while considering the multi dimensionality of food security.
Author’s Contribution
Inam Ur Rahman: Idea, write-up, data collection and analysis
Syed Faizan Iftikhar: Helped in data collection and estimation.
Sanam Wagma Khattak: Proof reading, grammatical corrections.
Wajahat Ali: Helped in typographical corrections.
Azra: Helped in overall format of the manuscript.
Sajad Ali: Provided technical guidelines
Conflict of interest
The authors have declared no conflict of interest.
References
Amaya, M.G.V., 2009. Trade liberalization and food security: The case of Bolivia after the structural reforms of 1985.
Anand, S. and A. Sen. 2000. Human development and economic sustainability. World Dev., 28(12): 2029-2049. https://doi.org/10.1016/S0305-750X(00)00071-1
Athukorala, P.C., J.S. Bandara and S. Kelegama. 2011. Trade liberalization and poverty in South Asia. (1st Ed. eBook). Routledge studies in the growth economies of Asia, 105. http://hdl.handle.net/10072/44541
Bezuneh, M. and Z. Yeheyis. 2012. The effect of trade liberalization on food security: The experience of selected African countries. J. Afri. Dev., 14(1): 13-26.
Bezuneh, M. and Yiheyis, Z. 2014. Has trade liberalization improved food availability in developing countries? An empirical analysis. J. Econ. Dev., 39(1): 63-78. https://doi.org/10.35866/caujed.2014.39.1.003
Chowdhury, M.B., 2005. Trade reforms and economic integration in South Asia: SAARC to SAPTA. Appl. Econ. Int. Dev., 5(4): 23-40. http://www.usc.es/economet/reviews/ aeid542.pdf
Desai, M., 1991. Human development: concepts and measurement. Eur. Eco. Rev., 35(2): 350-357. https://doi.org/10.1016/0014-2921(91)90136-7
FAO, IFAD and WFP. 2015. The state of food insecurity in the world. https://www.wfp.org/publications/state-food-insecurity-world-2015
FAO, 1996. Rome declaration on world food security and world food summit plan of action. World Food Summit. Rome. Italy. http://www.fao.org/3/w3613e/w3613e00.htm
FAO, 2002. The state of food insecurity in the world. http://www.fao.org/3/y7352e/y7352e00.htm
FAO, 2003. The state of food insecurity in the world. http://www.fao.org/3/j0083e/j0083e00.htm
FAO, 2006. Food Security, Policy brief, Issue 2. https://reliefweb.int/report/world/policy-brief-food-security-issue-2-june-2006
FAO, 2015. The state of food insecurity in the world 2015. Meeting the 2015 international hunger targets: Taking stock of uneven progress. Food and agriculture organization publications. Rome. Italy. http://www.fao.org/3/a-i4646e.pdf
FAO, IFAD and WFP. 2013. The state of food insecurity in the world. http://www.fao.org/3/i3434e/i3434e00.htm
Greene, W.H. and D.A. Hensher. 2010. Modeling ordered choices: A primer, Cambridge University Press. https://EconPapers.repec.org/RePEc:cup:cbooks:9780521142373. https://doi.org/10.1017/CBO9780511845062
Heidhues, F., A. Atsain, H. Nyangito, M. Padilla, G. Ghersi and L. Vallée. 2004. Development strategies and food and nutrition security in Africa: an assessment. Int. Food Pol. Res. Inst.
Herath, H.M.S.P., 2014. Impacts of regional trade agreements (RTAs) on food security: A case of ASEAN free trade agreement. https://doi.org/10.2139/ssrn.2463578
Karingi, S., R. Lang, N. Oulmane, R. Perez, M.S. Jallab and H.B. Hammouda. 2005. Economic and welfare impacts of the EU-Africa economic partnership agreements. Afr. Tra. Pol. Cen. Eco. Comm. Africa.
Napoli, M., P. De Muro and M. Mazziotta. 2011. Towards a food insecurity multidimensional index (FIMI). Master in human development and food security. http://www.fao.org/fileadmin/templates/ERP/uni/FIMI.pdf
Nardo, M., M. Saisana, A. Saltelli, S. Tarantola, A. Hoffman and E. Giovannini. 2005. Handbook on constructing composite indicators. Methodology and user guide. Organisation for economic co-operation and development (OECD). https://www.oecd.org/sdd/42495745.pdf
Neumayer, E. and T. Plümper. 2010. Spatial effects in dyadic data. Int. Organ., 64 (01): 145-166. https://doi.org/10.1017/S0020818309990191
Panagariya, A., 2002. Costs, benefits and risks from trade: Theory and practice for food security. FAO expert consultation on trade and food security: Conceptualizing the linkages, Rome. http://www.fao.org/3/y4671e/y4671e07.htm
Reforms, T., 2003. Trade reforms and food security: Conceptualizing the linkages. Commodities and Trade Division (FAO) Rome, Italy. http://www.fao.org/3/Y4671E/y4671e00.htm
Riely, F., Mock, N., Cogill, B., Bailey, L. and Kenefick, E., 1999. Food security indicators and framework for use in the monitoring and evaluation of food aid programs. Nutrition Technical Assistance Project (FANTA), Washington, DC. https://pdf.usaid.gov/pdf_docs/Pnacg170.pdf
Sachs, J.D., Warner, A., Åslund, A. and Fischer, S., 1995. Economic reform and the process of global integration. The Brookings Institution. 26(1): 1-118. https://doi.org/10.2307/2534573
Sagar, A. D. and Najam, A. 1998. The human development index: A critical review. Ecol. Eco. 25(3): 249-264. http://www.sciencedirect.com/science/article/pii/S0921-8009(97)00168-7, https://doi.org/10.1016/S0921-8009(97)00168-7
The Economist, Intelligence Unit. 2016. Global Food Security Index. An manual measure of the state of global food security.
Thomas, C., 2001. Global governance, development and human security: exploring the links. J. Third World Q., 22(2): 159-175. https://doi.org/10.1080/01436590120037018
WFP. 2015. Hunger and Markets. World Hunger Series. Rome, Italy and Earthscan,London. https://www.academia.edu/38354964/World_Hunger_Series_Hunger_and_Markets
World Bank, 2013. Kuwait country report. https://tcdata360.worldbank.org/render?country=KWT
World Bank, 2015. Poverty and Hunger: Issues and options for food security in developing countries. Washington. DC. https://eric.ed.gov/?id=ED281806
To share on other social networks, click on any share button. What are these?


