
Simulation of Nitrate Leaching under Different Irrigation Deficit and Nitrogen Levels in Tomato Crop using HYDRUS 1-D


Research Article
Simulation of Nitrate Leaching under Different Irrigation Deficit and Nitrogen Levels in Tomato Crop using HYDRUS 1-D
Masaud Khan1*, Muhammad Jamal Khan1, Tahir Sarwar1 and Muhammad Jamal Khan2
1Department of Water Management, The University of Agriculture, Peshawar, Khyber Pakhtunkhwa, Pakistan; 2Soil and Environmental Sciences, Faculty of Crop Production Sciences, The University of Agriculture, Peshawar, Khyber Pakhtunkhwa, Pakistan.
Abstract | Tomato is one of the most input demanding crop in terms of water and fertilizer. To fulfill the irrigation water demand, the growers use surface and ground water resources, which are declining day-by-day. Realizing the importance of water, tomato yield was studied under deficit irrigation regimes and different Nitrogen (N) levels during 2015 and 2016 at the research farm of the University of Agriculture Peshawar, Pakistan. A randomized complete block design (RCBD) with factorial arrangement was used for the study. These factors were four irrigation levels i.e. full irrigation (I0), 15% deficit (I15), 30% deficit (I30) and 45% deficit (I45) along with four Nitrogen doses i.e. 100% of recommended dose (120kg) (N100), 85% of recommended dose (N85), 70% of recommended dose (N70) and 55% of recommended dose (N55). Frequency Domain Reflectometry (FDR) was used for soil moisture monitoring. Full irrigation was determined on the basis of MAD 30%. Simulation of nitrate leaching showed that Nitrate leaching was more sensitive to irrigation levels than Nitrogen doses. With the increasing level of irrigation nitration, leaching increased significantly compared to the increasing Nitrogen doses and same pattern was observed with the decreasing irrigation levels and decreasing nitrogen doses. When irrigation levels were increased by 10 and 20% nitrate leaching increased by 38 and 48%. Similarly when Nitrogen levels were increased by 10 and 20% increase in nitrate leaching was about 20 and 35% but when irrigation level were decreased by 10 and 20 % nitrate leaching also decreased by 20 and 48% and when the nitrogen level was decreased to 55% the nitrate leaching also dropped by 70%. Based on the above results, it can be concluded that deficit irrigation with low nitrogen doses can be used to minimize nitrate leaching. HYDRUS-ID can be effectively used for simulating Nitrate leaching.
Received | October 17, 2018; Accepted | December 25, 2018; Published | February 03, 2019
*Correspondence | Masaud Khan, Department of Water Management, The University of Agriculture, Peshawar, Khyber Pakhtunkhwa, Pakistan; Email: masaud56.mk@gmail.com
Citation | Khan, M., M.J. Khan, T. Sarwar and M.J. Khan. 2018. Simulation of nitrate leaching under different irrigation deficit and nitrogen levels in tomato crop using Hydrus 1-D. Sarhad Journal of Agriculture, 35(1): 126-133.
DOI | http://dx.doi.org/10.17582/journal.sja/2019/35.1.126.133
Keywords | Leaf area index, Deficit irrigation, Partial root drying, Randomized complete block design
Introduction
Tomato (Lycopersicon esculentum) locally known as Tamatar  is a herbaceous plant belonging to Solanaceae family.
  For optimum yield and quality, tomato needs cool and dry climate. Irrigation consumes a major portion of fresh water. It is estimated that agriculture use two-third of human associated water (Fereres and Evans, 2006). Therefore, judicial use of agriculture water becomes utmost important and such strategies must be adopted, which allow water saving and maintain satisfactory yield hence, improving water productivity may contribute to water saving (Parry et al., 2005; Topcu et al., 2007). In areas where there is shortage of water, instead of maximizing yield it may be more profitable to the farmers to maximize water productivity (Pereira et al., 2002). This can only be achieved by adopting high efficiency irrigation system (Costa et al., 2007).
In recent years, another approach is gaining popularity for improving water use efficiency is deficit irrigation. This approach is mainly used for water saving. Under this practice a certain amount of water stress is applied at a particular growing stage or continuous stress is applied during the whole growing season (Patane and Tringali, 2011). Among all the plant nutrients, Nitrogen is the most mobile nutrient and its availability to the crop is usually limited due to its various pathways by which it is lost to the atmosphere or percolate deeply beyond the root zone. These various pathways are leaching, ammonia volatilization and de-nitrification. Due to these losses, the N efficiency decreases considerably. Nitrogen use efficiency is approximately 33% worldwide; the remaining is a loss, which is considerable to the farmers (Singandhupe et al., 2003).
Fertilizer loss from the field is also a major concern. In the current irrigation scenarios, the field application efficiency is around 50%, which is very low and the fertilizer use efficiency of the crop is around 33%, which is also on the lower side (Raun and Jhonson, 1999). In order to overcome the shortage of water, the irrigation and fertilizer use efficiency of crops need to be improved and drip irrigation system is one of the options. Once these fertilizers are released into the subsurface environment, they ultimately join the surface or underground water resources and have a negative impact on aquatic and land life. Nowadays, numerous models are used to for estimation of nutrients leaching below the root zone. In the present study, HYDRUS-1D was used to simulate N losses from experimental treatments which is a computer-based model having the capability of simulating solutes, heat and water in soil one dimensionally. (Šimunek and Hopmans, 2009). Simulating nitrate leaching would minimize fertilizer and water use because over irrigation and high doses of fertilizer is an economic loss to the farmer and also hazardous to subsurface water table which in the conventional method is not possible as they are unable to predict that how much of the applied fertilizer was taken up by plants and how much leach below the rootzone to join the water table.
Materials and Methods
Climatic data soil data
The weather data (daily maximum and minimum temperature, wind speed, humidity, sunshine hour and rainfall data) was collected from metrological station installed at the Research Farm during the experimental period. From the rooting depth (60 cm) of tomato crop 96 soil samples were collected and analyzed for various physical and chemical parameters before starting the experiment (Table 1).
Table 1: Basic physical and chemical properties of soil at the experimental site.
| S. No | Characteristic | Unit | Status |
| 1 | Texture Class | -- | Silt Loam |
| 2 | pH | -- | 7.50 |
| 3 | EC |
dSm-1 |
0.18 |
| 4 | Bulk Density |
g cm-3 |
1.41 |
| 5 | Field Capacity (FC)1 | % by vol. | 32.00 |
| 6 | Permanent Wilting Point (PWP)1 | % by vol. | 18.00 |
| 7 | Available Water (AW) |
mm m-1 |
140.00 |
| 8 | Total N | % | 0.14 |
Details of experiment
Experiment were conducted at the research farm of the University of Agriculture Peshawar, Pakistan during the growing season of tomato (March – July, 2015 and 2016). The experiment was arranged in a randomized complete block design (RCBD) with 16 treatments replicated 3 times. Four irrigations levels (0, 15, 30 and 45% deficit) and four different doses of N (100, 85, 70 and 55% of recommended dose) Nitrogen was applied in three equal split doses (at sowing, before flowering and before fruit formation stage). Tomato variety (Syngenta, T1359) was selected because of its viral resistivity. Plant-to-plant spacing was 40 cm and row-to-row spacing was 60 cm.
Plant height
Plant height was measured in cm with the help of meter rod at 20 days interval after transplantation. From each treatment height of three plants was measured in cm. Data was latterly used for calibration of the model.
Leaf area index
Leaf area index was measured after 40 days of transplantation. Six sample plants from each treatment were randomly selected to find the Leaf Area Index by dividing leaf area with canopy of the plant in m2. Leaf are was measured with the help of planimeter and was converted to m2. (Monte et al., 2013).

Where;
LA = Leaf Area; SA = Surface Area.
HYDRUS-1D model
The HYDRUS-1D is a computer-based model developed by the University of California, USA. HYDRUS-1D is a computer-based model having the capability of simulating solutes, heat and water in the soil one-dimensionally using Richard’s equation (1931). Before simulation, the model was calibrated with data given in Table 2.
Table 2: Data requirements of HYDRUS-1D model.
| S. No | Input data | Equipments used | Frequency |
| 1 | Soil Data |
Once during the research |
|
| Soil texture | Hydrometer | ||
| Soil bulk density | Core sampler | ||
| Soil moisture | FDR | Daily | |
| 2 | Metrological Data |
Daily |
|
| Temperature | Metrological Station installed inside Malakandher Farm | ||
| Wind speed | |||
| Humidity | |||
| Sunshine | |||
| Rainfall | |||
| 3 | Irrigation Data | As per irrigation schedule | |
| 4 | Crop Data | Procedure explained in methodology | Once |
| Crop height | |||
| Leaf area index | |||
| Root depth | Previous research work | ||
|
5
|
Any Other Data |
Previous research work |
|
|
Θr (Residual soil water content) |
|||
|
Θs (Saturated soil water content) |
|||
|
α (soil water retention function L-1) |
|||
|
ɳ (soil water retention function) |
|||
For assessment of N leaching, three samples from different soil depths (15, 30 and 45 cm) of each treatment were collected before and after fertilizer application. These samples were analyzed in the laboratory for N concentrations using the procedure given by Bremner and Mulvaney (1996). Simulation results were compared with actual field results.
Models used in HYDRUS-1D for simulation
Water flow: Richard equation was used to describe Variably-saturated water flow:

Where;
h = volumetric soil water cont. (L3 L-3); t = time; z = vertical space coord. (L); h = pressure head (L); K = hydraulic conductivity (L T-1); S = sink term accounting for water uptake by plant roots (L3 L-3 T-1).
For unsaturated soil hydraulic properties van Genuchten–Mualem functional relationships was used. (Van Genuchten, 1980).
Root water uptake: For sink term S. Feddes et al. (1978), introduced a microscopic model-based approach, in which root density distribution function β(z, t) (L-1), distributes potential evaporation rate Tp (L T-1), over the rootzone and multiply it with a dimensionless stress response function, (Van Genuchten, 1987; Šimunek and Hopmans, 2009).

Where;
Sp(z, t) and S(h, z, t) = volume of water (actual and potential) in a unit from unit volume of soil (L3 L-3 T-1), respectively; α(h, z, t) = dimensionless function of soil water pressure head (h) (0 ≤ α ≤ 1).
Solute transport: In variably saturated porous medium the one-dimensional solute transport is governed by a partial equation are define in HYDRUS-1D as:

Where;
θ = volumetric water cont. (L3 L-3); c, c̅ and cr = solute concentrations liquid phase (M L-3); solid phase (M M-1), and sink term (M L-3); respectively; ρ = soil bulk density (M L-3); q = volumetric flux density (L T-1); D = hydrodynamic dispersion coefficient (L2 T-1); Φ = chemical reactions of solutes involved in a sequential first-order decay chain, (M L-3 T-1); SCr = passive root nutrient uptake (Šimunek and Hopmans, 2009).
Root nutrient uptake: In Eq. (3.12) the parameter cr is the nutrient concentration dissolved in water and uptaken by roots, and is defined as:

Where;
Cmax = priori defined maximum concentration of the root uptake.
For Nitrogen uptake estimation, unlimited passive uptake was considered, value of Cmax was larger than the dissolved concentrations, c, which means total nutrients dissolved were taken up by plants roots, and nothing was left for others uptake. Passive uptake was used for root nitrogen uptake (Šimunek and Hopmans, 2009).
Boundary conditions
As the all the plots were at field capacity during the transplantation, therefore, throughout the soil profile a uniform value of 0.32 cm3 cm-3 was used. For HYDRUS standard solute transport model initial condition were specified in concentration terms of N-NO3. Concentration flux BC was used as upper boundary condition. Zero concentration gradient was used for lower boundary condition. For initial condition in liquid phase was used (mass of solute / volume of water). For the surface atmospheric condition and for the bottom of the profile free drainage condition were set as the boundary condition. Meteorological data taken during the study period was used for specifying atmospheric boundary conditions. Penman-Monteith method was used for daily values of evapotranspiration rate (ET0). LAI and corresponding Soil Cover Factor (SCF) were used to estimate crop transpiration and soil evaporation the two function of daily evapotranspiration rate following Ramos et al. (2011).
Experimental fields were irrigated when the plot with full irrigation was at 30% MAD (Management Allowed Deficit) and was brought back to field capacity and the rest of the treatments were calculated from the full irrigation plot between March and June. In full irrigation plot, application amounts averaged 20 mm per irrigation event. Daily values of moisture and precipitation are presented in Figure 1.
Soil hydraulic properties
Inverse augur hole method was used for hydraulic conductivity.
A hole was bored to a depth of 1 meter and was filled with water. The rate of fall of water level from a fixed reference point was measured at 10 second interval. Hydraulic conductivity was then calculated by using the following equation.

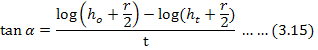
Where;
K = Hydraulic conductivity; ho = height of water surface from a fixed reference point; ht = total height of water in the hole; r = radius of the hole; t = time; Value of hydraulic conductivity was 10.81 cm day-1.
Solute transport parameters
Solute transport parameters were used from the data already published by Ramos et al. (2011) (Table 3).
Table 3: Adjusted parameters for calibration of HYDRUS.
| Depth (cm) | 60.00 |
|
Θr (Residual soil water content) |
0.06 |
|
Θs (Saturated soil water content) |
0.45 |
|
α (soil water retention function L-1) |
0.02 |
|
ɳ (soil water retention function) |
1.41 |
|
Ks (Saturated hydraulic conductivity) (cm d-1) |
10.80 |
| l (Tortuosity parameter in the conductivity function) | -0.50 |
Root distribution and root-water uptake
Soil rooting depth was set to a uniform value of 60 cm in each sub-plot and for soil water pressure head HYDRUS internal database was used from Feddes et al. (1978) model based on Wesseling et al. (1991).
Results and Discussion
Simulation of nitrate leaching using HYDRUS-1D
Calibration and Validation of HYDRUS-1D: Calibration of Flow Parameters: Water Flow model for variably unsaturated soil media was calibrated using inverse modeling technique. Field (soil texture, bulk density, daily moisture data, crop height, leaf area index and rooting depth) lab (nitrogen uptake) and metrological data (daily maximum and minimum temperature, wind speed, humidity, sunshine hour and rainfall data) taken during cropping season in 2015 was used as input data (Table 2). Residual soil water content (θr), Saturated soil water content (θs), parameter in soil water retention function (α), parameter in soil water retention function L-1 (ɳ), Saturated hydraulic conductivity (Ks) and Tortuosity parameter in the conductivity function (l) were adjusted to get the close match between observed and model predicted soil moisture. Final values of adjusted parameter for which results showed a good match between observed and predicted soil moisture content are shown in Table 3. The model was validated using second year’s metrological, field and Lab data collected during cropping season in 2016. Results of calibration and validation are shown in Figures 3 and 4. Both observed and predicted value show a very good match with an R2 of 0.70 and 0.80 for calibration and validation, respectively.
Calibration and validation of solute transport models
After calibration and validation of the water flow model, calibration of the solute transport was carried out. Parameters used in solute transport were taken from the data published by Ramos et al. (2011). Model was calibrated by the field data (leaf area index, rooting depth and plant height) taken in 2015. Figure 5 shows calibration results, which were very good having R2 value of 0.80, which lies in the acceptable limits (R2 ≥ 0.45). After calibration, the model was then validated with the observed data of 2016. Figure 6 shows actual nitrate leaching vs HYDRUS predicted values. This time R2 value was 0.97, which was very good and hence the model was considered as validated.
Simulation of Nitrate Leaching using HYDRUS-1D
After calibration and validation of HYDRUS-1D for solute transport simulation of nitrate leaching was started. Eight simulation condition (four irrigation levels and four Nitrogen doses) were taken. four irrigation levels were 80, 90, 110 and 120% of full irrigation. Four fertilizer doses were 55, 100, 110 and 120% of recommended Nitrogen dose. Other parameters like metrological and fitted were kept the same.
When full irrigation and full Nitrogen doses were applied nitrate, leaching was 10 mg cm-2 with the increase of irrigation level by 10% then Nitrate leaching increased to 13.8 mg cm-2) which is an estimated increase of about 38%. When the irrigation level was increased to 120%, the Nitrate leaching increased by about 48% to 14.8 mg cm-2 (Figure 7). But when the nitrogen dose was increased by 10%, then Nitrate leaching increased to 12 mg cm-2, which is an estimated increase of about 20%. When the Nitrogen dose was further increased to 120%, the Nitrate leaching increase by about 35% (13.5 mg cm-2) compared to full irrigation (100% ETc) and recommended Nitrogen dose (Figure 8).
Similarly, when the irrigation level was decreased by 10%, then Nitrate leaching decreased to 8 mg cm-2, which is an estimated decrease of about 20%.
But when nitrogen doses were decreased to 55%, the Nitrate leaching decreased to 4.7 mg cm-2, which is an estimated decrease of about 53% compared to full irrigation (100% ETc) and recommended Nitrogen dose (Figure 9). But when the irrigation level was decreased by 20%, then Nitrate leaching decreased to 5.2 mg cm-2, which is an estimated decrease of about 48%. when Nitrogen dose was decreased to 55% at 80% irrigation level, the Nitrate leaching decrease to 3 mg cm-2, which is an estimated deccrease of about 70% compared to full irrigation (100% ETc) and recommended Nitrogen dose (Figure 9). All these results are in close confirmation to Afrous et al. (2012) who also reported that nitrate leaching has a linear relation with water deficit as water deficit increase nitrate leaching decrease and HYDRUS-1D can be accurately used to simulate nitrate leaching from the field.
Conclusions and Recommendations
Nitrate leaching was more sensitive to irrigation levels then Nitrogen doses. With the increasing level of irrigation nitration leaching increased significantly compared to the increasing Nitrogen doses and same pattern was observed with the decreasing irrigation levels and decreasing nitrogen doses. Deficit irrigation of 45% reduced Nitrogen uptake by 13%, Deficit irrigation significantly reduce Nitrate leaching, whereas, over irrigation increases Nitrate leaching significantly. Nitrogen dose above 120 kg ha-1 increases Nitrate leaching significantly. Lower Nitrogen doses had non-significant effect on Nitrate leaching. Deficit irrigation with low nitrogen doses can be used to minimize nitrate leaching. HYDRUS-1D can be efficiently used for simulating Nitrate leaching.
Author’s Contribution
This article is based on the PhD research work of Masaud Khan, conducted under the supervision of Prof. Dr. Muhammad Jamal Khan. Prof. Dr. Tahir Sarwar and Prof. Dr. Muhammad Jamal Khan, who were members of the supervisory committee.
References
Bremner and R.L. Mulvaney. 1996. Nitrogen-inorganic forms. In: D.L. Sparks (ed.) Method of Soil Analysis. Part 3. Amer. Soc. Agron. 38: 1123-1184.
Costa, J.M., M.F. Ortu˜no and M.M. Chaves. 2007. Deficit irrigation as a strategy to save water: Physiology and potential application to horticulture. J. Integr. Plant Biol. 49: 1421–1434.
Feddes, R.A., P.J. Kowalik and H. Zaradny. 1978. Simulation of field water use and crop yield. Simul. Monogr. Pudoc. Wageningen, The Netherlands.
Fereres, E. and R.G. Evans, 2006. Irrigation of fruit trees and vines. Irri. Sci. 24: 55–57.
Monte, J.A. and D.F. de Carvalho. 2013. Growth analysis and yield of tomato crop under different irrigation depths. R. Bras. Eng. Agríc. Ambiental. 17(9): 926–931.
Mulvaney, R.L. 1996. Nitrogen-inorganic forms. In D.L. Sparks (ed.) method of soil analysis. Part 3. Am. Soc. Agron. 38: 1123-1184.
Parry, C. 2005. Irrigation reliability and the productivity of water: A proposed methodology using evapotranspiration mapping. Irrig. Drain. Sys. 19(3): 211–221. https://doi.org/10.1007/s10795-005-8135-z
Patane, C. and S. Tringali. 2011. Effects of deficit irrigation on biomass, yield, water productivity and fruit quality of processing tomato under semi-arid Mediterranean climate conditions. Sci. Hortic. 129: 590–596. https://doi.org/10.1016/j.scienta.2011.04.030
Ramos, T.B., J. Simunek and M.C. Goncalves. 2011. Field evaluation of a multicomponent solute transport model in soils irrigated with saline waters. J. Hydro. 407: 129–144. https://doi.org/10.1016/j.jhydrol.2011.07.016
Raun., W.R. and G.V. Jhonson. 1999. Improving nitrogen use efficiency for cereal production. J. Agron. 91(3): 357-367. https://doi.org/10.2134/agronj1999.00021962009100030001x
Simunek, J. and J.W. Hopmans. 2009. Modeling compensated root water and nutrient uptake. Ecol. Model. 220: 505–521. https://doi.org/10.1016/j.ecolmodel.2008.11.004
Singandhupe, R.B., G.G.S.N. Rao, N.G. Patil and P.S. Brahmanand. 2003. Fertigation studies and irrigation scheduling in drip irrigation system in tomato crop (Lycopersicon esculentum L.) Europ. J. Agr. 19: 327-340. https://doi.org/10.1016/S1161-0301(02)00077-1
Topcu, S., C. Kirda, Y. Dasgan and H. Kaman. 2007. Yield response and N-fertiliser recovery of tomato grown under deficit irrigation. Eur. J. Agron. 26: 64–70. https://doi.org/10.1016/j.eja.2006.08.004
Van-Genuchten, M.T. 1980. A closed form equation for predicting the hydraulic conductivity of unsaturated soils. Soil Sci. Soc. Am. J. 44: 892–898. https://doi.org/10.2136/sssaj1980.03615995004400050002x
Walsh, L.M. and J.D. Beaton. 1973. Soil testing and plant analysis. Soil Sci. Soc. Am., Madison. WI, USA.
Wesseling, J.G., J.A. Elbers, P. Kabat and B.J. Broek. 1991. SWATRE: Instructions for Input. Report, Winand Staring Cent., Wageningen, Netherlands.


