


Research Article
Profit Efficiency among Transplanting and Direct Seeded Rice Producers (Case Study of Certain Rice Growing Areas of Province Punjab, Pakistan)
Hina Fatima1*, Sania Shaheen2, Lal Khan Almas3 and Sehrish Haroon4
1Finance and Economics, Mohammad Ali Jinnah University, Karachi, Pakistan; 2Islamic International University, Islamabad, Pakistan; 3Agricultural Business and Economics, West Texas AandM University, Canyon, TX USA; 4Fatima Jinnah Women University, Rawalpindi, Pakistan.
Abstract | Profit efficiency of transplanted rice production (TRP) and direct seeded rice system (DRS) is gaining greater attention in Pakistan. Profit efficiencies of TRP and DRS are estimated with data from farmers belonging to various districts of Punjab. Gujranwala, Hafizabad, Sheikhupura, Jhang and Sialkot are the major rice producing areas of Punjab. The primary data is collected from the above mentioned areas through random sampling. Stochastic Frontier Analysis (SFA) serves as a tool of obtaining reliable estimations of profit efficiency of rice production. Findings from SFA reveal profit efficiency of rice farmers for TRP to be 57% and 83% for DRS farmers. The results further Bring to light the loss of 43% profit of TRP and 17% profit loss of DRS due to unsuitable combinations of inputs. Direct seeded rice farmers displayed more efficiency compared to the transplanted rice farmers. However, for DRS and TRP farmers’ opportunities still exist to maximize profit through adopting improved farming practices and production techniques. Moreover, the results also demonstrated that farmer’s education, age, farming experience, extension service facility and land tenancy considerably effects profit efficiency of rice producers. Therefore, the efficiency of rice farmers can be improved through increase in the number of educated people in farming system, and the enrichment of extension services in the rural areas.
Received | October 28, 2019; Accepted | June 17, 2020; Published | August 08, 2020
*Correspondence | Hina Fatima, Finance and Economics, Mohammad Ali Jinnah University, Karachi, Pakistan; Email: hina.fatima@jinnah.edu
Citation | Fatima, H., S. Shaheen, L.K. Almas and S. Haroon. 2020. Profit efficiency among transplanting and direct seeded rice producers (Case study of certain rice growing areas of province Punjab, Pakistan). Sarhad Journal of Agriculture, 36(3): 840-850.
DOI | http://dx.doi.org/10.17582/journal.sja/2020/36.3.840.850
Keywords | DRS: Direct Seeded Rice, TRP: Transplanting rice, SFA: Stochastic Frontier Analysis, Maximum Likelihood Estimates
Introduction
Rice is considered to be an Asian crop because the production and consumption of rice is as large as 90%, approximately. Rice has the status of staple food for about half of the population of the world and three fourth of the people in developing regions. Rice is the second most important food crop in Pakistan, preceded by wheat. Pakistan ranks as the 11th rice producing country in the world and 5th largest exporter worldwide. There is value addition by rice crop, accounting to 3.2% in agricultural sector and a small contribution of 0.7% in GDP of Pakistan. In July-March 2014-15, rice crop was sown on an area of 2,891 thousand hectares, presenting growth of 3.6% compared to the year 2013-14, while rice production in 2014-15 was around 7005 thousand tonnes, revealing growth of 3% as compared to the year 2013-14 that accounted for earning of US$ 1.53 billion foreign exchange from rice exports.
Around the globe, two rice sowing methods are primarily used: I) Direct Seeding Rice Method (DRS). II) Conventional or Transplanting Rice Method (TRP). In DRS sowing procedure, seeds are directly sown in the farmland, whereas in case of TRP method, seeds are first sown in the nursery and later on rice plants are planted in the land (Akhgari and Kaviani, 2011). According to Pandey and Velasco (2005) the DRS method was introduced in developing countries in 1950s. Currently, in developed and developing parts of the world such as America, Italy, France, Western Europe, Russia, Japan, Korea, India, Philippian and in some parts of Iran, rice farming is practiced through the DRS method (Akhgari, 2004). On the other hand, in Pakistan conventional TRP method is swiftly substituting the direct seeded broadcasting method. Shortages of mandatory labor, water scarcity and higher cost borne by the farmers are the shortcomings associated with TRP method (Pandey et al., 2002; Tuong et al., 2005; Nguyen and Ferrero, 2006).
In Pakistan, most of the rice growing farmers cultivate rice through the conventional TRP method. This method not only needs lot of water rather also requires number of skilled labor, along with high time consumption and is also an expensive method for raising nursery, uprooting and transplantation. The existence of these limitations results in low rice yield and productivity (Younas et al., 2015). Currently rice growers have shifted from traditional method to DRS including areas like Sheikhupura, Gujranwala, Hafizabad, Jhang, Sailkot, Gujrat, and Faisalabad (Murugaboopathi et al., 1991). After comparison of both the methods, DRS turned out to be less expensive than the TRP method (Awan et al., 2007).
Objectives of this study include an estimate and compare profitability of DRS and TRP users in 2014-15 during Kharif season, in the selected districts of Punjab to examine the sources of inefficiency affecting the profit margins of rice farmers under DRS and TRP methods.
Objectives of the study
- To carry out gross margin analysis of DRS and TRP farmers.
- To compare the profit efficiency among DRS and TRP farmers.
- To estimate the sources of profit inefficiency.
Literature review
Previous pool of studies has estimated profit efficiency of rice crop in various geographical regions. Major findings of some of the studies are highlighted in this section. Abdulai and Huffman (1998) estimated the profit inefficiency in Northern Ghana by using farm level survey data. The results of the study concluded that educational level, access to credit and specialization in rice farming practices have a positive influence in enhancing the productive efficiency of rice farmers. Rahman (2003) estimated the profit inefficiency among Bangladeshi rice farmers in both Aman and Aus/Boro seasons by using Stochastic Frontier Analysis (SFA). The results revealed that on an average, profit efficiency was 64%, indicating 36% of farmers incurring loss due to the technical and allocative inefficiency in modern rice production system. The profit inefficiency was greatly influenced by Infrastructure, extension services, tenancy status and share of non-agriculture income.
Rahman et al. (2015) estimated the profitability and efficiency of rice producing methods in coastal areas of Bangladesh. The results support the fact that average level of technical efficiency was 87% however, average output can be raised by 12.50% with the given set of technology and inputs. The study concluded that farmers’ age, education and farm related trainings have a positive contribution towards cumulative profit efficiency of farmers. Younas et al. (2015) measured the economic evaluation of direct seeded and conventional rice by selecting some important districts of Punjab. The results established that compared to paddy yield farmers, the Direct seeded farmers get higher profit in the selected study areas. Hence, DRS is a favorable technology if farmers overcome weed problems by using chemical control procedures.
Research methodology
Sampling procedure of TRP and DRS systems: The study was developed on primary data sources consisting of cross sections collected from 300 randomly selected farmers in five selected rice growing districts of Punjab. Structured questionnaire served as a tool for collecting data from farmers following the interview method. From each district 4 villages were selected using purposive random sampling technique to find out both the types of farmers, i.e., Transplanting (TRP) and direct seeded (DRS) rice farmers in the selected areas. TRP and DRS farmers were randomly selected to a total of 15 famers from each village.
Materials and Methods
Farrell (1957) did the pioneer work on the concept of efficiency and produced the frame work for the development of production frontier. Production inefficiency was estimated by using technical and allocative efficiency recently combined into one measure (Ali and Flinn, 1989; Wang et al., 1996). Technical efficiency analysis is the most renowned approach for efficiency measurement, computed with the help of production frontier function (Battesse and Coelli, 1995). Ali and Flinn (1989) argue about the inappropriate production frontier approach for technical efficiency analysis in the presence of price dissimilarity due to various factor endowments, faced by farmers. As an alternative of analyzing the production and cost frontier separately, a profit frontier function is generally used for the analysis of farm efficiency (Kumbhakar and Bhattacharya, 1992; Ali et al., 1994; Wang et al., 1996).
Profit efficiency is defined as capacity to achieve highest profit level at given prices and input units. Contrary to this is the profit inefficiency which is the position of the farm loss because of not operating on frontier (Ali and Flinn, 1989). Technical and allocative efficiencies are used together in profit function however, any limitations on production side can decrease producer’s profit (Ali et al., 1994). Numerous studies have used efficiency measurement as a tool to calculate level of efficiency. The estimated efficiency indices were regressed on a number of socio-economic factors in order to describe the observed difference in farm level efficiency by using a two-step process (Sharif and Dar, 1996). Whereas, Battese and Coelli (1995) integrated the SFA model with an inefficiency model that is based on the linear function of independent variables (farm-specific factors). This model comes with the benefit of calculating the farm specific efficiency and to estimate the factors that describe farmer’s efficiency difference by using a single estimation process. In the present research, the model of Battese and Coelli (1995) was used to estimate the profit function by using stochastic frontier approach.
The basic functional form of stochastic profit function is as:
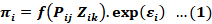
πi = It shows the normalized profit which is calculated as total revenue-total cost divided by the rice output prices; Pij= Price of jth input variable of ith farm divided by the rice output prices; Zik = Level of fixed input of the ith farm and K are the number of fixed inputs and i= 1, 2, 3…n number of sample farmers; εi= error term is supposed to be consistent with frontier model (Ali and Flinn, 1989).
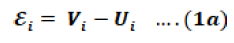
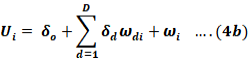
Vi = estimate the random effects like statistical noise, measurement errors, omitted explanatory variables; Ui = estimate the profit inefficiency. It is Non-negative one sided error term; Ui is supposed to be identically distributed with mean is defined as:
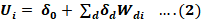
and variance δ2u. Wdi is the dth independent variables which is connected with ith farm inefficiency and δ0 and δd are the unknown parameters.
The profit efficiency of firm i is defined in the form of stochastic frontier profit function as:
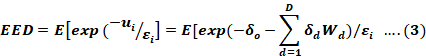
E shows the expectation error. For estimating the unknown parameters maximum likelihood estimates are used in the SFA frontier and inefficiency effects model, simultaneously. According to Battese and Coelli (1995) variance parameters in the maximum likelihood function is defined as:
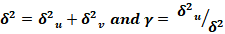
δ2 estimates the total deviation from the frontier which can occur due to profit inefficiency (Battese and Coelli, 1995). The parameter γ shows the inefficiency share from the total variance errors. γ value lies between 0 and 1. Value of 1 show that frontiers are deterministic and 0 signifies the sign in accordance of OLS estimation. Under the SFA model the test of test-statistic is measured as:

The log likelihood values L (H0) and L (H1) under the condition of null and alternative hypothesis.
Empirical model
This study has estimated flexible translog profit function. The functional form of translog profit function is given in the following equation as:

Where;
Where;
φij=φji for all j and i; π’= restricted normalized profit is explained as total revenue- total variable cost divided by farm specific rice price (Pj); Pi (Pj)= Price of variable inputs, normalized by rice price (Pj); Pp = Pesticide cost normalized by rice price (Pj); Ps = Seed cost normalized by rice price (Pj); Pirr = Irrigation cost normalized by rice price (Pj); Pw = Weedicide cost normalized by rice price (Pj); PL = Labor cost normalized by rice price (Pj); PF = Fertilizer cost normalized by rice price (Pj); ZCI = Capital Intensive cost measured as (sum of animal cost + mechanical power) in farm j; ZAR = Area under rice crop (hectare under rice) in farm j; Ui = inefficiency effects; Vi = unknown random variable; ωd= 6 variables clarifying inefficiency effects describes as; ω1= Age (years); ω2= Education (farmer years of schooling); ω3= Experience (No of farming experience); ω4= Access to extension service (Dummy variable 1 if farmers have a contact to extension officer otherwise zero); ω5= Household size (measured as no of working person in the family); ω6= Tenancy status (Dummy variable if farmer is an owner otherwise zero which represents farmer status as a tenant).
Ln is the natural logarithm and α0, αi, φij, τik, βk, θkl, δo, δd are the estimated parameters. This model is adopted from Rehman (2002) with certain amendments.
Results and Discussion
Descriptive analysis of TRP and DRS systems
The socio-economic characteristics of farmers are presented in Table 1. The average age of traditional farmers and direct seeded farmers is 50 and 45 years, respectively which suggests that majority of sample farmers engaged in farming activities are older. The average education of conventional and direct seeded sample farmers is about primary level which is the same for both types of farmers indicating low level of academic qualification due to limited availability of education in the selected areas. The average farm size of conventional famers is between 5 to 15 acres while direct seeded rice farmers’ ranges between 5 and 10 acres. The average years of farming experience between conventional and direct seeded sample farmers is 35 and 40 years, respectively. The average size of farmers’ households for both TRP and DRS is approximately 8 to 11 people in each home.
Table 1: Socio-economic characteristics of rice farmers.
|
S.# |
Variables |
Conventional field Average |
Direct seeded field average |
Unit |
|
1 |
Age |
50 |
45 |
Years |
|
2 |
Education |
5 |
5 |
Years |
|
3 |
Experience |
35 |
40 |
Years |
|
4 |
Farm to market distance |
5 |
4 |
KM |
|
5 |
Farm size |
5-15 |
5-10 |
Acre |
|
6 |
Household size |
8-11 |
8-11 |
Number of person in each household |
This study also estimates the comparative gross margin analysis of transplanting and direct seeded rice. For computing the descriptive analysis results in this study, SPSS 20 is used. The results are given in Table 2. The average gross margin of rice from a transplanted rice field is Rs.20001.00, and Rs.30407.09 from a direct seeded field. This demonstrates that broad variation exists in the gross margin of rice produced from transplanted and direct seeded fields. One of the reasons is the direct seeded rice fields, on average, require 22 units of irrigation per hour per acre while transplanted field requires 15 units of irrigation per hour per acre. Thus, DRS fields saved 7 units of irrigation per hour per acre compared to transplanted rice fields. On the other hand, TRP fields required an average of 5-6 kg of seed per acre while DRS fields needed of 15-16 kg per acre. Overall results disclose the high yielding capacity of DRS field conditioned upon appropriately managing weedicide issues. Therefore, the results indicate that the potential rice productivity from direct seeded fields is higher than that of a TRP field.
Empirical results and discussion
Hypothesis testing for TRP and DRS systems: Table 3 presents a different hypothesis regarding various inefficiency conditions by utilizing likelihood
Table 2: Comparative gross margin analysis of transplanting rice and direct seeded rice.
|
Gross margin analysis of transplanting rice |
Gross margin analysis of direct seeded rice |
||||||||
|
Inputs |
Unit |
Average quantity |
Price |
Value |
Inputs |
Unit |
Average quantity |
Price |
Value |
|
Leaser leveller |
Rs |
1 |
2100 |
2100 |
Leaser leveller |
Rs |
1 |
2100 |
2100 |
|
Motivator |
Rs |
1 |
2000 |
2000 |
Rotavator |
Rs |
1 |
2000 |
2000 |
|
Ploughing |
Rs |
4 to 5 |
656 |
3280 |
Ploughing |
Rs |
3 to 4 |
660 |
2640 |
|
Planking |
Rs |
1 to 2 |
597 |
1194 |
Planking |
Rs |
1 to 2 |
564 |
1128 |
|
Tractor |
Rs |
1 |
2000 |
2000 |
Tractor |
Rs |
1 |
1750 |
1750 |
|
Seed |
Cost |
5-6 kg |
96 |
576 |
Seed |
Cost |
15-16 kg |
90 |
1440 |
|
Urea |
Price per 50kg/ bag |
1 to2 |
1800 |
3200 |
Urea |
Price per 50kg/ bag |
2 |
1800 |
3600 |
|
DAP |
Price per 50kg/ bag |
1 to 2 |
3800 |
7600 |
DAP |
Price per 50kg/ bag |
1 to 2 |
3800 |
7600 |
|
FYM |
Rs/per trolley |
4 to 5 |
1200 |
6000 |
FYM |
Rs/per trolley |
4 to 5 |
1200 |
6000 |
|
Weedicide |
Cost |
2-3 litre |
648 |
1944 |
Weedicide |
Cost |
5 to 6 litre |
1600 |
9600 |
|
Insecticide |
Cost |
2-3 litre |
2100 |
6300 |
Insecticide |
Cost |
2 litre |
2045 |
4090 |
|
Pesticide |
Cost |
2-3 litre |
884 |
1768 |
Pesticide |
Cost |
3 to 4 litre |
1700 |
6800 |
|
Irrigation |
# |
22 |
1400 |
30800 |
Irrigation |
# |
15 |
1200 |
18000 |
|
Total variable cost |
70762 |
Total variable cost |
66748 |
||||||
|
Price of rice straw |
Rs |
8820 |
Price of rice straw |
Rs |
9112 |
||||
|
Total price of conventional rice output |
Rs |
81389.943 |
Price of rice output |
Rs |
88043.09 |
||||
|
Gross margin effect |
20001 |
Gross margin effect |
30407.09 |
||||||
Table 3: Testing of hypothesis.
|
Likelihood ratio statistics calculation |
|||||
|
Hypothesis |
Transplanting rice test statistics values |
Direct seeded rice test statistics values |
Critical value |
Decision |
|
|
H0= γ=0 |
31.88 |
69.42 |
ᵡ2(1, 0.95 )=1.58 |
Rejected |
|
|
H0= δo = δd = 0 |
16.08 |
37.09 |
ᵡ2(6, 0.95) = 11.07 |
Rejected |
|
ratio test statistics. The first null hypothesis γ = 0, is rejected at 5% significance, indicating that inefficiency exists in the profit frontier model. It confirms that variability occurs in farmers’ profit level due to technical and allocative inefficiencies.
The second null hypothesis, rejected at 5% significance, indicates farm level inefficiencies are not affected by the independent variables included in the profit model. Thus confirming the inefficiency affected by the explanatory variables included in the profit model.
Profit frontier estimates for TRP and DRS systems: The maximum likelihood estimates of the profit frontier results are presented in Table 4. The estimated parameters of pesticide and weedicide costs are negative and significant at 1% in both TRP and DRS systems. This implies that an increase in pesticide and weedicide cost would lead to significant reduction in farmer profits. This occurs because of unlimited usage of pesticides and weedicides thereby, harming rice crops, thus reducing rice productivity. Rahman (2002) and Hyuha et al. (2007) demonstrated the same results.
The estimated parameters of seed cost are also positive and significant at 1%, indicating that increase in seed cost would lead to increased farmer profit in both TRP and DRS systems. An increase in seed usage has a significant impact on rice productivity, and this result meets the theoretical expectation. Consequently, farmers achieve higher profits by sale of rice productivity in the market. Ansah et al. (2014) displayed same results.
Table 4: Profit frontier results.
|
Maximum likelihood estimates of profit frontier function |
||||||||
|
|
Transplanting rice |
Direct seeded rice |
||||||
|
|
Variables |
Parameters |
Coefficient |
t-ratio |
Coefficient |
t-ratio |
||
|
|
Constant |
α0 |
28.30 |
28.24*** |
7.491 |
7.645*** |
||
|
1 |
ln Pp |
αP |
-30.04 |
-29.11*** |
-60.99 |
-65.57*** |
||
|
2 |
ln Ps |
αS |
23.26 |
23.02*** |
122.83 |
124.1*** |
||
|
3 |
ln Pirr |
αIrr |
6.054 |
6.809*** |
5.329 |
7.12*** |
||
|
4 |
ln Pw |
αw |
-7.034 |
-7.536*** |
-1.596 |
-1.812* |
||
|
5 |
lnPL |
αL |
-6.867 |
5.729*** |
-3.647 |
-3.763*** |
||
|
6 |
lnPF |
αF |
2.013 |
1.835* |
1.5424 |
1.7831* |
||
|
7 |
lnZCI |
β cI |
-9.663 |
-7.020*** |
-2.6443 |
-4.5738*** |
||
|
8 |
lnZAR |
βBR |
25.58 |
27.91*** |
5.294 |
5.886*** |
||
|
9 |
1/2 lnPpx lnPp |
φpp |
-105.61 |
-11.77*** |
-88.57 |
-92.04*** |
||
|
10 |
1/2lnpsxlnPs |
φss |
13.13 |
12.48*** |
-3.551 |
-3.62*** |
||
|
11 |
1/2lnPirrxlnPirr |
φirrirr |
-0.623 |
-10.72*** |
-4.183 |
-2.107** |
||
|
12 |
1/2lnPW xlnPw |
φww |
-0.1734 |
-0.8721ns |
1.182 |
1.381ns |
||
|
13 |
1/2lnPLxlnPL |
φLL |
71.86 |
72.89*** |
0.387 |
0.867ns |
||
|
14 |
1/2lnPFxlnPF |
φFF |
0.2517 |
0.4391ns |
0.328 |
0.227ns |
||
|
15 |
1/2lnZCI xlnZCI |
θCICI |
0.1920 |
1.8223* |
0.212 |
1.45ns |
||
|
16 |
1/2lnZAR x lnZAR |
θARAR |
65.47 |
73.87*** |
1.905 |
2.479* |
||
|
17 |
LnPpx LnPs |
φPS |
2.370 |
6.624*** |
3.211 |
8.425*** |
||
|
18 |
LnPp x lnPirr |
φpIrr |
-6.452 |
-15.59*** |
-2.274 |
-5.008*** |
||
|
19 |
LnPp xlnPw |
φpW |
69.19 |
63.17*** |
10.51 |
14.61*** |
||
|
20 |
LnPp xlnPL |
φpL |
-4.162 |
-9.277*** |
-0.253 |
-0.452ns |
||
|
21 |
LnPpxlnPF |
φpF |
-3.945 |
-8.663*** |
-3.63 |
-6.658*** |
||
|
22 |
LnPpx lnZCI |
τPCI |
-0.5458 |
-1.141ns |
1.58 |
4.431*** |
||
|
23 |
LnPP xlnZAR |
τPAR |
-34.71 |
-36.91*** |
-7.936 |
-10.67*** |
||
|
24 |
LnPsxLnPirr |
φsirr |
20.51 |
11.79*** |
8.397 |
9.674*** |
||
|
25 |
LnPsx LnPw |
φsw |
-203.58 |
-20.88*** |
-36.81 |
-42.49*** |
||
|
26 |
LnPs xLnPL |
φsL |
11.76 |
12.21*** |
-0.192 |
-0.283ns |
||
|
27 |
LnPs xLnPF |
φSF |
11.85 |
10.83*** |
12.98 |
16.98*** |
||
|
28 |
LnPs xLnZCI |
τSA |
2.817 |
2.073** |
-5.647 |
-7.161*** |
||
|
29 |
LnPs xLnZAR |
τSL |
104.88 |
10.95*** |
30.88 |
34.49*** |
||
|
30 |
LnPirr xLnPw |
φIrrw |
-0.996 |
-0.1363ns |
0.452 |
0.892ns |
||
|
31 |
LnPirr xLnPL |
φirrL |
0.520 |
1.942* |
0.0458 |
0.222ns |
||
|
32 |
LnPirr xLnPF |
φirrF |
0.3870 |
3.469*** |
-0.097 |
-1.213ns |
||
|
33 |
LnPirr xLnZCI |
τirrCI |
-0.3529 |
-3.8117*** |
0.2434 |
1.979** |
||
|
34 |
LnPirr xLnZAR |
τirrAR |
-0.4568 |
-0.5698ns |
-0.226 |
-0.674ns |
||
|
35 |
LnPW xLnPL |
φwL |
-1.886 |
-6.793*** |
-0.541 |
-1.876* |
||
|
36 |
LnPW xLnPF |
φWF |
-0.1379 |
-1.0551ns |
-0.0294 |
-0.237** |
||
|
37 |
LnPw xLnZCI |
τWCI |
-0.2677 |
-2.336** |
-0.0294 |
-0.1298ns |
||
|
38 |
LnPw xLnZAR |
τWAR |
4.8499 |
6.8082*** |
0.403 |
1.149ns |
||
|
39 |
LnPL xLnPF |
φLF |
-6.5334 |
-7.4704*** |
0.653 |
1.384ns |
||
|
40 |
LnPL xLnZCI |
τLCI |
-0.8397 |
-0.8210ns |
-0.788 |
-2.197** |
||
|
41 |
LnPL xLnZAR |
τLL |
0.0207 |
0.0215ns |
-0.063 |
-0.469ns |
||
|
42 |
LnPF xLnZCI |
τFCI |
-0.1668 |
-0.7821ns |
-0.179 |
1.5778ns |
||
|
43 |
LnPF xLnZAR |
τFAR |
-0.5718 |
-3.1364*** |
-0.206 |
2.774*** |
||
|
44 |
LnZCI xLnZAR |
φAL |
1.5796 |
1.3395ns |
-0.781 |
-1.914* |
||
|
|
Variance parameter |
|||||||
|
|
δ2= δ2u + δ2v |
δ2 |
0.6906 |
12.15*** |
0.0689 |
11.05*** |
||
|
|
γ= δ 2u / δ 2 |
γ |
0.9456 |
38.05*** |
0.9789 |
65.05*** |
||
|
|
Log likelihood |
-81.70 |
|
70.43 |
||||
|
|
No of observation |
N |
150 |
|
150 |
|||
Note: *** Significant at 1 percent level; ** Significant at 5 percent level; * Significant at 10 percent level.
Table 5: Factor explaining inefficiency.
|
Inefficiency Model |
|||||
|
|
|
Transplanting rice |
Direct seeded rice |
||
|
Variables |
Parameter |
Coefficient |
T-ratio |
Coefficient |
T-ratio |
|
Constant |
ω0 |
-12.38 |
-26.71*** |
-6.137 |
-3.991*** |
|
age |
ω1 |
-0.028 |
-3.285*** |
-0.939 |
-2.598*** |
|
Education |
ω2 |
-0.092 |
-2.247** |
-0.058 |
-2.603*** |
|
Experience |
ω3 |
-0.043 |
-3.675*** |
-0.011 |
-1.967** |
|
Extension Service |
ω4 |
-0.138 |
-1.706*** |
-0.125 |
-1.903* |
|
Household size |
ω5 |
0.059 |
3.116*** |
0.013 |
1.923* |
|
Tenancy Status |
ω6 |
-1.104 |
-4.420*** |
-0.292 |
2.403** |
|
Number of observation |
300 |
150 |
150 |
||
Note: *** Significant at 1 percent level; ** Significant at 5 percent level; * Significant at 10 percent level.
The coefficient of irrigation cost, fertilizer cost and dummy variable area under rice crop are positively significant at 1%. This is the expected result as the variables significantly contribute to increased rice productivity in both TRP and DRS systems and are also given by Aung (2011).
The coefficient of labor cost is negative and significant at 1% in the TRP system and in the DRS system, and is in line with the theory. Huge amount of labor is required for the transplantation of rice in the TRP system. Hence, an increase in number of labor would significantly contribute to increased profit under the TRP and DRA systems.
The coefficient of capital intensive cost is negative and significant at 5% indicating an increase in capital intensive cost leads to reduced farmer profit in both the TRP and DRS systems. The same results are seen in Rehman (2003) and Akramove and Malek (2012).
The square term pesticide cost in the profit frontier model, is statistically significant at 1% and maintains a negative sign at both initial and later stages. The result points out to the continued increase in pesticide cost leading to decrease in rice output at initial and later stages under both the systems. The square term of seed cost is negative and significant at 1% in the DRS system and positively significant in the TRP system indicating that an increase in seed cost would significantly contribute to increased rice productivity under the TRP system, therefore, TRP farmer profit will tend to increase.
The square terms of irrigation are negative and significant under the TRP system and positively significant under the DRS system, suggesting that increase in irrigation hours will increase rice productivity at both initial and later stages in the TRP system. Conversely, an increase in irrigation hours will adversely impact rice productivity at later stages under the DRS system thus, lowering its farmer profits.
Area under rice crop square term is statistically significant and positive both at initial and later stages under the two systems. On the other hand, the square terms of weedicide cost, labor cost, fertilizer cost and capital intensive cost are insignificant under both TRP and DRS systems.
The frontier model is having two statistically significant interaction terms, with positive and negative signs of cross-terms. The negative value of a cross term indicates the existence of substitute relationship between two input costs. Furthermore, the positive terms indicate complementary relationship between two input costs.
The hypothesis test that inefficiency effects are not random errors, is shown in the second part of the Table 3. The value of key parameter γ= δ2u/δ2 which is the ratio of error and it varies between zero and one. When γ=0, no inefficiency is present and γ =1 shows absence of random noise. The value of γ is close to 1, as shown in the Table 4 revealing the high inefficiency in rice farming. Moreover, in Table 4 the estimated gamma parameter (γ) 0.9456 in TRP system and 0.9789 in DRS system are highly significant at 1% level. This implies that one-sided random inefficiency component strongly dominates the measurement errors and other random disturbance indicates (94 percent under TRP system and 98 percent under DRS system) the variation in actual profit from maximum profit (profit frontier) between farms which primarily arise from differences in farmers’ practices rather than random variability (Kolawole, 2006).
Profit inefficiency model of TRP and DRS systems: Inefficiency model results are reported in Table 5. The estimated parameter of farmer age carries a negative sign and is statistically significant at 1% in both TRP and DRS profit inefficiency indices. The result show that higher the farmer age, lower the farmer profit inefficiency will be, implying that Pakistani farmers falling in higher age brackets will demonstrate significantly more profit than younger farmers. The reason behind the results may be due to older farmers having more information about their land and traditional practices (Aung, 2011).
The coefficient of education is also significant and carries the negative sign in both TRP and DRS profit inefficiency index. The scale of the estimated parameter reveals the profit inefficiency of farmer being reduced as number of famer education increases. In the targeted area, average number of farmers’ education is up to the level of primary. According to Abdulrahman et al. (2015) Efficiency of farmer is positively and significantly related with education. Farmer’s decision making and inclination towards adoption of innovative technologies, can increase crop production, is effected by literacy rate. Moreover, education not only enhances productivity but also enable farmers to cope up with latest technologies, resultantly efficiency increases, thus increasing profit. The results are harmonious with Huffman (1974) from United States, Ali and Flinn (1989) from Pakistan, Kumbhakar and Bhattarcharya (1992) from India.
The estimated coefficient of the farmer’s experience is also significant but carries negative sign in both TRP and DRS. This result reveals that profit inefficiency of farmers reduces as number of farmers’ experience increases and is in accordance with findings of Abedullah (2007). Experience on the farm is another factor to enhance productivity (Fatima et al., 2011). The experienced farmers could manage various farm practices with better level of efficiency.
The estimated parameter of extension contact is significant and negative in both TRP and DRS systems. In the area under study, the trend of farmers’ availing extension services is very slow. If farmers’ visits towards extension services center increases than farmers’ knowledge about new farm practices, adoption of new seed varieties and adoption of new ideas might be increased and these are in line the findings of Abeduallah et al. (2007), and Fatima and Khan (2015).
The estimated parameter of household size is significant and carries positive sign in both TRP and DRS systems meaning that an increase in the farmer household size would significantly lead to increase profit inefficiency of farmers. The same results are found by (Oladeebo and Oluwaranti, 2014; Munir et al., 2015).
The estimated parameter of tenancy status is significant at 1% level with negative sign in both TRP and DRS system. The results point out that tenants are efficient as compare to owner. So, they get high profit as compared to owner and Rehman (2002) obtained the same results. Small area under cultivation is one of the limitations tenants face, which puts the pressure of rent payment. The situation becomes even more challenging for them because of facing high variable cost and maintaining economic security of the families, alongside. In the presence of these factors, it becomes all the more difficult to achieve higher production levels.
Farm specific profit efficiency estimates: The summary statistics of the profit efficiency estimates are presented in Figure 1. The direct seeded rice farmers are more proficient as compared to transplanting rice farmers. The average profit efficiency of direct seeded and transplanted rice farmers is 0.83 and 0.57, respectively showing that on average direct seeded and transplanting rice farmers can increase profit by improving technical and allocative efficiencies. Around 42.9 percent transplanted rice farmers face profit efficiency less than 50%. While, 42 percent direct seeded rice farmers may attain profit efficiency ranging up to even 90-100%. Hence, there exists broad variation between direct seeded and transplanted rice farmers profit efficiency. On average, Direct seeded rice farmers have 26% more profit efficiency as compared to transplanted rice farmers.
Conclusions and Recommendations
The results entail that direct seeded farmers’ profit efficiency is high comparative to transplanted rice farmers. Through adopting direct seeded technique, farmers can get higher economic return. Furthermore, the results of inefficiency model suggest that government should focus on increasing the educational level of farming communities by opening more educational institutes in rural areas and develop policies to extend support to educated farmers by providing attractive incentives. Moreover, the government should allocate more funds to strengthen the agriculture department and improve the network of extension services in the rural areas.
Novelty Statement
This study finding will make an imperative contribution in the existing literature in the sense that it will help to comprehend the farmers regarding rice cultivating techniques that will gives the farmers more advantage in terms of cost effectiveness and yield. Moreover, this study will also help to draw conclusions for promoting a right package of technology that sustenance the rice growers to get higher economic returns.
Author’s Contribution
The main idea, investigation, result and discussion, and methodology are done by Dr. Hina Fatima (Corresponding Author). Overview, estimation, methodology and literature review is done by Sania Shaheen. Technical input and supervision is provided by Professor Dr. Lal K. Almas. Introduction and References are done by Sehrish Haroon.
Conflict of interest
The authors have declared no conflict of interest.
References
Abdulai, A. and W.E. Huffman. 1998. An examination of profit inefficiency of rice farmers in Northern Ghana. Iowa State University. Econ. Staff Pap. Ser. 298. https://lib.dr.iastate.edu/econ_las_staffpapers/298.
Abedullah, S.K. and K. Mushtaq. 2007. Analysis of technical efficiency of rice production in Punjab, Pakistan. Pak. Econ. Soc. Rev. 45(2): 231-244.
Abdulrahman, S., O. Yusuf and A.D. Suleiman. 2015. Profit efficiency of cocoyam production in Kaduna State, Nigeria. American. J. Exp. Agric. 7(4): 231-241. https://doi.org/10.9734/AJEA/2015/16219
Akhgari, H., 2004. Rice agronomy, fertilization, and nutrition. Islamic Azad university press, Rasht, Iran, pp. 376 (In Persian). Direct seeding: research strategies and opportunities. Inter. Rice Res. Inst. Los Banos, Philippines, pg. 15-42.
Abid, M., M. Ashfaq, S.Hassan and N. Fatima. 2011. A resource use efficiency analysis of Small BT cotton farmers in Punjab, Pakistan. Pak. J. Agric. Sci. 48(1): 65-71.
Ahmad, M., G.C. Mustafa and M. Iqbal. 2002. Wheat Productivity, efficiency and sustainability: A stochastic production frontier analysis. Pak. Dev. Rev. 41(1): 643-663. https://doi.org/10.30541/v41i4IIpp.643-663
Akhgari, H. and B. Kaviani. 2011. Assessment of direct seeded and transplanting methods of rice cultivators in the Northern part of Iran. Afr. J. Agric. Res. 6(31): 6492-6498. https://doi.org/10.5897/AJAR11.973
Ansah, I.G.K., H. Oduro and A.L. Osae. 2014. A comparative analysis of profit efficiency in Maize and Cowpea production in the Ejura Sekyedumase district of the Ashanti region, Ghana. Res. Appl. Econ. 6(4): 106-125. https://doi.org/10.5296/rae.v6i4.6320
Aung, N.M., 2011. Agricultural efficiency of rice farmers in Myanmar: A case study in selected areas. Institute of developing economies (IDE). Discuss. Pap. 306.2011.9. http://hdl.handle.net/2344/1088.
Akramov, K. and M. Malek. 2012. Analyzing profitability of maize, rice, and soybean production in Ghana: Results of PAM and DEA analysis. Ghana Strategy Support Program (GSSP) Working paper no. 28.
Ali, M. and J.C. Flinn. 1989. Profit efficiency among basmati rice producers in Punjab, Pakistan. Am. J. Agric. Econ. 71(1): 303 – 310. https://doi.org/10.2307/1241587
Ali, F., A. Parikh and M.K. Shah. 1994. Measurement of profit efficiency using behavioral and stochastic frontier approaches. Appl. Econ. 26(1): 181 – 188. https://doi.org/10.1080/00036849400000074
Awan, T.H., I. Ali, M.E. Safdar, M.M. Ashraf and M. Yaqub. 2007. Economic effect of different Plant establishment techniques on rice, Oryza Sativa production. J. Agric. Res. 45(1): 73-80.
Battese, G.E., and T.J. Coelli. 1995. A model for technical inefficiency effects in a stochastic frontier production function for panel data. Empiric. Econ. 20(2): 325-332. https://doi.org/10.1007/BF01205442
Farrell, M.J., 1957. The measurement of productive efficiency. J. R. Stat. Soc. Ser. A (General). 120(3): 253-281. https://doi.org/10.2307/2343100
Chaudhary, M.A., M.A. Khan, K.H. Naqvi and M. Ahmad. 1998. Estimates of farm output Supply and input demand elasticities: The translog profit function approach. Pak. Dev. Rev. 37(4): 1031-1050. https://doi.org/10.30541/v37i4IIpp.1031-1050
Fatima, H., and M.A. Khan. 2015. Influence of wheat varieties on technical efficiency and production of Wheat crop in Pakistan (In selected area of Punjab). Sarhad J. Agric. 56(1): 85-97. https://doi.org/10.2307/1239349
Huffman, W.E., 1974. Decision making: The role of education. Am. J. Agric. Econ. 56(1): 85-97.
Hyuha, T.S., B. Bashaasha, E. Nkonya and D. Kraybill. 2007. Analysis of profit inefficiency in Rice production in Eastern and Northern Uganda. African. J. Crop Sci. 15(4): 243-253.
Kumbhakar, S.C. and A. Bhattacharyya. 1992. Price distortions and resource use efficiency in Indian Agriculture: A restricted profit function approach. Rev. Eco. Stat. 74(1): 231 – 239. https://doi.org/10.2307/2109654
Kolawole, O., 2006. Determinants of profit efficiency among small scale rice farmers in Nigeria: A profit function approach. Res. J. App. Sci. 1(1): 116-122.
Khai, H.V. and M. Yabe. 2011. Technical efficiency analysis of rice production in Vietnam. J. Int. Soc. South. Asain Agric. Sci. 17(1): 135-146.
Munir, M.A., M. Hussain, M.A. Imran, S. Zia, H. Anwar, M. Ayub and I. Ghaffar. 2015. Analysis of profit efficiency in Sugarcane Production in District Sargodha, Punjab, Pakistan. Int. J. Econ. Com. Mange., 3(9): 649-658.
Murugaboopathi, C., M. Tomita, E. Yamaji and S. Koide. 1991. Prospect of large-sized paddy field using direct seeding supported by subsurface irrigation system. Am. Soc. Agric. Biol. Eng. 34(5): 2040-2046. https://doi.org/10.13031/2013.31834
Nguyen, N.V. and A. Ferrero. 2006. Meeting the challenges of global rice production. Paddy Water Environ. 4(1): 1-9. https://doi.org/10.1007/s10333-005-0031-5
Oladeebo, J.O. and A.S. Oluwaranti. 2014. Profit efficiency among cassava producers: Empirical evidence from South Western Nigeria. Middle. East. J. Scientific. Res. 19(12): 1566-1572.
Oluwaranti, A.S., M.O. Uzu, L.O., Olarinde and J.O. Oladeebo. 2014. Analysis of property rights and productive efficiencies among smallholder rice farmers in South western. J. Agric. Econ. Dev. 5(1): 1-13.
Pandey, S., and L. Velasco. 2005. Trends in crop establishment methods in Asia and research issues. In: Rice is Life: Scientific Perspectives for the 21st Century. Proc. Word Rice Res. Conf., 4-7 November 2004, Tsukuba, Japan. pp. 178-181.
Pandey, S., 2002. Direct seeding: research strategies and opportunities. Publ. Int. Rice Res. Inst. pp. 383.
Qaiser, I. and N. Sohail. 2013. Institutional credit and the profit efficiency of micro and small scale traders: Evidence from Faisalabad. J. Econ. Sust. Dev. 4(12): 1-9.
Rahman. S., 2002. Profit efficiency among Bangladesh rice farmers Manchester: University of Manchester. School of economic studies. Discussion paper series No. 0203. http://hummedia.manchester.ac.uk/schools/soss/economics/discussionpapers/EDP-0203.pdf
Rahman, S., 2003. Profit efficiency among Bangladeshi rice farmers. Food Policy. 28(5-6): 487-503. https://doi.org/10.1016/j.foodpol.2003.10.001
Rahman, M.C., C.N.B. Hussain, M.R. Hossain, M.S. Rahman and A. Chowdhury. 2015. Comparative profitability and efficiency analysis of rice farming in the coastal area of Bangladesh: The impacts of controlling saline water intrusion. J. Agric. Vet. Sci. 8(10): 89-97.
Sharif, N.R. and A. Dar. 1996. An empirical study of the patterns and sources of technical inefficiency in traditional and HYV rice cultivation in Bangladesh. J. Dev. Stud. 32(1): 612 – 629. https://doi.org/10.1080/00220389608422431
Tuong, T.P., B.A.M. Bouman and M. Mortimer. 2005. More rice, less water integrated approaches for increasing water productivity in irrigated rice-based systems in Asia. Plant Prod. Sci. 8(3): 231-241. https://doi.org/10.1626/pps.8.231
Wang, J., G.L. Cramer and E.J. Wailes. 1996. Production Efficiency of Chinese Agriculture: Evidence from rural household survey data. Agric. Econ. 15(1): 17- 28. https://doi.org/10.1111/j.1574-0862.1996.tb00417.x
Yasin, M.A., M. Ashfaq, S.A. Adil and K. Bakhsh. 2014. Profit efficiency of organic vs Conventional wheat production in rice-wheat zone of Punjab, Pakistan. J. Agric. Res. 52(3): 439-452.
Younas, M., M.A. Rehman, A. Hussain, L. Ali and M.Q. Waqar. 2015. Economic comparison of direct seeded and transplanted rice. Asian J. Agric. Biol. 4(1): 1-7.
To share on other social networks, click on any share button. What are these?


