

Prediction of Fattening Final Live Weight from some Body Measurements and Fattening Period in Young Bulls of Crossbred and Exotic Breeds using MARS Data Mining Algorithm


Prediction of Fattening Final Live Weight from some Body Measurements and Fattening Period in Young Bulls of Crossbred and Exotic Breeds using MARS Data Mining Algorithm
İbrahim Aytekin1,*, Ecevit Eyduran2, Koksal Karadas3, Rifat Akşahan4 and İsmail Keskin1
1Department of Animal Science, Faculty of Agriculture, University of Selcuk, Konya, Turkey
2Biometry Genetics Unit, Department of Animal Science, Agricultural Faculty, Igdir University, Igdir, Turkey
3Department of Agricultural Economics, Agricultural Faculty, Igdir University, Igdir, Turkey
4Bolvadin District Ministry of Food, Agriculture and Livestock, Bolvadin, Afyon, Turkey
ABSTRACT
The aim of this investigation was to develop a prediction equation for fattening final live body weight from several body measurements and fattening period of native, crossbred and exotic breeds. For this aim, a total of 103 young bulls were used. In the prediction of fattening final live weight as an output variable, several continuous predictors evaluated in the current study were: withers height (WH), back height (BH), front rump height (FRH), back rump height (BRH), body length (BL), back rump width (BRW), chest depth (CD) and chest circumference (CC). Also, the breed factor was considered as a nominal predictor and fattening period (FP) was accepted as an ordinal predictor. To obtain the prediction equation, the results of Multivariate Adaptive Regression Splines (MARS) data mining algorithm as a non-parametric regression technique was implemented. To measure predictive accuracy of MARS, model evaluation criteria such as coefficient of determination (R2), adjusted coefficient of determination (R2ADJ), SDRATIO and Pearson coefficient (r) between actual and predicted values in fattening final live weight were calculated. To reveal the highest predictive ability in the MARS algorithm, numbers of terms and basis functions were set at 21 and 45 where order of interactions was three. Except for CD, other predictors were entered into MARS model. MARS showed very high predictive capability (R2=0.9717, R2ADJ=0.9643, SDRATIO= 0.168 and r=0.986) for the data evaluated in the investigation. Also, GCV value of the MARS prediction equation was found as 409.83. In conclusion, it could be suggested that a very reliable prediction equation with the predictive accuracy of nearly 100 (%) was developed in practice by using MARS data mining algorithm, which a quite remarkable tool in the prediction of fattening final live weight with interaction effects of predictors and in description of breed standards, in the development of breeding strategies and especially in the detection of ideal fattening period for each breed under the condition.
Article Information
Received 17 February 2017
Revised 02 June 2017
Accepted 03 July 2017
Available online 05 January 2018
Authors’ Contribution
İA conceived and designed the study. RA collected the data. EE and IK statistically analyzed the data. İA, EE and İK interpreted data and wrote the article. KK and RA helped in interpreting the data.
Key words
Fattening performance, MARS algorithm, Data mining, Live weight prediction, Beef cattle.
DOI: http://dx.doi.org/10.17582/journal.pjz/2018.50.1.189.195
* Corresponding author: aytekin@selcuk.edu.tr
0030-9923/2018/0001-0189 $ 9.00/0
Copyright 2018 Zoological Society of Pakistan
Introduction
The prediction of body weight in farm animals is a useful tool for breeders who intend to make correct decisions on measuring the required feed quantity, medicinal dose and market price of the animals (Eyduran et al., 2017). In the event that there is scarcity of a weighing scale under rural conditions, it is an important option for breeders. Describing the relationship between the live weight and morphological characteristics from the viewpoint of animal breeding strategies contributes to breeders aiming to gain more qualified offspring and define responses to genetic selection (Lukuyu et al., 2016).
Many previous studies were available on the prediction of live body weight by means of morphological measurements in goats (Alex et al., 2010; Chitra et al., 2012; Eyduran et al., 2013; Ruhil et al., 2013; Eyduran et al., 2017), sheep (Mohammad et al., 2012; Ali et al., 2015) and cattle (Bozkurt, 2006; Bene et al., 2007; Bozkurt et al., 2007; Ozkaya and Bozkurt, 2009; Abdelhadi et al., 2011; Sawanon et al., 2011; Grzesiak et al., 2014; Hafiz et al., 2014; Ige et al., 2015; Paputungan et al., 2015; Siddiqui et al., 2015; Karadas et al., 2017). As in other farm animals, morphological characteristics are considered as selection criteria for growth in cattle. Several earlier reports were present on estimating the correlation coefficients between live weight and morphological characteristics in various cattle breeds. Bene et al. (2007) reported the correlations ranging from 0.40 to 0.80 between live weight and some morphological measurements at different cattle breeds i.e., Hereford, Hungarian Simmental and Angus. Body length (0.95) and hip height (0.92) of Brakmas cows were very strongly correlated with body weight (Hafiz et al., 2014). Ozkaya and Bozkurt (2009) stated that chest girth was a good predictor for predicting live weight of Brown Swiss and crossbred cattle. Similarly, it was also reported that heart girth was correlated to live body weight in crossbred dairy cattle in the smallholder farms of Kenya (Lukuyu et al., 2016). Siddiqui et al. (2015) found very high correlation (0.983) between live weight and heart girth in Sahiwal cattle. In Dhofari calves, Bahashwan (2014) recorded that live weight were correlated very strongly with withers height (0.934), body length (0.879), and heart girth circumference (0.957). Bozkurt (2006) reported that only heart girth (89.90% R2) was determined as the best predictor in the prediction of the live weight through simple linear regression analysis for Brown Swiss feedlot cattle under small-scale farms as also informed by Bahashwan (2014) who estimated live weight of Dhofari calves with a quite high predictive accuracy by using some significant predictors i.e., wither height (87.3 R2), heart girth circumference (91.5% R2), body length (77.3 %R2) and abdomen girth circumference (85.4 % R2) through simple regression analysis. Using only HG as a predictor, Lukuyu et al. (2016) estimated live weight with the predictive accuracy ranging from 59-76 %R2 for various cattle breed groups. Paputungan et al. (2015) informed that body volume (derived from body length and chest girth) in the body weight prediction was the best predictor in Ongole crossbred cows at different age groups (2.5 to 7.5 by 1.0). Whereas, more sophisticated statistic techniques may be still necessary for morphological characteristics affecting live body weight for cattle breeding studies. From this point of view, data mining algorithms may be a respectable choice in explaining the complex relationships between live weight and morphological measurements in the cattle.
In addition, previous reports published on the prediction of live body weight from morphological traits through data mining algorithms i.e. CHAID, CART and Exhaustive CHAID are rare in literature (Eyduran et al., 2017). However, published document on MARS data mining algorithm has not yet been ascertained for prediction of live weight in the cattle. Hence, the main purpose of this investigation was to develop a prediction equation for predicting fattening final live body weight by means of several body measurements and fattening period of crossbred and exotic breeds.
Material and Methods
Animal material
Data published previously by Aksahan and Keskin (2015) were used to make an application of Multivariate Adaptive Regression Splines (MARS) data mining algorithm. The data were composed of Holstein (38 heads), Simmental (27 heads), Brown Swiss (23 heads) and crossbred (15 heads) young bulls reared at Bolvadin district, Afyon province of Turkey. In the prediction of fattening final live weight (FFLW) as an output variable, several predictors (continuous variables) involved in the current study were: withers height (WH), back height (BH), front rump height (FRH), back rump height (BRH), body length (BL), back rump width (BRW), chest depth (CD) and chest circumference (CC). Also, breed (BREED) factor was considered as a nominal predictor and fattening period (FP) was accepted as an ordinal predictor.
We defined some abbreviations (BREED and FP) for categorical predictors in the MARS prediction model. For example; abbreviations of BREED are; BREED_HF, Holstein Friesian; BREED_BS, Brown Swiss; BREED_SIM, Simmental; BREED_CROB, Crossbred young bulls. Abbreviations of FP are; FP_4, FP of 4 months; FP_5, FP of 5 months; FP_6, FP of 6 months.
Descriptive statistics of continuous predictors under the study are presented in Table I.
Table I.- Descriptive statistics of continuous predictors in the study.
|
WH (cm) |
BH (cm) |
FRH (cm) |
BRH (cm) |
BL (cm) |
BRW (cm) |
CD (cm) |
CC (cm) |
FFLW kg) |
|
| Mean |
126.7 |
129.2 |
132.0 |
132.1 |
142.1 |
48.8 |
62.2 |
180.7 |
452.1 |
| SD |
6.1 |
56.0 |
6.1 |
5.3 |
7.9 |
4.0 |
3.9 |
10.6 |
72.8 |
WH, withers height; BH, back height; FRH, front rump height; BRH, back rump height; BL, body length; BRW, back rump width; CD, chest depth; CC, chest circumference; FFLW, fattening final live weight.
Statistical analysis
For the aim, MARS data mining algorithm, which is a non-parametric regression technique developed by Friedman (1991), were used to examine the complex relationships between a set of predictors and response variable. No assumptions about functional relationships between dependent variable and predictors are required for the MARS algorithm. It is a nonparametric statistical method that takes a basis for a divide and conquers strategy where the training data sets are divided into separate piecewise linear segments (splines) of different gradients (slope). The splines are linked smoothly to each other and, basis functions as piecewise curves provide analysts to flexibly model linear and non-linear effects. The connections point between the pieces is named as “knots”. The candidate knots were inserted at random location within the range of each predictor. MARS produces basis functions by considering all probable candidate knots and interactions among predictors in a stepwise procedure. To describe a pair of the basis functions, the forward procedure sets up the candidate knots at random location within the range of each predictor. The model constructed by MARS data mining algorithm at each stage specifies the knots and their pairs of basis functions with the objective to minimize residual variance. Until the complicated model is obtained, the procedure of including the basis functions persists. The redundant functions insignificantly contributing to the MARS are deleted by the backward procedure in the MARS (Zhang and Goh, 2016).
Finally, the MARS model was applied in the current study.

Where, Ŷ is the predicted value of the response variable, β0 is a constant, hkm(Xv(k,m)) is the basis function, in which v(k,m) is an index of the predictor employed in the mth component of the kth product and Km is the parameter limiting the order of interaction.
The maximum number of basis functions in the current analysis was 100 and the three-order interactions were used. After building the most complex MARS model, the basis functions that did not contribute much to the quality of the model performance were eliminated in the process of the so-called pruning based on the following generalized cross-validation error (GCV) (Kornacki and Ćwik 2005):

Where, n is the number of training cases, yi is the observed value of a response variable, yip is the predicted value of a dependent variable and M (λ) is a penalty function for the complexity of the model containing λ terms.
In the 10-fold cross-validation, the whole data set (103 records) was randomly split into 10 approx. equal parts of 10 or 11 records, from which nine were used to train a given type of a prediction model and one served as an independent test set. This procedure was repeated 10 times (Eyduran et al., 2017).
Formulas of the model evaluation criteria for estimating their predictive performance of the MARS algorithms are given below (Pearson correlation coefficient between actual and predicted values in FFLW) (Akin et al., 2017a, b, c):
Coefficient of Determination

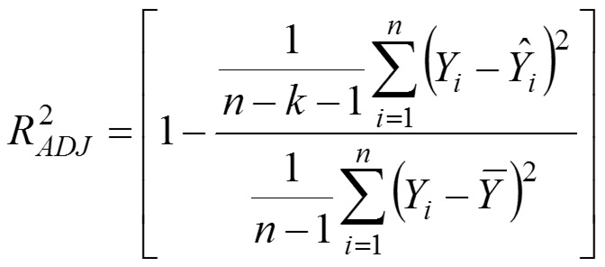
Adjusted Coefficient of Determination
Standard Deviation Ratio
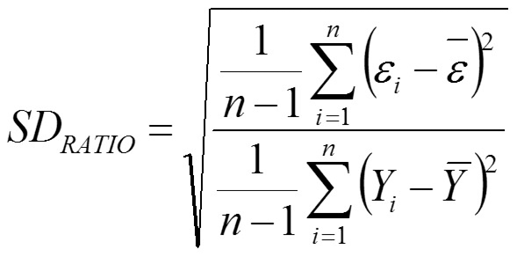
Where, Yi is the actual or observed FFLW (kg) value of ith bull, Ŷi is the predicted FFLW of ith bull, Ῡ is the average of the FFLW values of bull, ɛi is the residual value of ith bull, έ is the average of the residual values, k is the number of terms in the MARS model and n is the total number of bull. The residual value of each bull is expressed as ɛi = Yi - Ŷi.
The MARS model with the smallest GCV, SDRATIO and the highest coefficient of determination (R2), adjusted coefficient of determination (R2ADJ), and Pearson coefficient (r) between actual (observed) and predicted values in fattening final live weight was accepted as the best one. All the statistical evaluations were made through STATISTICA ver. 8.0 (trial version).
Results and Discussion
MARS data mining algorithm as a non-parametric regression technique has been implemented to construct the prediction equation for live weight by using morphological measurements and fattening period for the first time in literature. In order to calculate predictive accuracy of MARS, model evaluation criteria such as coefficient of determination (R2), adjusted coefficient of determination (R2ADJ), SDRATIO and Pearson coefficient (r) between actual and predicted values in fattening final live weight were calculated. To reveal the highest predictive ability in the MARS algorithm, numbers of terms and basis functions were set at 21 and 45 where order of interactions was three. With the exception of chest depth (CD), other predictors (withers height (WH), back height (BH), front rump height (FRH), back rump height (BRH), body length (BL), back rump width (BRW), chest depth (CD) and chest circumference (CC), fattening period (FP) and breed) were entered into MARS model. MARS showed very high predictive capability (R2=0.9717, R2ADJ=0.9643, SDRATIO= 0.168 and r=0.986) for the data evaluated in the investigation. Also, GCV value of the MARS prediction equation was found as 409.83. Figure 1 presents relative importance of predictors employed in the study.
The MARS model illustrated a perfect agreement in the predictive accuracy between actual and predicted values in fattening final live weight. Additionally, the current SDRATIO revealed that the reliable MARS model was constructed here. The available results were better in predicting fattening live weight than those recorded by Aksahan and Keskin (2015) working CHAID algorithm on the same data set previously (R2=0.8782, R2ADJ=0.8732 and 0.937). Comparing two correlation coefficients, we statistically found them to be different from each other (z value= 5.41, P=0.000). The authors reported that the heaviest fattening final live weight was possible with young bulls whose chest circumference was greater than 190 cm.
The prediction equation of the MARS algorithm in the study can be written as: FFLW = 342.4034+ 4.0263*max(0; CC–171.5) – 4.8117*max(0; 171.5–CC) + 9.3939*max(0; BRW–38) – 5.0898*max(0; BRW–38)*max(0; FP_4) – 2.8802*max(0; 147–BL) – 1.4547*max(0; 134–BH)*max(0; BL–147) – 6.8513*max(0; 147–BL)*max(0; FP_5) +0. 8199*max(0; WH–121)*max(0; 147-BL) – 0.0690*max(0; WH–121)*max(0; 147–BL)*max(0; BRW–46) – 0.1153*max(0; WH–121)*max(0; 147–BL)*max(0; 46–BRW) + 0.5530*max(0; BL–144)*max(0; BRW–38)*max(0; FP_4) + 5.4532*max(0; 135–BH) + 0.6886*max(0; 147–BL)*max(0; 48–BRW)*max(0; FP_5) – 0.046*max(0; BH–114.5)*max(0; 128.5–FRH)*max(0; CC–154) – 1.2679*max(0; 135–BH)*max(0; BREED_CROB) – 1.4492*max(0; 121–WH)*max(0; 147–BL)*max(0; BREED_SIM) + 0.1262*max(0; BH–131)*max(0; 136.5–BRH)*max(0; BRW–38) – 0.0345*max(0; 131–BH)*max(0; 136.5–BRH)*max(0; BRW–38) – 0.0830*max(0; FRH–129)*max(0; 136.5–BRH)*max(0; BRW–38) – 0.0724*max(0; WH–110)*max(0; CC–171.5)*max(0; FP_6).
The prediction equation obtained by the MARS algorithm obviously revealed interaction effects among significant predictors entered into the MARS model. This case might present a new perspective for cattle breeders compared with results of earlier studies conducted in the prediction of live body weight. We would like to predict FFLW (kg) for a young bull with Holstein Friesian (BREED_HF), FP=6 (FP_6), WH=130 cm, BH=133 cm, FRH=135 cm, BRH=134, BL=154 cm, BRW=50 cm, CD=67 cm and CC=190.5 cm.
For this Holstein Friesian bull (BREED_HF), max(0; BREED_HF)=1 otherwise zero. That is, if max(0; BREED_BS), max(0; BREED_SIM) and max(0; BREED_CROP) are present in the MARS prediction equation, max(0; BREED_BS)=0, max(0; BREED_SIM)=0 and max(0; BREED_CROB)=0. For FP= 6 in the Holstein Fresian bull, max(0; FP_6)=1 otherwise zero. In this case, max(0; FP_4)=0 and max(0; FP_5)=0.
FFLW = 342.4034+ 4.0263*max(0; 190.5–171.5) – 4.8117*max(0; 171.5–190.5) + 9.3939*max(0; 50–38) – 2.8802*max(0; 147–154) – 1.4547*max(0; 134–133)*max(0; 154–147) + 0.8199*max(0; 130–121)*max(0; 147-154) – 0.0690*max(0; 130–121)*max(0; 147–154)*max(0; 50–46) – 0.1153*max(0; 130–121)*max(0; 147–154)*max(0; 46–50) + 5.4532*max(0; 135–133) – 0.046*max(0; 133–114.5)*max(0; 128.5–135)*max(0; 190.5–154) + 0.1262*max(0; 133–131)*max(0; 136.5–134)*max(0; 50–38) – 0.0345*max(0; 131–133)*max(0; 136.5–134)*max(0; 50–38) – 0.0830*max(0; 135–129)*max(0; 136.5–134)*max(0; 50–38) – 0.0724*max(0; 130–110)*max(0; 190.5–171.5)= 497.4734 kg.
We predicted FFLW of this young bull as 497.473 kg.
Table II.- FFLW values according to breed and fattening period.
| Breed |
Fattening period (month) |
FFLW prediction (kg) |
FFLW value ($) |
| Holstein Simmental Brown Swiss |
4 |
449 |
1589 |
|
5 |
471 |
1667 |
|
|
6 |
493 |
1745 |
|
| Crossbreeds |
4 |
441 |
1561 |
|
5 |
463 |
1639 |
|
|
6 |
486 |
1720 |
1 FFLW = $3.54.
Table II shows FFLW values according to breed and fattening period for a young bull with WH=127 cm, BH=129 cm, FRH=132 cm, BRH=132 cm, BL=142, BRW=49, CD=62 cm and CC=181 cm. From Table 2, it was understood that the most income for each of Holstein Friesian, Simmental and Brown Swiss cattle breeds was obtained at 6th month ($ 1745). Corresponding income for crossbred cattle was obtained at 6th month ($ 1720). It was understood that the variability in CD did not affect FFLW because CD as an insignificant predictor was not included in the MARS model.
Model evaluation criteria (R2=0.9717, R2ADJ=0.9643, SDRATIO= 0.168 and r=0.986) estimated in the present study were found higher than R2 estimates reported by Bahashwan (2014) for classic regression models (Linear, Quadratic, Cubic etc.) in Dhofari calves. Sawanon et al. (2011) made lower estimates with 0.9328 and 0.8873 R2 for feedlot (hearth girth, body length, shoulder width and tail circumference) and grass fed (hearth girth, body length, shoulder width and hip width) groups in 504 male Kamphaengsaen beef cattle. Compared with our results, Lukuyu et al. (2016) reported much lower estimates (0.59 to 0.76 R2) in simple linear regression model for different cross-breed dairy cattle genotypes in Western Kenya with the only predictor (hearth girth). Bene et al. (2007) also recorded lower (0.68) R2 with three predictors (rump height, and shoulder width and haunch width) positively affecting the body weight for beef cows reared in Hungarian. The difference may be ascribed to the variability in breeds, ages of cattle and climate and managerial conditions. Use of various statistical approaches may cause various results on the predictive accuracy in cattle.
Applying body volume formula in the prediction of body weight in Ongole crossbred cows, Paputungan et al. (2015) concluded that body volume was described as the best predictor (0.92 to 0.98) having a positive effect on live weight in simple linear regression for the crossbred cows at different age groups varying between 2.5 and 7.5. Bozkurt et al. (2007) specified multiple linear regression equations with (body area, withers height, chest depth, hip width and height) in predicting live weight and found 0.556 to 0.667 R2 in beef cattle, which had very lower predictive accuracy compared to corresponding estimate in the MARS model here. Siddiqui et al. (2015) determined that significant predictors were body length (+), hearth girth (+), withers height (-) and body condition scores (-) in the prediction of live body weight of the Sahiwal cattle with a very high accuracy of 0.974 R2.
Using linear, quadratic and cubic regressions Ozkaya and Bozkurt (2009) predicted live weight of the Holstein Friesian (0.173 to 0.615 R2), Brown Swiss (0.739 to 0.944 R2) and Crossbreeds (0.637 to 0.898 R2) reared in Isparta and Burdur provinces of Turkey. These R2 figures were found lower compared with the present results reported here. Bozkurt (2006) found slightly lower than that those given in the present investigation.
When previous studies modeling only morphological traits were taken into consideration, MARS algorithm implemented in our study was superior to the earlier studies since MARS algorithm in the current study evaluated categorical and continuous predictors and their interactions. In this respect, exactly comparing the present MARS results and earlier results on classical regression analysis published in literature could not be made here. MARS is a flexible model that is provides to reveal interaction effects among predictors (Zhang and Goh, 2016) by minimizing residual variance.
To our best knowledge, MARS enabled us to achieve much higher predictive performance than previous studies in live weight prediction.
Conclusion
Use of MARS algorithm in the prediction of live body weight from morphological traits in sheep, goat and cattle has not yet been reported in literature. MARS prediction equation for predicting fattening final live body weight from several body measurements of young bulls showed a perfect fit of nearly 100(%). In conclusion, it could be advised that MARS data mining algorithm was a quite noteworthy tool in predicting FFLW with interaction effects of significant predictors and in the depiction of breed standards, in the development of effective breeding strategies and especially in the recognition of ideal fattening period for each breed under the condition. Information on interactions between predictors found significantly in the MARS might submit a new perspective in indirect selection criteria for breeding purposes.
Statement of conflict of interest
Authors have declared no conflict of interest.
References
Abdelhadi, O.M.A., Babiker, S.A. and Kijora, C., 2011. Estimation of zebu cattle carcass weight using body measurements. Livest. Res. Rural Develop., 23: Article 12. http://www.lrrd.org/lrrd23/1/abde23012.htm
Akin, M., Eyduran, E. and Reed, B.M., 2017b. Developing of optimal tissue culture medium for Hazelnuts. IX. International Congress on Hazelnut, 15-19 August, Atakum, Samsun, Turkey.
Akin, M., Eyduran, E. Niedz, R.P. and Reed, B.M., 2017c. Developing hazelnut tissue culture medium free of ion confounding. Plt. Cell Tissue Organ Cult. 130: 483-494.
Aksahan, R. and Keskin, I., 2015. Determination of the some body measurements effecting fattening final live weight of cattle by the regression tree analysis. Selçuk J. Agric. Fd. Sci., 2: 53-59.
Alex, R., Raghavan, K.C. and Mercey, K.A., 2010. Prediction of body weight of Malabari goats from body measurements under field conditions. J. Vet. Anim. Sci., 41: 21-27.
Ali, M., Eyduran, E., Tariq, M.M., Tirink, C., Abbas, F., Bajwa, M.A., Baloch, M.H., Nizamani, A.H., Waheed, A., Awan, M.A., Shah, S.H., Ahmad, Z. and Jan, S., 2015. Comparison of artificial neural network and decision tree algorithms used for predicting live weight at post weaning period from some biometrical characteristics in Harnai Sheep. Pakistan J. Zool., 47: 1579-1585.
Bahashwan, S., 2014. Application of morphometric traits for live body weight estimation in Dhofari calves. Int. J. scient. Res. agric. Sci., 1: 90-96.
Bene, S., Nagy, B., Nagy, L., Kiss, B., Polgar, J.P. and Szabo, F., 2007. Comparison of body measurements of beef cows of different breeds. Arch. Tierz., 50: 363-373.
Bozkurt, Y., 2006. Prediction of body weight from body size measurements in brown Swiss feedlot cattle fed under small-scale farming conditions. J. appl. Anim. Res., 29: 29-32. https://doi.org/10.1080/09712119.2006.9706565
Bozkurt, Y., Aktan, S. and Ozkaya, S., 2007. Body weight prediction using digital image analysis for slaughtered beef cattle. J. appl. Anim. Res., 32: 195-198. https://doi.org/10.1080/09712119.2007.9706877
Chitra, R., Rajendran, S., Prasanna, D. and Kirubakaran, A., 2012. Prediction of body weight using appropriate regression model in adult female Malabari goat. Vet. World, 5: 409-411. https://doi.org/10.5455/vetworld.2012.409-411
Eyduran, E., Zaborski, D., Waheed, A., Celik, S., Karadas, K. and Grzesiak, W., 2017. Comparison of the predictive Capabilities of several data mining algorithms and multiple linear regression in the prediction of body weight by means of body measurements in the indigenous beetal goat of Pakistan. Pakistan J. Zool., 49: 257-265. https://doi.org/10.17582/journal.pjz/2017.49.1.257.265
Hafiz, A.W.M., Idris, I. and Yaakub, H., 2014. Growth pattern for body weight, hip height and body length of Brakmas cattle. Pak. J. biol. Sci., 17: 952-955. https://doi.org/10.3923/pjbs.2014.952.955
Friedman, J.H., 1991. Multivariate adaptive regression splines (with discussion). Annls Stat., 19: 1-67. https://projecteuclid.org/download/pdf_1/euclid.aos/1176347963
Karadas, K., Tariq, M., Tariq, M.M. and Eyduran, E., 2017. Measuring predictive performance of data mining and artificial neural network algorithms for predicting lactation milk yield in indigenous Akkaraman sheep. Pakistan J. Zool., 49: 1-7. https://doi.org/10.17582/journal.pjz/2017.49.1.1.7
Lukuyu, M.N., Gipson, J.P., Savage, D.B., Duncan, A.J., Mujibi, F.B.N. and Okeyo, A.M., 2016. Use of body linear measurements to estimate live weight of crossbred dairy cattle in small holder farms in Kenya. SpringerPlus, 5: 3-14. https://doi.org/10.1186/s40064-016-1698-3
Ozkaya, S. and Bozkurt, Y., 2009. The accuracy of prediction of body weight from body measurements in beef cattle. Arch. Tierz., 52: 371-377.
Paputungan, U., Hakim, L., Ciptadi, G. and Lapian, H.F.N., 2015. Application of body volume formula for predicting live weight in Ongole crossbred cows. Int. J. Livest. Prod., 6: 35-40. https://doi.org/10.5897/IJLP2014.0243
Sawanon, S., Boonsaen, P. and Innuruk, P., 2011. Body measurements of male Kamphaengsaen beef cattle as parameters for estimation of live weight. Kasetsart J. (Nat. Sci.), 45: 428-434.
Siddiqui, M.U., Lateef, M., Bashir, M.K., Bilal, M.Q., Muhammad, G., Mustafa, M.I. and Rehman, S., 2015. Estimation of live weight using different body measurements in Sahiwal Cattle. Pak. J. Life Soc. Sci., 13: 12-15.
Zhang, W. and Goh, A.T.C., 2016. Multivariate adaptive regression splines and neural network models for prediction of pile drivability. Geosci. Front., 7: 45-52. https://doi.org/10.1016/j.gsf.2014.10.003
To share on other social networks, click on any share button. What are these?


