

Prediction of Body Weight of Turkish Tazi Dogs using Data Mining Techniques: Classification and Regression Tree (CART) and Multivariate Adaptive Regression Splines (MARS)


Prediction of Body Weight of Turkish Tazi Dogs using Data Mining Techniques: Classification and Regression Tree (CART) and Multivariate Adaptive Regression Splines (MARS)
Senol Celik1,* and Orhan Yilmaz2
1Department of Animal Science, Faculty of Agriculture, Bingol University, Bingol, Turkey
2Vocational High School of Posof, Ardahan University, Posof, Ardahan, Turkey
ABSTRACT
Body weight of dogs is crucial trait for breeding, racing and housekeeping. However, variables and factors that correctly estimate this trait are lacking. Here, we applied classification and regression tree (CART) and multivariate adaptive regression splines (MARS) approaches to estimate the most important variables in predicting the body weight of Turkish Tazi dogs. Using various body measurements, the CART algorithm proposed that withers height (WH), abdominal width (AW), rump height (RH) and chest depth (CD) can significant effect the body weight. Quantitatively, it was identified that values of WH > 62.500 cm and RH > 67.500 cm can positively correlated with the highest body weights. On the other hands, MARS model’s finding showed that the dogs which had the values of WH > 51 cm can be expected to have the highest body weights. The calculated model evaluation criteria of CART algorithm was R2=0.6889, Adj. R2=0.6810, r=0.830, SD ratio=0.5549, RMSE=1.1802, RRMSE=6.3838 and ρ=3.4884, respectively, whereas the calculated model evaluation criteria of MARS method were R2=0.9193, Adj. R2=0.8983, r=0.9588, SD ratio=0.2840, RMSE=0.6041, RRMSE=3.2635 and ρ=1.6661. Taken together, the MARS algorithm appeared to be efficient compared to CART algorithm since the MARS algorithm’s goodness-of-fit criteria yielded better results. Using MARS algorithm, the body weight of animals (dogs) can be predicted and exploited in different performances.
Article Information
Received 02 April 2017
Revised 27 July 2017
Accepted 27 September 2017
Available online 26 February 2018
Authors’ Contribution
OY provided the data and SC made statistical calculations and wrote the article. OY reviewed the article.
Key words
CART, MARS, Body size, Body weight.
DOI: http://dx.doi.org/10.17582/journal.pjz/2018.50.2.575.583
* Corresponding author: [email protected]
0030-9923/2018/0002-0575 $ 9.00/0
Copyright 2018 Zoological Society of Pakistan
Introduction
Turkish Tazi dogs have been bred in Turkey for centuries (Tepeli and Cetin, 2003). Recently, this breed is mainly raised in provinces of Konya and Sanliurfa (Yilmaz and Ertugrul, 2011). The Turkish Tazi (Sight Tazi) is a hunting breed and has been used for racing and hunting for decades (Serpell, 1996; Palika, 2007; Yilmaz, 2008). The average weight of mature Turkish Tazi dog is 19.0±0.25 kg for males, and 17.8±0.28 kg for females, while its average shoulder height is 3.1±0.47 cm for males, and 61.0±0.48 cm for females (Yılmaz, 2008; Yılmaz and Ertuğrul, 2011). The average withers height of a Turkish Tazi dog is 70 cm, and its average body weight is 24 kg (Tepeli, 2003). These body parameters including light weight and slim body structure favor the hunting capabilities of this breed.
Several data mining practices are being practiced in various fields of livestock to estimate the body, which is one of the most important traits for selection. The multivariate adaptive regression splines (MARS) has been proposed for livestock, however, this approach has not yet been implemented to predict the body weight in dog husbandry. The data-mining MARS has been applied for the detection of artificial insemination problems in cattle (Grzesiak et al., 2010). Of the different prediction methodologies applied so far, following variables have the greatest contribution to the determination of an insemination class: the length of calving interval, body condition score, pregnancy duration, artificial insemination age, milk yield, milk fat, protein content, and lactation number (Grzesiak et al., 2010).
CART (Classification and Regression Tree) and NBC (Naïve Bayesian Classifier) methods, applied for the detection of cows with conception problems, also yielded useful results. Applying these approaches, most important input variables for CART included the duration between calving and conception, calving interval and the difference between the mean body condition score and condition score at artificial insemination (Grzesiak et al., 2011). Topal et al. (2010) have identified factors affecting birth weight in Swedish red cattle using regression tree analysis. According to their obtained outcome, the most significant variables affecting birth weight were birth type, birth season, sex and body condition score of dam during birth.
Recently, Celik and Yilmaz (2017) have applied Chi-square automatic interaction detector (CHAID) algorithm for the determination of the body weight of Karabash dogs. Employing CHAID algorithm, Eyduran et al. (2016) have found that the fleece weight of Akkaraman (47 heads) and Awassi (108 heads) ewes could be predicted from variables such as staple length (SL), fiber length (FL), average number of crimps over (ANC) (with a length of 5 cm) and wool fineness (WF). Recently the decision tree diagram was also constructed through CART algorithm to determine the milk yield in indigenous Akkaraman sheep (Karadas et al., 2017). These studies collectively highlight the potential of modeling body parameters and prediction of performance traits in animals. Limited information is available on application of these algorism in canine. Study was designed to determine and classify factors of various body measures, which affect body weight of Turkish Tazi dogs through CART algorithm and MARS model.
Materials and MethodS
Materials
The 122 Tazi dogs from Konya, Sanliurfa, Igdir and Kars provinces were collected and investigated. The ages of Tazi dogs ranged between 3 months and 7 years. The average age of dogs was 1.887 years, with a standard deviation of 1.403 years. Some morphological characteristics of Turkish Tazi (Yilmaz, 2007) are listed in Table I.
Table I.- Measurements of various morphological characteristics of Turkish Tazi dogs.
| Variables |
Mean |
Standard deviation (SD) |
|
| AW | Abdominal width (cm) |
21.914 |
1.858 |
| AD | Abdominal depth (cm) |
14.270 |
1.570 |
| BL | Body length (cm) |
60.328 |
4.325 |
| BW | Body weight (kg) |
18.402 |
4.325 |
| CC | Chest circumference (cm) |
63.287 |
4.601 |
| CD | Chest depth (cm) |
22.762 |
2.946 |
| CW | Chest width (cm) |
17.324 |
1.724 |
| EL | Ear length (cm) |
12.270 |
1.398 |
| FSC |
Front shank circumference(cm) |
10.217 |
0.774 |
| HL | Head length (cm) |
23.680 |
2.362 |
| LL | Leg length (cm) |
39.238 |
2.193 |
| TL | Tail length (cm) |
44.730 |
4.057 |
| RW | Rump width (cm) |
16.205 |
1.290 |
| RH | Rump height (cm) |
62.221 |
3.896 |
| WH | Withers height (cm) |
62.000 |
3.853 |
Methods
CART approach was first presented by Breiman et al. (1984) for building decision trees. The CART uses learning sample of a set of historical data with pre-assigned classes for all observations. It is a supervised learning classification algorithm, which uses the training sample to construct and evaluate the model. The CART consists of two elements: the first one is to find a best feature from all of the input features for grouping; the second is to determine an optimal separation threshold from within the range of the feature. In regression tree, the least squared deviation (LSD) impurity measurement method is used for splitting rules and goodness-of-fit criteria. In the LSD measure, R(t) refers simply to the weighted within node variance for node t, and is equal to the substitution estimate of risk for the node (Breiman et al., 1984). It is defined as:
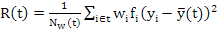
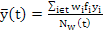
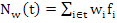
Where, Nw(t) is the the weighted number of records in node t, ωi is the value of the weighting field for record i (if any), fi is the value of the frequency field (if any), yi is the value of the target field, and Ῡ(t) is the mean of the dependent variable (target field) at node t. The LSD criterion function for split s at node t is defined as:
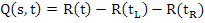
Where, R(tR) is the sum of squares of the right child node and is the sum of squares of the left child node. The split is chosen to maximize the value of Q(s, t).
CART system (Breiman et al., 1984) employs a tree pruning method that is based on trading off predictive accuracy versus tree complexity. This trade-off is governed by a parameter that is optimized using cross-validation.
The MARS, the second approach applied in this study, was proposed by Friedman (1991) as a procedure to determine relationships between a set of input variables and the target. The resultant model can be additive or include interactions among variables. MARS makes no assumptions about the underlying functional relationships between dependent and independent variables. It is a method based on a divide-and-conquer strategy in which the training data sets are partitioned into separate piecewise linear segments (splines) of differing gradients. In general, the splines are smoothly connected to each other, and these piecewise curves, also known as basis functions (BF), result in a flexible model that can handle both linear and nonlinear behaviors. The connection points between the pieces are referred as knots. By marking the end of one region of data and the beginning of another, the candidate knots are placed at random positions within the range of each input variable.
MARS generates BF by stepwise searching over all possible univariate candidate knots, and across interactions among all variables. An adaptive regression algorithm is admitted for selecting the knot locations automatically. The MARS algorithm involves a forward phase and a backward phase. The forward phase places candidate knots at random positions within the range of each estimator variable to define a pair of BF. At each step, the model adapts the knot and its suitable pair of BFs to yield the maximum reduction in sum-of-squares residual error. This process of adding BFs continues until the maximum number is reached, which usually results in a very complicated and overfitted model. The backward phase involves deleting the redundant BFs that made the least contribution to the model goodness of fit.
MARS is essentially a combination of spline regression, stepwise model fitting and recursive partitioning, and it is able to reveal the underlying nonlinear patterns hidden in complex data sets (Storlie et al., 2009).
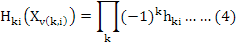
The principle of the MARS system is established on piecewise linear basis functions defined by Friedman (1991) as:


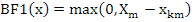
Where, t refers to the knots. The above formulations serve as the basis functions for linear or nonlinear development that estimates the function f(x). |.|+ means the positive part. These functions are also known as reflected pairs, mirror-image functions, and can be defined for each input variable Xm at its observed values xkm, k=1,2,…,n as follows:
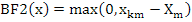
If a dependent variable “y” is dependent on “M” terms, then the MARS model can be expressed in Equation 3 (Friedman, 1991):
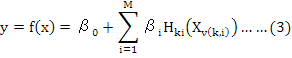
Where, βo and βi refer to the basis function parameters of the model, and the function H can be defined as in Equation 4 (Friedman, 1991):
Where, xv(k,i) refers to the estimator in the kth component of the ith product. For order of interactions K=1, the model is additive, and if K=2, the model is pairwise interactive (Friedman, 1991).
In order to choose the best subset model using MARS, a generalized cross validation (GCV) criterion is used (Craven and Wahba, 1979). GCV is calculated as in Equation 5 (Hastie et al., 2009):
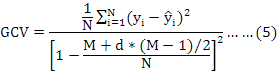
Where, N is the number of observations yi is the dependent variable, Ŷi denotes the MARS predicted values, d is a penalty for each basis function included in the developed sub-model, M is the number of BF. The effective degree of freedom is the means by which the GCV error functions impose a penalty on adding variables to the model (Steinberg, 2001).
The definitions of RRMSE and ρ are based on studies performed by Gandomi and Roke (2013). Formulae of the goodness-of-fit criteria measured for comparing the predictive performance of the algorithms are as follows (Grzesiak and Zaborski, 2012; Ali et al., 2015):
Coefficient of Determination

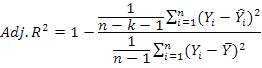
Adjusted Coefficient of Determination
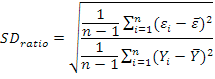
Standard Deviation Ratio
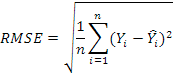
Root-mean-square error (RMSE)
Relative root mean squared error (RRMSE)
Table II.- Model evaluation criteria and GCV values according to order of interactions.
| Order of int. |
Number of BF |
GCV |
r |
R2 |
Adj. R2 |
SDratio |
RMSE |
RRMSE (%) |
ρ (%) |
| 2 |
30 |
1.1256 |
0.9402 |
0.8839 |
0.8609 |
0.3408 |
0.7248 |
3.9153 |
2.0180 |
| 2 |
40 |
1.1124 |
0.9284 |
0.8620 |
0.8410 |
0.3715 |
0.7900 |
4.2673 |
2.2128 |
| 2 |
50 |
1.1930 |
0.9121 |
0.8319 |
0.8117 |
0.4100 |
0.8720 |
4.7100 |
2.4632 |
| 2 |
60 |
1.1559 |
0.9289 |
0.8629 |
0.8405 |
0.3703 |
0.7876 |
4.2543 |
2.2056 |
| 2 |
70 |
1.1256 |
0.9402 |
0.8839 |
0.8609 |
0.3408 |
0.7246 |
3.9138 |
2.0172 |
| 3 |
30 |
1.1249 |
0.9243 |
0.8543 |
0.8337 |
0.3817 |
0.8118 |
4.3854 |
2.2789 |
| 3 |
40 |
1.0969 |
0.9358 |
0.8757 |
0.8539 |
0.3526 |
0.7500 |
4.0509 |
2.0926 |
| 3 |
50 |
1.0969 |
0.9358 |
0.8757 |
0.8539 |
0.3526 |
0.7500 |
4.0509 |
2.0926 |
| 3 |
60 |
1.1249 |
0.9243 |
0.8543 |
0.8337 |
0.3817 |
0.8118 |
4.3854 |
2.2789 |
| 3 |
70 |
1.1249 |
0.9243 |
0.8543 |
0.8337 |
0.3817 |
0.8118 |
4.3854 |
2.2789 |
| 4 |
30 |
1.1912 |
0.9160 |
0.8390 |
0.8179 |
0.4013 |
0.8534 |
4.6097 |
2.4059 |
| 4 |
40 |
1.1679 |
0.9409 |
0.8853 |
0.8612 |
0.3388 |
0.7205 |
3.8916 |
2.0051 |
| 4 |
50 |
1.1298 |
0.9486 |
0.8999 |
0.8761 |
0.3167 |
0.6736 |
3.6382 |
1.8671 |
| 4 |
60 |
1.1298 |
0.9486 |
0.8999 |
0.8761 |
0.3167 |
0.6736 |
3.6382 |
1.8671 |
| 4 |
70 |
1.0108 |
0.9588 |
0.9193 |
0.8983 |
0.2840 |
0.6041 |
3.2635 |
1.6661 |
| 5 |
70 |
1.3016 |
0.8861 |
0.7851 |
0.7678 |
0.4636 |
0.9860 |
5.3261 |
2.8239 |
| 6 |
70 |
1.1259 |
0.9459 |
0.8948 |
0.8714 |
0.3244 |
0.6899 |
3.7266 |
1.9151 |
| 7 |
70 |
1.1259 |
0.9459 |
0.8948 |
0.8714 |
0.3244 |
0.6899 |
3.7266 |
1.9151 |
BF, basis functions, int., interactions.
Performance index (ρ)

Where, Yi is the observed BW (kg) value of ith Turkish Tazi, Ŷi is the predicted BW of ith Turkish Tazi, Ῡ is the average of the BW values of Turkish Tazi, ɛi is the residual value of ith Turkish Tazi, έ is the average of the residual values, k is the number of terms in the MARS model, and n is total number of Turkish Tazi. The residual value of each observation is expressed as ɛi = Yi - Ŷi.
The MARS model with the smallest GCV, RMSE, SDratio and the highest coefficient of determination (R2), adjusted coefficient of determination (Adj. R2), and Pearson coefficient (r) between observed and estimated values in live weight was appropriated as the best one. CART algorithm was performed by SPSS ver. 22 (IBM Corp., Armonk, NY, USA) and MARS model was performed using STATISTICA ver. 12.5 (StatSoft Inc., Tulsa, OK, USA).
Results
In CART algorithm, minimum parent-child node ratio of 6:3 was taken into consideration. The calculated model evaluation criteria of the decision tree were estimated as 0.6889 R2, 0.6810 Adj. R2 and the correlation coefficient between the observed and estimated BW values was found as 0.830. SD ratio was estimated as 0.5549, RMSE was calculated as 1.1802, RRMSE 6.3838 and ρ as 3.4884.
CART algorithm formed a regression tree structure, and its outcome is expressed in Figure 1.
MARS data mining algorithm has been implemented as a non-parametric regression technique to obtain the prediction equation for live weight using morphological measurements. The values obtained using the most suitable model were as follow: R2=0.9193, Adj. R2=0.8983, SDratio=0.2840, RMSE=0.6041, RRMSE=3.2635, ρ=1.6661, r=0.9588 and GCV=1.0108.
To reveal the best predictive ability in the MARS algorithm, numbers of terms and basis functions were set at 30 and 70 where order of interactions was 7. Abdominal width (AW), belly girth (BG), body length (BL), chest circumference (CC), chest depth (CD), face length (FL), front shank circumference (FSC), head circumference (HC), head length (HL), head width (HW), leg length (LL), tail length (TL), rump width (RW), withers height (WH) and age were entered into MARS model. The 4th order of interaction in MARS modeling was taken into consideration (Table II). The knots of independent variables are shown in Table III.
The MARS model can be written in the form presented in Table IV.
Table III.- Knots of independent variables.
| Independent variables | Knots |
| Age | 2 |
| Withers Height | 51 |
|
Rump Height |
62 |
| Body Length | 49 and 57 |
| Chest Girth | 52, 68 and 69 |
| Chest depth | 15 and 26 |
| Abdominal depth | --- |
| Chest width | 14 |
| Rump width | 13 and 17 |
| Abdominal width | 17 |
| Tail length | 47 |
| Leg length | 42 |
| Front shank circumference | 9 |
| Head length | 17, 22 and 25 |
| Ear length | --- |
In a nutshell, the effect on body weight is increased when calculated WH exceeds 51 cm, and model coefficient reaches to 0.57446. The effect on the body weight is on positive direction and the model coefficient is 0.37897 when RH > 62 cm and FSC > 9 cm. The effect on the body is 0.70084 when Age > 2, RH < 62 cm and FSC > 9 cm. Accordingly, the body weight will increase. The effect on the body weight is 0.41990 when LL < 42 cm, thereby the body weight will increase. The effect on the body weight is 0.00864 when RH > 62 cm, AW > 17 cm, TL < 47 cm and FSC > 9 cm, thereby the body weight will decrease.
The chart indicating the actual values of the body weight together with estimated body weight values obtained by CART algorithm is presented in Figure 2A. It was observed that the actual values and estimated values are generally inter-compatible.
The chart indicating the actual values of the body weight together with estimated values obtained by MARS algorithm is presented in Figure 2B. It was noticed that the actual values and estimated values are inter-compatible. Therefore it can be concluded that the actual and estimated values are relatively close to each other.
Table IV.- Basis functions and parameters of the MARS model for body weight of Turkish Tazi dogs with different body characteristics values.
| BF | Equation |
Coefficients |
| Intercept |
10.52074 |
|
| BF1 | max(0; WH-51) |
0.57446 |
| BF2 | max(0; RH-62)*max(0; FSC-9) |
0.37897 |
| BF3 | max(0; 62-RH)*max(0; FSC-9) |
–0.78955 |
| BF4 | max(0; WH-51)*max(0; CD-26) |
–0,08305 |
| BF5 | max(0; RW-17) |
–6.39286 |
| BF6 | max(0; RH-62)*max(0; FSC-9)*max(0; HL-22) |
–0.09830 |
| BF7 | max(0; RH-62)*max(0; FSC-9)*max(0; 22-HL) |
–0.06075 |
| BF8 | max(0; WH-51)*max(0; 26-CD)*max(0;HL-25) |
0.03517 |
| BF9 | max(0; WH-51)*max(0; 26-CD)*max(0; 25-HL) |
0.01013 |
| BF10 | max(0; RH-62)*max(0; CG-69)*max(0; FSC-9)*max(0; HL-22) |
–0.02194 |
| BF11 | max(0; RH-62)*max(0; CW-14)*max(0; FSC-9)*max(0; HL-22) |
0.01129 |
| BF12 | max(0; WH-51)*max(0; BL-57)*max(0; 26-CD)*max(0; 25-HL) |
–0.00157 |
| BF13 | max(0; WH-51)*max(0; RW-17) |
0.52839 |
| BF14 | max(0; WH-51)*max(0; 17-RW)*max(0; AW-17) |
0.01026 |
| BF15 | max(0; WH-51)*max(0; CG-52)*max(0; 26-CD)*max(0; HL-25) |
-0.00299 |
| BF16 | max(0; CD-15)*max(0; 17-RW) |
-0.11748 |
| BF17 | max(0; WH-51)*max(0; CG-68)*max(0; 17-RW) |
0.02953 |
| BF18 | max(0; Age-2)*max(0; 62-RH)*max(0; FSC-9) |
0.70084 |
| BF19 | max(0; 2-Age)*max(0; 62-RH)*max(0; FSC-9) |
0.36847 |
| BF20 | max(0; Age-2)*max(0; 62-RH)*max(0; BL-49)*max(0; FSC-9) |
-0.05685 |
| BF21 | max(0; RH-62)*max(0; 47-TL)*max(0; FSC-9)*max(0; HL-22) |
0.01613 |
| BF22 | max(0; 62-RH)*max(0; RW-13)*max(0; FSC-9)*max(0; HL-17) |
0.02571 |
| BF23 | max(0; 42-LL) |
0.41990 |
| BF24 | max(0; RH-62)*max(0; AW-17)*max(0; 47-TL)*max(0; FSC-9) |
-0.00864 |
Discussion
In this study, SD ratio values of applied algorithms (CART and MARS models) were calculated as 0.5549, and 0.2840, respectively. It could be recommended that the algorithm whose SD ratio was less than 0.40 or between 0 and 0.10 had a good fit or a very good fit (Grzesiak and Zaborski, 2012). Hence, the SDratio=0.2840 obtained by the MARS model is a valuable approach to be implemented.
In a study by Yakubu (2012), MARS algorithm was used for the first time in the prediction of body weight of the Mengali rams. When first order of interaction in MARS modeling was considered, it was revealed that age and interaction of some testicular traits were significant predictors in the body weight estimation of Mengali rams. Similarly, Khan et al. (2014) found that 84.4 % (R2) of the variability of body weight in Hernai sheep was explained by face length, withers height, chest girth and body length parameters using the exhaustive CHAID algorithm from Regression Tree Analysis.
Recently, the body weight of Hernai sheep was predicted using the parameters such as sex, withers height, face length, and length between ears, significant factor using Exhaustive CHAID (Ali et al. 2015). The Pearson correlation coefficients (r) between observed and predicted body weight values for exhaustive CHAID algorithm was found as 0.918. The coefficients of determination (R2 %), adjusted coefficients of determination (Adj. R2 %), SD ratio and RMSE were 84.210%, 83.805%, 0.397 and 1.488, respectively.
Eyduran et al. (2016) have also observed that Awassi sheep with both staple length (SL) > 13 cm and fiber length (FL) < 15 cm produced the heaviest fleece weight (FW) on average, and that Akkaraman sheep was the group that had the lightest FW on average (1.904 kg) through CHAID algorithm. None of all the analyzed characteristics influenced FW trait of Akkaraman sheep, and FL solely influenced FW of Awassi sheep with SL > 13 cm. Eyduran et al. (2017) predicted the body weight of indigenous Beetal goat of Pakistan from body measurements through the CART and CHAID algorithms. The SD ratio and RMSE were found as 0.5308 and 4.1569, respectively through CHAID algorithm. Also, SD ratio and RMSE were found 0.5706 and 4.4687, respectively, through CART algorithm.
Taking all these studies into account, the findings obtained in the current study and previously conducted research cannot truly be compared owing to the use of different animal, traits, variables, sample size and different statistical techniques.
Conclusions
According to the results of CART algorithm, the highest body weight of 22.188 kg was calculated for the Turkish Tazi whose RH was higher than 67.500 cm and WH was higher than 62.500 cm. According to the results of the MARS model, when Turkish Tazi dogs had age > 2 years, RH < 62 cm and FSC > 9 cm, its predicted body weight was increased. In contrast, MARS model had higher performance with RMSE of 0.6041, SD ratio of 0.2840, RRMSE of 3.2635, ρ=1.6661 and coefficient of determination was found as R2 = 0.9193, while CART algorithm had lower performance score with the value R2=0.6889, SD ratio=0.5549, RMSE=1.1802, RRMSE of 6.3838, and ρ=3.4884. Based on these findings, MARS model can be considered as computationally efficient than CART algorithm. The superiority of the MARS algorithm may be due to flexible models based on linear regression and data-driven stepwise searching, adding and pruning. In future, these approaches can be applied to estimate multiple traits in livestock species and MARS explicitly defines the knots for each design input variables.
Statement of conflict of interest
Authors have declared no conflict of interest.
References
Ali, M., Eyduran, E., Tariq, M.M., Tirink, C., Abbas, F., Bajwa, M.A., Baloch, M.H., Nizamani, A.H., Waheed, A., Awan, M.A., Shah, S.H., Ahmad, Z. and Jan, S., 2015. Comparison of artificial neural network and decision tree algorithms used for predicting live weight at post weaning period from some biometrical characteristics in Harnai sheep. Pakistan J. Zool., 47: 1579-1585.
Breiman L., Friedman, J.H., Olshen, R.A. and Stone, C.J., 1984. Classification and regression tree. Wadsworth International Group, Monterey, California, USA, pp. 26-38.
Celik, S. and Yilmaz, O., 2017. Comparison of different data mining algorithms for prediction of body weight from several morphological measurements in dogs. J. Anim. Pl. Sci., 27: 57-64.
Craven, P. and Wahba, G., 1979. Smoothing noisy data with spline functions. Estimating the correct degree of smoothing by the method of generalized cross-validation. Numb. Mathem., 31: 317-403.
Eyduran, E., Zaborski, D., Waheed, A., Celik, S., Karadas, K. and Grzesiak, W., 2017. Comparison of the predictive capabilities of several data mining algorithms and multiple linear regression in the prediction of body weight by means of body measurements in the indigenous beetal goat of Pakistan. Pakistan J. Zool., 49: 257-265. https://doi.org/10.17582/journal.pjz/2017.49.1.257.265
Eyduran, E., Keskin, I., Erturk, Y.E., Dag, B., Tatliyer, A., Tirink, C., Aksahan, R. and Tariq, M.M., 2016. Prediction of fleece weight from wool characteristics of sheep using regression tree method (CHAID Algorithm). Pakistan J. Zool., 48: 957-960.
Friedman, J.H., 1991. Multivariate adaptive regression splines. Annls. Stat., 19: 1-141. https://doi.org/10.1214/aos/1176347963
Gandomi, A.H. and Roke, D.A., 2013. Intelligent formulation of structural engineering systems. In: Seventh MIT conference on computational fluid and solid mechanics-focus: Multiphysics and multiscale, 12-14 June, Cambridge, USA.
Grzesiak, W. and Zaborski, D., 2012. Examples of the use of data mining methods in animal breeding. (Book) ISBN 978-953-51-0720-0. https://doi.org/10.5772/50893
Grzesiak, W., Zaborski, D., Sablik, P. and Pilarczyk, R., 2011. Detection of difficult conceptions in dairy cows using selected data mining methods. Anim. Sci. Pap. Rep., 29: 293-302.
Grzesiak, W., Zaborski, D., Sablik, P., Żukiewicz, A., Dybus, A. and Szatkowska, I., 2010. Detection of cows with insemination problems using selected classification models. Comput. Electron. Agric., 74: 265-273. https://doi.org/10.1016/j.compag.2010.09.001
Hastie, T., Tibshirani, R. and Friedman, J., 2009. The elements of statistical learning: Data mining, inference and prediction, second ed. Springer. https://doi.org/10.1007/978-0-387-84858-7
Jekabsons, G., 2010. Vari Reg: A software tool for regression modelling using various modeling methods. Riga Technical University.
Karadas, K.,Tariq, M., Tariq, M.M. and Ecevit, E., 2017. Measuring predictive performance of data mining and artificial neural network algorithms for predicting lactation milk yield in indigenous Akkaraman sheep. Pakistan J. Zool., 49: 1-7. https://doi.org/10.17582/journal.pjz/2017.49.1.1.7
Khan M.A., Tariq, M.M., Eyduran, E., Tatliyer, A., Rafeeq, M., Abbas, F., Rashid, N., Awan, M.A. and Javed, K., 2014. Estimating body weight from several body measurements in Harnai sheep without multicollinearity problem. J. Anim. Pl. Sci., 24: 120-126.
Palika, L., 2007. The Howell book of dogs: The definitive reference to 300 breeds and varieties. John Wiley Sons.
Serpell, J.A., 1996. The origins of the domestic dog. In: International symposium on Turkish shepherd dogs (eds. C. Tekinsen and C. Tepeli), First ed. Faculty of Veterinary Print Unit, University of Selcuk, Konya, pp. 7-18.
Steinberg, D., 2001. An alternative to neural networks: Multivariate adaptive regression splines (MARS), PC AI, January/February, pp. 38 -41.
Storlie, C.B., Swiler, L.P., Helton, J.C., and Sallaberry, C.J., 2009. Implementation and evaluation of nonparametric regression procedures for sensitivity analysis of computation all demanding models. Reliab. Engin. Syst. Safe., 94: 1735-1763. https://doi.org/10.1016/j.ress.2009.05.007
Tepeli, C., 2003. Some morphological characteristics in Turkish Tazi (Turkish hunting dog). Small Pet Veterinary Congress, Bursa, pp. 124.
Tepeli, C., and Cetin, O., 2003. Some morphological characteristics in Turkish Tazi (Turkish hunting dog). Small Pet Veterinary Congress, Bursa, pp. 124.
Topal, M., Aksakal, V., Bayram, B. and Yaganoglu, A.M., 2010. An analysis of the factors affecting birth weight and actual milk yield in Swedish red cattle using regression tree analysis. J. Anim. Pl. Sci., 20: 63-69
Yakubu, A., 2012. Application of regression tree methodology in predicting the body weight of Uda sheep. Anim. Sci. Biotechnol., 45: 484-490.
Yılmaz, O., 2007. Some morphological characteristics of Kangal dogs raised in various regions of Turkey. Faculty of Agriculture, Department of Animal Science, University of Ankara, Ankara, pp. 50-59.
Yilmaz, O., 2008. Turkish Kangal (Karabash) shepherd dog, First ed. Impress Printing, Ankara, pp. 24.
Yilmaz, O. and Ertugrul, M., 2011. Some morphological characteristics of Turkish Tazi (Sight Tazi). J. Anim. Pl. Sci., 21: 794-799.
To share on other social networks, click on any share button. What are these?


