
Predicting Wheat Production in Pakistan by using an Artificial Neural Network Approach


Research Article
Predicting Wheat Production in Pakistan by using an Artificial Neural Network Approach
Faheem Aslam1*, Aneel Salman1 and Inayatullah Jan2
1Department of Management Sciences, Comsats University, Park Road, Islamabad, Pakistan; 2Institute of Development Studies (IDS), The University of Agriculture, Peshawar, Khyber Pakhtunkhwa, Pakistan.
Abstract | Forecasting of wheat production is of great importance for farmers and agriculture policy makers to improve production planning decisions. Numerous studies proved that traditional econometric techniques face significant challenges in out of sample predictability tests due to model uncertainty and parameter instability. Recent studies introduce several machine learning algorithms to improve time series prediction accuracy. The purpose of this study is to develop a precise wheat production model using artificial neural networks (ANN). A total of 71 years’ wheat production data from 1948 to 2018 is divided into training data and test data. The model is trained by using 53 years’ data and forecasts the future wheat production for the remaining 14 years. There are 16 indicators used as input variables for wheat production and top ten most important variables highlighted. The findings show, that the model captures much of the trend, and some of the undulations of the original series. The results reveal that the most important features in wheat production includes production prevailing trends, momentum and volatility.
Received | April 28, 2019; Accepted | September 05, 2019; Published | October 31, 2019
*Correspondence | Faheem Aslam, Department of Management Sciences, Comsats University, Park Road, Islamabad, Pakistan; Email: [email protected]
Citation | Aslam, F., A. Salman and I. Jan. 2019. Predicting wheat production in Pakistan by using an artificial neural network approach. Sarhad Journal of Agriculture, 35(4): 1054-1062.
DOI | http://dx.doi.org/10.17582/journal.sja/2019/35.4.1054.1062
Keywords | Wheat production, Forecasting, Machine learning, Neural networks, Pakistan
Introduction
The agriculture sector is one of the most essential components of Pakistan’s economy. In year 2016-2017, it contributed 21 percent to the gross domestic product (GDP) and generates 45 percent of productive employment in the country. More than 60 percent livelihood of the rural population depends on the agriculture sector. The agriculture sector plays a key role not only in economic growth, but it is one of the main sectors to reduce poverty, ensure food security and foreign earnings. Within agriculture sector, wheat is the most important grain and a staple food in Pakistan with a contribution of more than 2 percent of the country’s GDP. Pakistan is ranked 6th with only 3.5 percent of the world wheat production, with an average of 25 million tons per year (The details are available at: http://www.parc.gov.pk/files/parc_pk/January-15/Status%20Papers/status%20paper%20Wheat%20in%20Pakistan.pdf). With growing population, crop forecasting has become an important research area with several important implications. This study would be helpful for farmers and government to manage storage, transportation, support price and distribution. The findings would be very helpful to design next year import/export strategies. Overall, an accurate forecasting plays a vital role in mitigating food instability and price discovery.
Forecasting is making claims about something that will happen in the future, often based on historical and current data. Forecasting is not a new phenomenon as data analysts are frequently faced with the need to forecast a variable from a set of predictors. There are countless applications of forecasting in our daily life, including weather (Alley et al., 2019; Toth and Buizza, 2019), exchange rate (Rezaee et al., 2018), economic growth (Christensen et al., 2018), energy (He and Lin, 2018), transport (Field, 2018), sales (Sagaert et al., 2018), stock market index (Ren et al., 2018), harvest (Gupta et al., 2018), earthquakes (Ogata et al., 2018), terrorist attacks (Onat and Gul, 2018), heart attacks (Takci, 2018), loan default (Tiwari, 2018) and many more. The main objective of a good forecast is to minimize the forecasting error.
Several studies attempt to forecast crop forecasting particularly with respect to Pakistan (Ahmad et al., 2017; Ali et al., 2015; Masood et al., 2018; Haider et al., 2019). The most common predictors in past studies include rainfall, fertilizer, temperature, tractors and labor. A large number of studies have reported a very strong correlation between fertilizer and wheat production (Azhar et al., 1972, 1974; Mukhtar and Mukhtar, 1988; Saleem, 1989). The study of (Salam, 1981) highlighted that tractorization and labor are also the influency factors. Husnain et al. (2018) documented that endogeneity is a crucial issue in temperature-agriculture nexus.
Most of the researchers forecasted major crops with a variety of econometric models. The most common methods include Exponential Weighted Moving Average (Sabir and Tahir, 2012), Regression Analysis (Karim et al., 2005) and ARIMA model (Muhammad, 1992; Saeed et al., 2000; Badmus et al., 2011; Mehmood and Ahmad, 2013; Iqbal et al., 2005; Arivarasi et al., 2015; Badar et al., 2015; Ali et al., 2015; Zulfiqar and Hussain, 2014). Particularly, ARIMA model approach has remained the focus of massive studies for forecasting purpose. For instance, by using regression analysis, Karim et al. (2005) have forecasted wheat crop production in Bangladesh. Sabir and Tahir (2012) have forecasted wheat crop production with supply-demand projection using Exponential Smoothing model for Pakistan. A large number of studies applied ARIMA model for forecasting. For example, Muhammad (1992) has applied ARIMA model approach to forecast rice production in Pakistan and suggest proper measures to increasing exports. Likewise, Saeed et al. (2000) have forecasted wheat crop area and production employing ARIMA model. In Nigeria, Badmus et al. (2011) used ARIMA model to forecast maize cultivated area and yield. Recently, Mehmood and Ahmad (2013) employed ARIMA model to forecast area of in Pakistan while Arivarasi et al. (2015) applied this model to forecast vegetable trends in India. From a broader perspective, Badar et al. (2015) have used ARIMA model to forecast major food crops including wheat, rice, and maize, area, production and yield in Pakistan. In a similar study, Ali et al. (2015) have forecasted production and yield of cotton and sugarcane using ARIMA model.
In past, as compared to econometric models, application of machine learning in agriculture sector did not get much attention from the researcher. However, in last one decade, artificial neural networks (ANNs) have received great interest in various research fields such as engineering (Ahmadi, 2012; Jani et al., 2017; Shafiei et al., 2014), energy (Olatomiwa et al., 2016), petroleum and gas (Ahmadi and Ebadi, 2014), zoology (Karadas et al., 2017) and agriculture (Moldes et al., 2017; Soltanali et al., 2017; Jiang et al., 2004; Alvarez, 2009; Ghodsi et al., 2012; Haider et al., 2019). For instance, Khoshroo et al. (2018) perform sensitivity analysis of energy inputs in grape production by using ANN model. The authors reported that machinery, diesel fuel and labor had the greatest impact on grape yield. Relatedly, Dahikar and Rode (2014) applied feed forward back propagation ANN by using regional and soil parameters to predict crop yield in India. Very recently, Haider et al. (2019) applied LSTM model to predict wheat production in Pakistan. Artificial neural networks (ANN) have proved to be a more powerful and self-adaptive method as compared to traditional linear and simple nonlinear analyses (Simpson, 1994; Baret et al., 1995). ANN have been widely used for prediction of various complex systems (Naqvi et al., 2018; Haider et al., 2019). This method employs a nonlinear response function that iterates many times in a special network structure in order to learn the complex functional relationship between input and output training data.
In this study, we present Artificial Neural Network (ANN) based approach to forecast wheat production in Pakistan. We also calculate sixteen input indicators as input variables to predict wheat production. Finally, application of feature selection to find out the most important input indicators for wheat production in Pakistan makes this study different from others. The findings of this study would be helpful for farmers (adjust wheat cultivation), governments (wheat storage, food security) and investors (pricing, financial planning according to predicted production).
Materials and Methods
The data and methodology part consist on several steps. A brief detail of all the steps is given below.
Step 01: Data collection
For the purpose of this study annual wheat production data is obtained from Agriculture Marketing Information Service (AMIS). The annual data is collected from 1948 to 2018 (No. of observations = 71). In Table 1, summary statistics of annual wheat production are reported. The average wheat production is 12471 MT with a standard deviation of 7710 MT. It is clear from the (Figure 1), that wheat production in Pakistan has increasing trend with 3301 MT in 1948 to 25500 MT in 2018. The (Figure 2), shows the annual growth rate of wheat production in Pakistan. The average growth rate is only 3.58 percent with a standard deviation of 12.10 percent. The maximum growth of 51.54 percent was recorded in 1954 while the minimum growth rate was -24.63 percent in 1952. The growth rate is shown in Figure 2.
Step 02: Calculate indicator variables-data features
A total of 16 indicator variables are calculated for input, by using the TTR package in R. The details of the indicators are reported in the Table 2.
Table 1: Summary statistics of annual wheat production and annual growth rate.
|
Descriptive statistics |
Production (1000 MT) |
Growth rate |
|
Mean |
12471.11 |
3.58 |
|
Median |
11473.00 |
3.12 |
|
Mode |
7800.00 |
0.00 |
|
Standard Deviation |
7702.09 |
12.10 |
|
Kurtosis |
-1.25 |
4.83 |
|
Skewness |
0.34 |
1.25 |
|
Range |
24307.00 |
76.17 |
|
Minimum |
2367.00 |
-24.63 |
|
Maximum |
26674.00 |
51.54 |
|
Count |
71 |
71 |
Table 2: List of wheat production indicators.
|
Identifier |
Indicator name |
|
RSI |
Relative strength index |
|
MA |
Moving average |
|
MACD |
Moving average convergence/Divergence |
|
HMA |
Hull moving average |
|
APO |
Absolute price oscillator |
|
DPO |
Detrended price oscillator |
|
MOM |
Momentum |
|
MSW |
Mesa sine wave |
|
PPO |
Percentage price oscillator |
|
BB |
Bollinger bands |
|
DEMA |
Double exponential moving average |
|
EMA |
Exponential moving average |
|
KAMA |
Kaufman's Adaptive Moving Average |
|
TRIMA |
Triangular moving average |
|
WILDERS |
Wilders |
|
ZLEMA |
Zero lag exponential moving average |
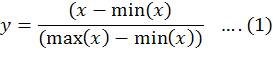
Step 03: Data transformation
In this step, Data type conversions, and scaling and normalization are performed by using Min Max normalization. Below Equation 1 is used for data transformation.
Step 05: Training and testing data
The data is divided into training and test data sets by using the 80:20 ratio. The training data (N=53, 1948-2004) refers to the data which is solely used to train the predictive models. The machine learning algorithm picks up the tuples from training dataset and tries to find out patterns and learn from the various observation instances. While the test data (N=14, 2005-2018) is used to get predictions and accuracy of the model. It is important to keep the actual data for the forecast period so that we can assess the precision of our forecast and compare it to the actual realizations.
Step 06: Model training
In this step, we used artificial neural network (ANN) machine learning algorithms and feed the training data features to them and build the predictive model.
Step 07: Predictive model
We have used Neural networks for prediction task. A brief introduction is given below:
Neural Networks: Neural networks are human brain-inspired processors which have ability to learn by training and then store the learned experience for use at later stage when required. They have the ability to derive meaning from complicated data. Neural networks have advantages as compared to the traditional linear models due to their non-linear nature. They have the capability to recognize the non-linear relationship in the input data sample without priori assumption of knowledge of relation between input and output variables. Neural networks have the ability to change its parameters (weights) when dealing with non-stationary and dynamic data. A special function like sigmoid transforms input variables into output variables.
Various models are used for variety of purposes in different fields. Commonly used models include feed forward neural network, back propagation neural network, and multilayer perceptron. Back-propagation is a feed-forward neural network structure which takes the input to the network and multiplies it by the weights on the connections between neurons (also called nodes), sums their product and passes it through a threshold function (normally sigmoid function) to produce an output.
To minimize the error between output and target (actual), error is propagated back into the network. The weights between neurons, on each of the connection are adjusted to the size of the initial error. The input data are fed forward again to produce new output and error. This process continues till the acceptable level of error is achieved. Sigmoid function is the most commonly used transfer function in neural networks and its value ranges from 0 to 1.
For analysis purpose, we used packages of “caret” to run the neural network and package “ROCR” for model evaluation.
Step 08: Model selection
At start we use 16 features. In model selection step, based on maximum accuracy, we select top ten indicators from several iterations of predictive models.
Step 09: Hyperparameter optimization
After feature selection, we try to choose a set of the hyperparameters used by the algorithm in the model such that the performance of the model is optimal with regards to its prediction accuracy.
Results and Discussion
In Model 1 (full model) 18 input variables were used as input variable, while the wheat production was the output variable. The ANN model consists of three layers. The first layer is the input layer, which consists of 18 input variables, the second layer is the hidden layer, with 5 nodes, while the third layer is the output layer, which is the wheat production. The architecture of the model is shown in (Figure 4). The number of layers and hidden nodes are selected by performing hyperparameter optimization. 100 models ere bootstrapped to find out the best combination. The main objective is to minimize the prediction error.
The relationship of RMSE with number of neurons and weight decay is reported in the (Figure 5). We can see that the forecasting error is minimum by using 5 nodes and weight decay = .0001. By using the full model, we found mean absolute error (MAE) of 0.05, mean squared error (MSE) of 0.004 and mean absolute percentage error (MAPE) of 5.20.
After running the model one, feature selection is done on the basis of relative importance to predict the wheat production. The results are reported in (Figure 6). The top influencing input indicators include DPO, HMA, PPO, EMA, RSI and so on. However, our results confirm that ZELMA and MSW have very little impact on Wheat Production.
The results reveal that the most important features in wheat production includes production prevailing trends, momentum and volatility, which in turn use to estimate the length of wheat production cycles from peak to peak, or trough to trough, reducing lag, increasing responsiveness by weighting more recent years heavily. The will expand and contract as the price action of an issue becomes volatile or becomes bound into a tight trading pattern.
Table 3: Actual Vs forecasted wheat production 2005-2018.
|
Year |
Actual production (MT) |
Forecast |
Absolute value of % error |
||
|
Full model |
Selected features |
Full model |
Selected features |
||
|
2005 |
21612 |
21656 |
20181 |
0.20 |
6.62 |
|
2006 |
21277 |
22591 |
20647 |
6.18 |
2.96 |
|
2007 |
23295 |
22908 |
21226 |
1.66 |
8.88 |
|
2008 |
20959 |
17802 |
20886 |
15.06 |
0.35 |
|
2009 |
24033 |
24493 |
21851 |
1.92 |
9.08 |
|
2010 |
23311 |
22675 |
22231 |
2.73 |
4.63 |
|
2011 |
25214 |
24029 |
19854 |
4.70 |
21.26 |
|
2012 |
23473 |
20034 |
22560 |
14.65 |
3.89 |
|
2013 |
24211 |
22490 |
21969 |
7.11 |
9.26 |
|
2014 |
25979 |
25973 |
23384 |
0.02 |
9.99 |
|
2015 |
25086 |
23861 |
21681 |
4.89 |
13.58 |
|
2016 |
25633 |
24537 |
23018 |
4.27 |
10.20 |
|
2017 |
26674 |
26001 |
23852 |
2.52 |
10.58 |
|
2018 |
25500 |
23745 |
22452 |
6.88 |
11.95 |
|
MAPE [mean absolute percentage error] |
5.20 |
8.80 |
|||
Test data was 0.2*71=14 years (2005-2018).
In model II, top ten importance variables ere used as input variables while wheat production is the output variable. The architecture of ANN model with selected features is shown in (Figure 7). The model is optimized by using hyperparameter optimization. After bootstrapping 100 different models, it is clear in (Figure 8), that weight decay of .0001 with 5 neurons is the optimal ANN architecture. In model II, 8 input variables are removed but the accuracy decline is very small because of their least importance in forecasting. In Model II, we found a slight increase in the forecasting error. The results show that MAPE increased to 8.80 from 5.20.
The test data was 20 percent of the total data. So, we have 14 years (2005-2018) to validate our ANN model. In Table 3, we report the actual wheat production (MT) and forecasted production using full model and model with selected features. The (Figure 9) shows the movement of actual and predicted wheat production from 2005 to 2018. The absolute value of the % error is reported from 2005 to 2018. It is evident from the (Figure 9) that ANN model captures much of the trend, and some of the undulations of the original series. Overall, the model performs very well. We can observe the same patterns between actual and predicted values with very small differences.
These results can be compared with relevant studies in different countries. For instance, Safa et al. (2015) used ANN model to predict wheat production in New Zealand. According to this study the most influential factors in New Zealand includes farm conditions, machinery conditions, and farm inputs. However, this study is limited to wheat fields in Canterbury only. Our study is in line with Haider et al. (2019). The authors applied LSTM neural network to predict wheat production in Pakistan and reported that neural networks perdition can be used as guidelines for wheat prediction. In comparison, our study used 78 years of data with 16 indicators to find out the best inputs for wheat prediction. Relatedly, Dahikar and Rode (2014) applied feed forward back propagation ANN by using PH, temperature, rainfall, depth and nitrogen predict crop yield in India. The authors suggest that ANN model is beneficial tool for crop prediction. However, this study mainly focused on the best ANN model and software selection. The authors recommend Matlab for efficient analysis. Finally, the study of Gandhi et al. (2016) used neural networks explore the factors affecting the rice production for various districts of Maharashtra state in India. By using 5 years data of 27 districts, the authors documented that by using ANN models, an accuracy of accuracy of above 95 percent can be achieved.
Conclusions and Recommendations
Focus of this study was forecast of wheat production in Pakistan. Artificial Neural Network (ANN) model was employed by using the annual wheat production from 1948 to 2018. The data was divided into training data (80 percent) and test data (20 percent). The model was optimized by using hyperparameter tuning. In model I, the wheat production was the output while 18 indicators were used as input variables. Feature selection was done to find out the most important input variables in wheat production. The top influencing input indicators include DPO, HMA, PPO, EMA, RSI. In other words, production trends, momentum and volatility which estimate production cycle, lags reduction and increase in responsiveness are the important features in wheat production. In model II, top ten relatively important indicators were used as input variables. The findings show a slight decline in the prediction accuracy in model II. The findings suggest that feature selection is an important consideration while predicting wheat production. This study may have important implications for policy makes, farmers and investors. For instance, the government can design adequate policies regarding wheat cultivation, storage, food security and pricing. Likewise, the farmers can adjust the wheat cultivation to avoid heavy losses due to wheat surplus. Furthermore, consideration of the most important wheat production indicators can be helpful for decision making.
Novelty Statement
We presented Artificial Neural Network (ANN) based approach to forecast wheat production in Pakistan. We also calculated sixteen input indicators and finally, application of feature selection to find out the most important input indicators for wheat production in Pakistan makes this study different from others.
Faheem Aslam developed the theoretical formalism, data collection, performed the data analytics and R coding. Aneel Salman wrote the manuscript. Inayatullah Jan contributed to preparation of final version of the manuscript and supervised the project. All authors provided critical feedback and helped shape the research, analysis and manuscript.
References
Ahmad, D., M.I. Chani and A.A. Humayon. 2017. Major crops forecasting area, production and yield evidence from agriculture sector of Pakistan. Sarhad J. Agric. 33(3): 385-396. https://doi.org/10.17582/journal.sja/2017/33.3.385.396
Ahmadi, M.A. and M. Ebadi. 2014. Evolving smart approach for determination dew point pressure through condensate gas reservoirs. Fuel. 117: 074-1084. https://doi.org/10.1016/j.fuel.2013.10.010
Ahmadi, M.A., 2012. Neural network based unified particle swarm optimization for prediction of asphaltene precipitation. Fluid Phase Equilib. 314: 46-51. https://doi.org/10.1016/j.fluid.2011.10.016
Ali, S., N. Badar and H. Fatima. 2015. Forecasting production and yield of sugarcane and cotton crops of Pakistan for 2013-2030. Sarhad J. Agric. 31(1): 1-10.
Alley, R.B., Emanuel, K.A. and Zhang, F. 2019. Advances in weather prediction. Science. 363(6425): 342-344. https://doi.org/10.1126/science.aav7274
Alvarez, R. 2009. Predicting average regional yield and production of wheat in the Argentine Pampas by an artificial neural network approach. Eur. J. Agron. 30(2): 70-77. https://doi.org/10.1016/j.eja.2008.07.005
Arivarasi, R and M. Ganesan. 2015. Time series analysis of vegetable production and forecasting using ARIMA model. Asia. J. Sci. Technol. 06 (10): 1844-1848.
Azhar, B.A., Chaudhary, M.G. and M. Shafique. 1972. A model for forecasting wheat production in the Punjab, Pak. Dev. Rev. 11(2): 407-415. https://doi.org/10.30541/v12i4pp.407-415
Azhar, B.A., M.G. Chaudhary and M. Shafique. 1974. A forecast of wheat production in the Punjab for 1973-1974. Pak. Dev. Rev. 13(1): 106-112. https://doi.org/10.30541/v13i1pp.106-112
Badar, N., H. Fatima., A. Jabbar and M. Asif. 2015. Major food crops production and yield forecast in Pakistan. Pak. J. Agric. Res. 28: 295-303.
Badmus, M.A and O.S. Ariyo. 2011. Forecasting cultivated areas and production of maize in nigeria using ARIMA model. Asia. J. Agric. Sci. 3(3): 171-176.
Baret, F., J.G.P.W. Clevers and M.D. Steven. 1995. The robustness of canopy gap fraction estimates from red and near-infrared reflectances: A comparison of approaches. Remote Sens. Environ. 54(2): 141-151. https://doi.org/10.1016/0034-4257(95)00136-O
Christensen, P., K. Gillingham and W. Nordhaus. 2018. Uncertainty in forecasts of long-run economic growth. Proc. Nat. Acad. Sci. 115(21): 5409-5414. https://doi.org/10.1073/pnas.1713628115
Dahikar, S.S. and S.V. Rode. 2014. Agricultural crop yield prediction using artificial neural network approach. Int. J. Innov. Res. Electr. Electron. Instrum. Control Eng. 2(1): 683-686.
Field, B. 2018. Forecasting techniques for urban and regional planning. Routledge. https://doi.org/10.4324/9781351062503
Gandhi, N., O. Petkar and L.J. Armstrong. 2016. Rice crop yield prediction using artificial neural networks. In 2016 IEEE Tech. Innov. ICT Agric. Rural Dev. (TIAR). pp. 105-110. IEEE. https://doi.org/10.1109/TIAR.2016.7801222
Ghodsi, R., R.M. Yani, R. Jalali and M. Ruzbahman. 2012. Predicting wheat production in Iran using an artificial neural networks approach. Int. J. Acad. Res. Bus. Soc. Sci. 2(2): 34.
Gupta, S., A. Singh, A. Kumar, U.P. Shahi, N.K. Sinha and S. Roy. 2018. Yield forecasting of wheat and mustard for western Uttar Pradesh using statistical model. J. Agrometeorol. 20(1): 66-68.
Haider, S.A., S.R. Naqvi, T. Akram, G.A. Umar, A. Shahzad, M.R. Sial and M. Kamran. 2019. LSTM Neural Network Based Forecasting Model for Wheat Production in Pakistan. Agron. 9(2): 72. https://doi.org/10.3390/agronomy9020072
He, Y. and B. Lin. 2018. Forecasting China’s total energy demand and its structure using ADL-MIDAS model. Energy. 151: 420-429. https://doi.org/10.1016/j.energy.2018.03.067
Husnain, M.I., A. Salman, I. Jan and T. Mahmood. 2018. Does Endogeneity Undermine Temperature Impact on Agriculture in South Asia? Sarhad J. Agric. 34(2): 334-341. https://doi.org/10.17582/journal.sja/2018/34.2.334.341
Iqbal, N., K. Bakhsh. K. Maqbool and A.S. Ahmad. 2005. Use of the ARIMA model for forecasting wheat area and production in Pakistan. Int. J. Agric. Biol. 2: 352-354.
Jani, D.B., M. Mishra and P.K. Sahoo. 2017. Application of artificial neural network for predicting performance of solid desiccant cooling systems. A review. Renewable Sustainable Energy Rev. 80: 352-366. https://doi.org/10.1016/j.rser.2017.05.169
Jiang, D., X. Yang, N. Clinton and N. Wang. 2004. An artificial neural network model for estimating crop yields using remotely sensed information. Int. J. Remote Sens. 25(9): 1723-1732. https://doi.org/10.1080/0143116031000150068
Karadas, K., M. Tariq, M.M. Tariq and E. Eyduran. 2017. Measuring predictive performance of data mining and artificial neural network algorithms for predicting lactation milk yield in indigenous Akkaraman Sheep. Pak. J. Zool. 49(1): 1-8. https://doi.org/10.17582/journal.pjz/2017.49.1.1.7
Karim. R, A. Awal and M. Akhtar. 2005. Forecasting of wheat production in Bangladesh. J. Agric. Soc. Sci. 1: 120-122.
Khoshroo, A., A. Emrouznejad, A. Ghaffarizadeh, M. Kasraei and M. Omid. 2018. Sensitivity analysis of energy inputs in crop production using artificial neural networks. J. Cleaner Prod. 197: 992-998. https://doi.org/10.1016/j.jclepro.2018.05.249
Masood, M.A., I. Raza and S. Abid. 2018. Forecasting wheat production using time series models in Pakistan. Asian J. Agric. Rural Dev. 8(2): 172-177.
Mehmood, S. and Z. Ahmad. 2013. Time series model to forecast areas of mangoes from Pakistan: An application of univariate ARIMA model. Acad. Contemp. Res. J. 2(1): 10-15.
Moldes, O.A., J.C. Mejuto, R. Rial-Otero and J. Simal-Gandara. 2017. A critical review on the applications of artificial neural networks in winemaking technology. Crit. Rev. Food Sci. Nutr. 57: 2896-2908. https://doi.org/10.1080/10408398.2015.1078277
Muhammad, F., M. Siddique, M. Bashir and S. Ahmad. 1992. Forecasting rice production in Pakistan using ARIMA models. J. Anim. Plant Sci. 2: 27-31.
Mukhtar, M.E. and H. Mukhtar. 1988. Input Use and Productivity across Farm Sizes: A Comparison of the Two Punjabs. Pak. Dev. Rev. 27(4): 595-604. https://doi.org/10.30541/v27i4IIpp.595-604
Naqvi, S., T. Akram, S. Haider, M. Kamran, A. Shahzad, W. Khan, T. Iqbal, T. and H. Umer. 2018. Precision modeling: Application of metaheuristics on current–voltage curves of superconducting films. Electronics, 7(8): 1-13.
Negrete, J.C. 2018. Artificial Neural Networks in Mexican Agriculture, A Overview. Int. J. Res. Agric. For. 5:1-9.
Ogata, Y., K. Katsura, H. Tsuruoka and N. Hirata. 2018. Exploring magnitude forecasting of the next earthquake. Seismol. Res. Lett. 89(4): 1298-1304. https://doi.org/10.1785/0220180034
Olatomiwa, L., S. Mekhilef, M.S. Ismail and M. Moghavvemi. 2016. Energy management strategies in hybrid renewable energy systems. Rev. Renewable Sustainable Energy Rev. 62: 821-835. https://doi.org/10.1016/j.rser.2016.05.040
Onat, I. and Z. Gul. 2018. Terrorism risk forecasting by ideology. Eur. J. Criminal Policy Res. 24(4): 433-449. https://doi.org/10.1007/s10610-017-9368-8
Ren, R., D.D. Wu and T. Liu. 2018. Forecasting Stock Market Movement Direction Using Sentiment Analysis and Support Vector Machine. IEEE Syst. J. (99): 1-11. https://doi.org/10.1109/JSYST.2018.2794462
Rezaee, M.J., M. Jozmaleki and M. Valipour. 2018. Integrating dynamic fuzzy C-means, data envelopment analysis and artificial neural network to online prediction performance of companies in stock exchange. Physica A: Statistical Mechanics and its Applications. 489: 78-93. https://doi.org/10.1016/j.physa.2017.07.017
Sabir, H.M. and S.H. Tahir. 2012. Supply and demand projections of wheat in Punjab for the Year 2011-12. Interdisciplin. J. Contemp. Res. Bus. 3: 800-808.
Saeed, N., A. Saeed., M. Zakir and T.M. Bajwa. 2000. Forecasting of wheat production in Pakistan using ARIMA models. Int. J. Agric. Biol. 2: 352-353.
Safa, M., S. Samarasinghe and M. Nejat. 2018. Prediction of wheat production using artificial neural networks and investigating indirect factors affecting it: Case study in Canterbury province, New Zealand. J. Agric. Sci. Technol. 17: 791-803.
Sagaert, Y.R., E.H. Aghezzaf, N. Kourentzes and B. Desmet. 2018. Tactical sales forecasting using a very large set of macroeconomic indicators. Eur. J. Oper. Res. 264(2): 558-569. https://doi.org/10.1016/j.ejor.2017.06.054
Salam, A. 1981. Farm Tractorization, Fertilizer Use and Productivity of Mexican Wheat in Pakistan. Pak. Dev. Rev. 20(3): 323-345. https://doi.org/10.30541/v20i3pp.323-345
Saleem, M.A. 1989. Farmers’ Attitude Towards Risk in Dryland Wheat Production Areas in Jordan. Univ. Jordan, Dirasat Agric. Sci. 16(7): 28-52.
Shafiei, A., M.A. Ahmadi, S.H. Zaheri, A. Baghban, A. Amirfakhrian and R. Soleimani. 2014. Estimating hydrogen sulfide solubility in ionic liquids using a machine learning approach. J. Supercrit. Fluids. 95: 525-534. https://doi.org/10.1016/j.supflu.2014.08.011
Simpson, G. 1994. Crop yield prediction using a CMAC neural network. In image and signal processing for remote sensing. Int. Soc. Opt. Photonics. (2315): 160-172. https://doi.org/10.1117/12.196712
Soltanali, H., A. Nikkhah and A. Rohani. 2017. Energy audit of Iranian kiwifruit production using intelligent systems. Energy. 139: 646-654. https://doi.org/10.1016/j.energy.2017.08.010
Takci, H. 2018. Improvement of heart attack prediction by the feature selection methods. Turk. J. Electr. Eng. Amp. Comput. Sci. 26(1): 1-10. https://doi.org/10.3906/elk-1611-235
Tiwari, A.K. 2018. Machine learning application in loan default prediction. Mach. Learn. 4(5): 1:5
Toth, Z., and R. Buizza. 2019. Weather forecasting: what sets the forecast skill horizon? Sub-Seasonal to Seasonal Prediction. 17-45. https://doi.org/10.1016/B978-0-12-811714-9.00002-4
Zulfiqar, F. and A. Hussain. 2014. Forecasting wheat production gaps to assess the state of future food security in Pakistan. J. Food Nutr. Disord. 3(3): 1-6.
To share on other social networks, click on any share button. What are these?


